Ballarat Airbnb Market Analysis 2026: Short Term Rental Data & Vacation Rental Statistics in Victoria, Australia
Is Airbnb profitable in Ballarat in 2026? Explore comprehensive Airbnb analytics for Ballarat, Victoria, Australia to uncover income potential. This 2026 STR market report for Ballarat, based on AirROI data from February 2025 to January 2026, reveals key trends in the market of 409 active listings.
Whether you're considering an Airbnb investment in Ballarat, optimizing your existing vacation rental, or exploring rental arbitrage opportunities, understanding the Ballarat Airbnb data is crucial. Leveraging the low regulation environment is key to maximizing your short term rental income potential. Let's dive into the specifics.
Key Ballarat Airbnb Performance Metrics Overview
Monthly Airbnb Revenue Variations & Income Potential in Ballarat (2026)
Understanding the monthly revenue variations for Airbnb listings in Ballarat is key to maximizing your short term rental income potential. Seasonality significantly impacts earnings. Our analysis, based on data from the past 12 months, shows that the peak revenue month for STRs in Ballarat is typically October, while June often presents the lowest earnings, highlighting opportunities for strategic pricing adjustments during shoulder and low seasons. Explore the typical Airbnb income in Ballarat across different performance tiers:
- Best-in-class properties (Top 10%) achieve $3,802+ monthly, often utilizing dynamic pricing and superior guest experiences.
- Strong performing properties (Top 25%) earn $2,756 or more, indicating effective management and desirable locations/amenities.
- Typical properties (Median) generate around $1,859 per month, representing the average market performance.
- Entry-level properties (Bottom 25%) see earnings around $1,040, often with potential for optimization.
Average Monthly Airbnb Earnings Trend in Ballarat
Ballarat Airbnb Occupancy Rate Trends (2026)
Maximize your bookings by understanding the Ballarat STR occupancy trends. Seasonal demand shifts significantly influence how often properties are booked. Typically, Octobersees the highest demand (peak season occupancy), while June experiences the lowest (low season). Effective strategies, like adjusting minimum stays or offering promotions, can boost occupancy during slower periods. Here's how different property tiers perform in Ballarat:
- Best-in-class properties (Top 10%) achieve 82%+ occupancy, indicating high desirability and potentially optimized availability.
- Strong performing properties (Top 25%) maintain 67% or higher occupancy, suggesting good market fit and guest satisfaction.
- Typical properties (Median) have an occupancy rate around 47%.
- Entry-level properties (Bottom 25%) average 25% occupancy, potentially facing higher vacancy.
Average Monthly Occupancy Rate Trend in Ballarat
Average Daily Rate (ADR) Airbnb Trends in Ballarat (2026)
Effective short term rental pricing strategy in Ballarat involves understanding monthly ADR fluctuations. The Average Daily Rate (ADR) for Airbnb in Ballarat typically peaks in December and dips lowest during March. Leveraging Airbnb dynamic pricing tools or strategies based on this seasonality can significantly boost revenue. Here's a look at the typical nightly rates achieved:
- Best-in-class properties (Top 10%) command rates of $242+ per night, often due to premium features or locations.
- Strong performing properties (Top 25%) achieve nightly rates of $181 or more.
- Typical properties (Median) charge around $136 per night.
- Entry-level properties (Bottom 25%) earn around $104 per night.
Average Daily Rate (ADR) Trend by Month in Ballarat
Get Live Ballarat Market Intelligence 👇

Explore Real-time Analytics
Airbnb Seasonality Analysis & Trends in Ballarat (2026)
Peak Season (October, July, December)
- Revenue averages $2,572 per month
- Occupancy rates average 52.1%
- Daily rates average $161
Shoulder Season
- Revenue averages $2,096 per month
- Occupancy maintains around 47.4%
- Daily rates hold near $152
Low Season (February, May, June)
- Revenue drops to average $1,644 per month
- Occupancy decreases to average 40.0%
- Daily rates adjust to average $146
Seasonality Insights for Ballarat
- The Airbnb seasonality in Ballarat shows moderate seasonality with distinct peak and low periods. While the sections above show seasonal averages, it's also insightful to look at the extremes:
- During the high season, the absolute peak month showcases Ballarat's highest earning potential, with monthly revenues capable of climbing to $2,957, occupancy reaching a high of 58.9%, and ADRs peaking at $169.
- Conversely, the slowest single month of the year, typically falling within the low season, marks the market's lowest point. In this month, revenue might dip to $1,586, occupancy could drop to 37.0%, and ADRs may adjust down to $143.
- Understanding both the seasonal averages and these monthly peaks and troughs in revenue, occupancy, and ADR is crucial for maximizing your Airbnb profit potential in Ballarat.
Seasonal Strategies for Maximizing Profit
- Peak Season: Maximize revenue through premium pricing and potentially longer minimum stays. Ensure high availability.
- Low Season: Offer competitive pricing, special promotions (e.g., extended stay discounts), and flexible cancellation policies. Target off-season travelers like remote workers or budget-conscious guests.
- Shoulder Seasons: Implement dynamic pricing that balances peak and low rates. Target weekend travelers or specific events. Offer slightly more flexible terms than peak season.
- Regularly analyze your own performance against these Ballarat seasonality benchmarks and adjust your pricing and availability strategy accordingly.
Best Areas for Airbnb Investment in Ballarat (2026)
Exploring the top neighborhoods for short-term rentals in Ballarat? This section highlights key areas, outlining why they are attractive for hosts and guests, along with notable local attractions. Consider these locations based on your target guest profile and investment strategy.
| Neighborhood / Area | Why Host Here? (Target Guests & Appeal) | Key Attractions & Landmarks |
|---|---|---|
| Central Ballarat | The heart of Ballarat, offering rich history, culture, and easy access to major attractions. It's ideal for tourists exploring local heritage and arts. | Eureka Stockade, Art Gallery of Ballarat, Ballarat Botanical Gardens, Sovereign Hill, Lake Wendouree |
| Mount Pleasant | A suburban area known for its family-friendly atmosphere and spacious homes. Great for longer stays and attracting families or groups visiting the city. | Mount Pleasant Reservoir, Local parks and playgrounds, Proximity to schools and shopping |
| Black Hill | A quiet, scenic neighbourhood boasting stunning views and proximity to natural attractions, ideal for nature lovers and those seeking tranquility. | Black Hill Reserve, Local walking trails, Views of the Ballarat skyline |
| Lake Wendouree | A popular area for outdoor enthusiasts, known for its beautiful lake and parks. Ideal for tourists looking to engage with nature and outdoor activities. | Lake Wendouree, Botanical Gardens, Rowing Club, Walking and biking tracks |
| Sebastopol | A growing suburb just outside the city center, appealing to budget-conscious travelers seeking more affordable accommodations while still being close to attractions. | Sebastopol Market, Local parks, Shopping facilities |
| Buninyong | A charming township just south of Ballarat, known for its quaint atmosphere and historical sites. It's perfect for those looking to immerse themselves in local culture. | Buninyong Botanic Gardens, Buninyong Golf Club, Local cafes and shops |
| Miners Rest | A suburban area with a relaxed vibe, appealing to families and groups looking for spacious housing options with easy access to the city. | Local parks, Miners Rest Community Centre, Close to Ballarat city |
| Ballarat East | A developing area with access to healthcare and amenities, ideal for guests looking for a local experience while being near the city. | Ballarat Base Hospital, Local schools and markets, Parks and recreational facilities |
Understanding Airbnb License Requirements & STR Laws in Ballarat (2026)
While Ballarat, Victoria, Australia currently shows low STR regulations, specific Airbnb license requirements might still exist or change. Always verify the latest short term rental regulations and Airbnb license requirements directly with local government authorities for Ballarat to ensure full compliance before hosting.
(Source: AirROI data, 2026, based on 0% licensed listings)
Top Performing Airbnb Properties in Ballarat (2026)
Benchmark your potential! Explore examples of top-performing Airbnb properties in Ballaratbased on Trailing Twelve Month (TTM) revenue. Analyze their characteristics, revenue, occupancy rate, and ADR to understand what drives success in this market.

Ballarat Central Family Getaway
Entire Place • 5 bedrooms

Botanica - The perfect weekend away - 3pm checkout
Entire Place • 3 bedrooms
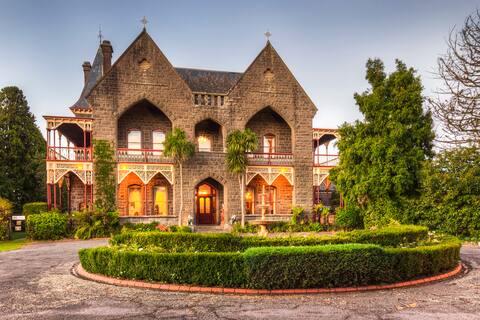
Bishops Palace Ballarat
Private Room • 6 bedrooms
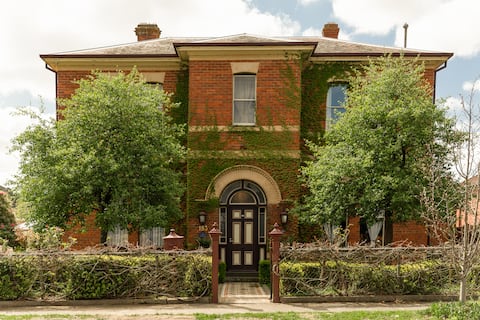
Aurum House; heritage style and comfort
Entire Place • 7 bedrooms

Sleeps 24; 4.5 bathrooms; side by side listing
Entire Place • 8 bedrooms

Luxe Home|3 Bed|3 Bath|Wood Fire|Air-Con|Sleeps 8
Entire Place • 3 bedrooms
Note: Performance varies based on location, size, amenities, seasonality, and management quality. Data reflects the past 12 months.
Top Performing Airbnb Hosts in Ballarat (2026)
Learn from the best! This table showcases top-performing Airbnb hosts in Ballarat based on the number of properties managed and estimated total revenue over the past year. Analyze their scale and performance metrics.
| Host Name | Properties | Grossing Revenue | Stay Reviews | Avg Rating |
|---|---|---|---|---|
| Tom | 17 | $433,252 | 1203 | 4.86/5.0 |
| Jessica | 13 | $259,634 | 1977 | 4.68/5.0 |
| Linda | 7 | $223,081 | 2818 | 4.84/5.0 |
| Flairbnb Ballarat | 16 | $189,905 | 161 | 4.71/5.0 |
| David | 1 | $152,855 | 25 | 5.00/5.0 |
| Dion | 4 | $152,650 | 387 | 4.90/5.0 |
| Lauren | 7 | $147,587 | 886 | 4.86/5.0 |
| Joyce | 6 | $125,981 | 117 | 4.84/5.0 |
| Brianna | 5 | $118,351 | 213 | 4.83/5.0 |
| Craig | 2 | $116,998 | 608 | 4.81/5.0 |
Analyzing the strategies of top hosts, such as their property selection, pricing, and guest communication, can offer valuable lessons for optimizing your own Airbnb operations in Ballarat.
Dive Deeper: Advanced Ballarat STR Market Data (2026)
Ready to unlock more insights? AirROI provides access to advanced metrics and comprehensive Airbnb data for Ballarat. Explore detailed analytics beyond this report to refine your investment strategy, optimize pricing, and maximize your vacation rental profits.
Explore Advanced MetricsBallarat Short-Term Rental Market Composition (2026): Property & Room Types
Room Type Distribution
Property Type Distribution
Market Composition Insights for Ballarat
- The Ballarat Airbnb market composition is heavily skewed towards Entire Home/Apt listings, which make up 89.7% of the 409 active rentals. This indicates strong guest preference for privacy and space.
- Looking at the property type distribution in Ballarat, House properties are the most common (75.1%), reflecting the local real estate landscape.
- Houses represent a significant 75.1% portion, catering likely to families or larger groups.
- The presence of 6.4% Hotel/Boutique listings indicates integration with traditional hospitality.
- Smaller segments like others, unique stays, outdoor/unique (combined 3.3%) offer potential for unique stay experiences.
Ballarat Airbnb Room Capacity Analysis (2026): Bedroom Distribution
Distribution of Listings by Number of Bedrooms
Room Capacity Insights for Ballarat
- The dominant room capacity in Ballarat is 3 bedrooms listings, making up 31.1% of the market. This suggests a strong demand for properties suitable for families or small groups.
- Together, 3 bedrooms and 2 bedrooms properties represent 55.5% of the active Airbnb listings in Ballarat, indicating a high concentration in these sizes.
- A significant 49.0% of listings offer 3+ bedrooms, catering to larger groups and families seeking more space in Ballarat.
Ballarat Vacation Rental Guest Capacity Trends (2026)
Distribution of Listings by Guest Capacity
Guest Capacity Insights for Ballarat
- The most common guest capacity trend in Ballarat vacation rentals is listings accommodating 6 guests (24.7%). This suggests the primary traveler segment is likely larger groups.
- Properties designed for 6 guests and 4 guests dominate the Ballarat STR market, accounting for 46.9% of listings.
- 48.4% of properties accommodate 6+ guests, serving the market segment for larger families or group travel in Ballarat.
- On average, properties in Ballarat are equipped to host 4.8 guests.
Ballarat Airbnb Booking Patterns (2026): Available vs. Booked Days
Available Days Distribution
Booked Days Distribution
Booking Pattern Insights for Ballarat
- The most common availability pattern in Ballarat falls within the 271-366 days range, representing 33% of listings. This suggests many properties have significant open periods on their calendars.
- Approximately 65.0% of listings show high availability (181+ days open annually), indicating potential for increased bookings or specific owner usage patterns.
- For booked days, the 91-180 days range is most frequent in Ballarat (31.5%), reflecting common guest stay durations or potential owner blocking patterns.
- A notable 36.2% of properties secure long booking periods (181+ days booked per year), highlighting successful long-term rental strategies or significant owner usage.
Ballarat Airbnb Minimum Stay Requirements Analysis
Distribution of Listings by Minimum Night Requirement
1 Night
105 listings
25.7% of total
2 Nights
136 listings
33.3% of total
3 Nights
3 listings
0.7% of total
4-6 Nights
6 listings
1.5% of total
7-29 Nights
6 listings
1.5% of total
30+ Nights
153 listings
37.4% of total
Key Insights
- The most prevalent minimum stay requirement in Ballarat is 30+ Nights, adopted by 37.4% of listings. This highlights the market's preference for longer commitments.
- A significant segment (37.4%) caters to monthly stays (30+ nights) in Ballarat, pointing to opportunities in the extended-stay market.
Recommendations
- Align with the market by considering a 30+ Nights minimum stay, as 37.4% of Ballarat hosts use this setting.
- If feasible, allowing 1-night stays, especially midweek or during low season, could capture last-minute bookings, as only 25.7% currently do.
- Explore offering discounts for stays of 30+ nights to attract the 37.4% of the market seeking extended stays.
- Adjust minimum nights based on seasonality – potentially shorter during low season and longer during peak demand periods in Ballarat.
Ballarat Airbnb Cancellation Policy Trends Analysis (2026)
Super Strict 30 Days
5 listings
1.2% of total
Limited
5 listings
1.2% of total
Flexible
88 listings
21.5% of total
Moderate
175 listings
42.8% of total
Firm
102 listings
24.9% of total
Strict
34 listings
8.3% of total
Cancellation Policy Insights for Ballarat
- The prevailing Airbnb cancellation policy trend in Ballarat is Moderate, used by 42.8% of listings.
- There's a relatively balanced mix between guest-friendly (64.3%) and stricter (33.2%) policies, offering choices for different guest needs.
- Strict cancellation policies are quite rare (8.3%), potentially making listings with this policy less competitive unless justified by high demand or property type.
Recommendations for Hosts
- Consider adopting a Moderate policy to align with the 42.8% market standard in Ballarat.
- Using a Strict policy might deter some guests, as only 8.3% of listings use it. Evaluate if potential revenue protection outweighs possible lower booking rates.
- Regularly review your cancellation policy against competitors and market demand shifts in Ballarat.
Ballarat STR Booking Lead Time Analysis (2026)
Average Booking Lead Time by Month
Booking Lead Time Insights for Ballarat
- The overall average booking lead time for vacation rentals in Ballarat is 51 days.
- Guests book furthest in advance for stays during December (average 84 days), likely coinciding with peak travel demand or local events.
- The shortest booking windows occur for stays in February (average 25 days), indicating more last-minute travel plans during this time.
- Seasonally, Fall (57 days avg.) sees the longest lead times, while Spring (42 days avg.) has the shortest, reflecting typical travel planning cycles.
Recommendations for Hosts
- Use the overall average lead time (51 days) as a baseline for your pricing and availability strategy in Ballarat.
- For December stays, consider implementing length-of-stay discounts or slightly higher rates for bookings made less than 84 days out to capitalize on advance planning.
- Target marketing efforts for the Fall season well in advance (at least 57 days) to capture early planners.
- Monitor your own booking lead times against these Ballarat averages to identify opportunities for dynamic pricing adjustments.
Popular & Essential Airbnb Amenities in Ballarat (2026)
Amenity Prevalence
Amenity Insights for Ballarat
- Essential amenities in Ballarat that guests expect include: TV, Heating, Smoke alarm. Lacking these (any) could significantly impact bookings.
- Popular amenities like Kitchen, Hot water, Wifi are common but not universal. Offering these can provide a competitive edge.
- Warning: Wifi is not universally provided but is considered essential globally. Ensure reliable Wifi is offered.
Recommendations for Hosts
- Ensure your listing includes all essential amenities for Ballarat: TV, Heating, Smoke alarm.
- Prioritize adding missing essentials: TV, Heating, Smoke alarm.
- Consider adding popular differentiators like Kitchen or Hot water to increase appeal.
- Highlight unique or less common amenities you offer (e.g., hot tub, dedicated workspace, EV charger) in your listing description and photos.
- Regularly check competitor amenities in Ballarat to stay competitive.
Ballarat Airbnb Guest Demographics & Profile Analysis (2026)
Guest Profile Summary for Ballarat
- The typical guest profile for Airbnb in Ballarat consists of primarily domestic travelers (93%), often arriving from nearby Melbourne, typically belonging to the Post-2000s (Gen Z/Alpha) group (50%), primarily speaking English or French.
- Domestic travelers account for 93.0% of guests.
- Key international markets include Australia (93%) and United States (1.1%).
- Top languages spoken are English (74.5%) followed by French (4%).
- A significant demographic segment is the Post-2000s (Gen Z/Alpha) group, representing 50% of guests.
Recommendations for Hosts
- Target domestic marketing efforts towards travelers from Melbourne and Victoria.
- Tailor amenities and listing descriptions to appeal to the dominant Post-2000s (Gen Z/Alpha) demographic (e.g., highlight fast WiFi, smart home features, local guides).
- Highlight unique local experiences or amenities relevant to the primary guest profile.
- Consider seasonal promotions aligned with peak travel times for key origin markets.
Nearby Short-Term Rental Market Comparison
How does the Ballarat Airbnb market stack up against its neighbors? Compare key performance metrics like average monthly revenue, ADR, and occupancy rates in surrounding areas to understand the broader regional STR landscape.
| Market | Active Properties | Monthly Revenue | Daily Rate | Avg. Occupancy |
|---|---|---|---|---|
| Macedon | 10 | $4,310 | $475.96 | 38% |
| Port Melbourne | 10 | $3,912 | $298.03 | 51% |
| Leopold | 12 | $2,959 | $432.77 | 36% |
| Lyonville | 10 | $2,925 | $349.98 | 36% |
| Lancefield | 19 | $2,920 | $219.11 | 39% |
| Daylesford | 444 | $2,889 | $293.59 | 36% |
| Shire of Hepburn | 272 | $2,794 | $309.30 | 36% |
| Gisborne | 15 | $2,688 | $202.50 | 51% |
| Trentham | 59 | $2,652 | $253.23 | 41% |
| Port Campbell | 133 | $2,584 | $244.45 | 37% |