Burnie Airbnb Market Analysis 2026: Short Term Rental Data & Vacation Rental Statistics in Tasmania, Australia
Is Airbnb profitable in Burnie in 2026? Explore comprehensive Airbnb analytics for Burnie, Tasmania, Australia to uncover income potential. This 2026 STR market report for Burnie, based on AirROI data from February 2025 to January 2026, reveals key trends in the niche market of 56 active listings.
Whether you're considering an Airbnb investment in Burnie, optimizing your existing vacation rental, or exploring rental arbitrage opportunities, understanding the Burnie Airbnb data is crucial. Navigating the high regulation landscape is key to maximizing your short term rental income potential. Let's dive into the specifics.
Key Burnie Airbnb Performance Metrics Overview
Monthly Airbnb Revenue Variations & Income Potential in Burnie (2026)
Understanding the monthly revenue variations for Airbnb listings in Burnie is key to maximizing your short term rental income potential. Seasonality significantly impacts earnings. Our analysis, based on data from the past 12 months, shows that the peak revenue month for STRs in Burnie is typically March, while January often presents the lowest earnings, highlighting opportunities for strategic pricing adjustments during shoulder and low seasons. Explore the typical Airbnb income in Burnie across different performance tiers:
- Best-in-class properties (Top 10%) achieve $3,789+ monthly, often utilizing dynamic pricing and superior guest experiences.
- Strong performing properties (Top 25%) earn $2,868 or more, indicating effective management and desirable locations/amenities.
- Typical properties (Median) generate around $1,848 per month, representing the average market performance.
- Entry-level properties (Bottom 25%) see earnings around $1,073, often with potential for optimization.
Average Monthly Airbnb Earnings Trend in Burnie
Burnie Airbnb Occupancy Rate Trends (2026)
Maximize your bookings by understanding the Burnie STR occupancy trends. Seasonal demand shifts significantly influence how often properties are booked. Typically, Marchsees the highest demand (peak season occupancy), while January experiences the lowest (low season). Effective strategies, like adjusting minimum stays or offering promotions, can boost occupancy during slower periods. Here's how different property tiers perform in Burnie:
- Best-in-class properties (Top 10%) achieve 83%+ occupancy, indicating high desirability and potentially optimized availability.
- Strong performing properties (Top 25%) maintain 69% or higher occupancy, suggesting good market fit and guest satisfaction.
- Typical properties (Median) have an occupancy rate around 52%.
- Entry-level properties (Bottom 25%) average 30% occupancy, potentially facing higher vacancy.
Average Monthly Occupancy Rate Trend in Burnie
Average Daily Rate (ADR) Airbnb Trends in Burnie (2026)
Effective short term rental pricing strategy in Burnie involves understanding monthly ADR fluctuations. The Average Daily Rate (ADR) for Airbnb in Burnie typically peaks in December and dips lowest during April. Leveraging Airbnb dynamic pricing tools or strategies based on this seasonality can significantly boost revenue. Here's a look at the typical nightly rates achieved:
- Best-in-class properties (Top 10%) command rates of $200+ per night, often due to premium features or locations.
- Strong performing properties (Top 25%) achieve nightly rates of $156 or more.
- Typical properties (Median) charge around $115 per night.
- Entry-level properties (Bottom 25%) earn around $95 per night.
Average Daily Rate (ADR) Trend by Month in Burnie
Get Live Burnie Market Intelligence 👇
Explore Real-time Analytics
Airbnb Seasonality Analysis & Trends in Burnie (2026)
Peak Season (March, February, April)
- Revenue averages $2,625 per month
- Occupancy rates average 66.9%
- Daily rates average $122
Shoulder Season
- Revenue averages $2,020 per month
- Occupancy maintains around 46.5%
- Daily rates hold near $131
Low Season (January, May, July)
- Revenue drops to average $1,786 per month
- Occupancy decreases to average 41.6%
- Daily rates adjust to average $128
Seasonality Insights for Burnie
- The Airbnb seasonality in Burnie shows moderate seasonality with distinct peak and low periods. While the sections above show seasonal averages, it's also insightful to look at the extremes:
- During the high season, the absolute peak month showcases Burnie's highest earning potential, with monthly revenues capable of climbing to $2,979, occupancy reaching a high of 73.1%, and ADRs peaking at $140.
- Conversely, the slowest single month of the year, typically falling within the low season, marks the market's lowest point. In this month, revenue might dip to $1,757, occupancy could drop to 40.0%, and ADRs may adjust down to $120.
- Understanding both the seasonal averages and these monthly peaks and troughs in revenue, occupancy, and ADR is crucial for maximizing your Airbnb profit potential in Burnie.
Seasonal Strategies for Maximizing Profit
- Peak Season: Maximize revenue through premium pricing and potentially longer minimum stays. Ensure high availability.
- Low Season: Offer competitive pricing, special promotions (e.g., extended stay discounts), and flexible cancellation policies. Target off-season travelers like remote workers or budget-conscious guests.
- Shoulder Seasons: Implement dynamic pricing that balances peak and low rates. Target weekend travelers or specific events. Offer slightly more flexible terms than peak season.
- Regularly analyze your own performance against these Burnie seasonality benchmarks and adjust your pricing and availability strategy accordingly.
Best Areas for Airbnb Investment in Burnie (2026)
Exploring the top neighborhoods for short-term rentals in Burnie? This section highlights key areas, outlining why they are attractive for hosts and guests, along with notable local attractions. Consider these locations based on your target guest profile and investment strategy.
| Neighborhood / Area | Why Host Here? (Target Guests & Appeal) | Key Attractions & Landmarks |
|---|---|---|
| West Park | A suburban area known for its proximity to local beaches and parks, ideal for families and outdoor enthusiasts. | Burnie Park, Walkers Beach, South Burnie Beach, Makers Workshop, Burnie Arts and Functions Centre |
| Burnie CBD | The heart of Burnie featuring shops, restaurants, and the iconic waterfront. Great for travelers looking to experience city life. | Burnie Foreshore, Burnie Arts and Functions Centre, Local markets, Bert Dashwood Lookout |
| East Burnie | A residential area with easy access to beaches and community facilities, appealing to those looking for a quiet stay with local charm. | East Burnie Beach, Riverside Park, Burnie Golf Club, Local cafes |
| Cooee | A coastal suburb with beachfront access and family-friendly amenities, making it suitable for vacationers seeking relaxation by the sea. | Cooee Beach, Cooee Rivulet, Local parks, Burnie BMX Track |
| Upper Burnie | An elevated area with scenic views over Burnie, attracting visitors looking for a peaceful retreat close to the city. | Makers Workshop, Burnie Park, Botanical Gardens of Burnie |
| Somerset | Just outside of Burnie, Somerset offers a relaxed coastal vibe and is ideal for those wanting to explore the Northwest Tasmania region. | Somerset Beach, Local shops and markets, Cruise Tasmania |
| South Burnie | Known for its beaches and local amenities, perfect for guests wanting to enjoy the coastal lifestyle with easy access to Burnie's attractions. | South Burnie Beach, Makers Workshop, Local cafes |
| Ridgley | A rural suburb close to Burnie, ideal for those looking for a unique stay in a more natural setting, with various outdoor activities. | Ridgley Nature Reserve, Local hiking trails, Scenic views of Burnie |
Understanding Airbnb License Requirements & STR Laws in Burnie (2026)
Yes, Burnie, Tasmania, Australia enforces high STR regulations. Obtaining a license and ensuring compliance is almost certainly required according to current 2026 STR laws. Always verify the latest short term rental regulations and Airbnb license requirements directly with local government authorities for Burnie to ensure full compliance before hosting.
(Source: AirROI data, 2026, based on 93% licensed listings)
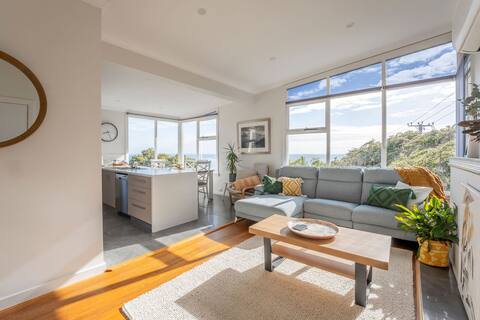
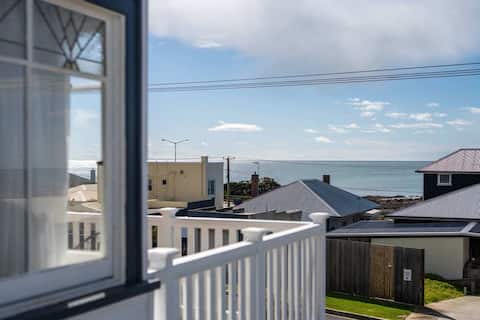
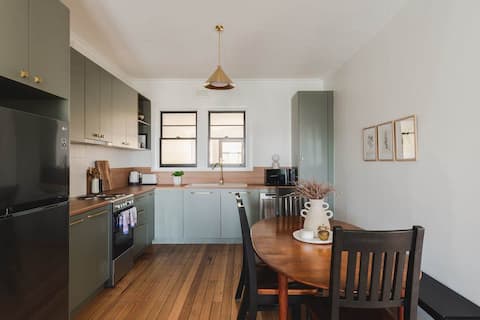
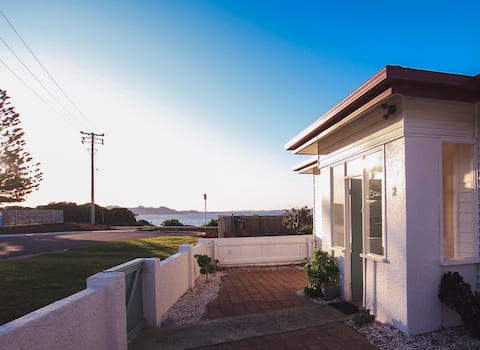
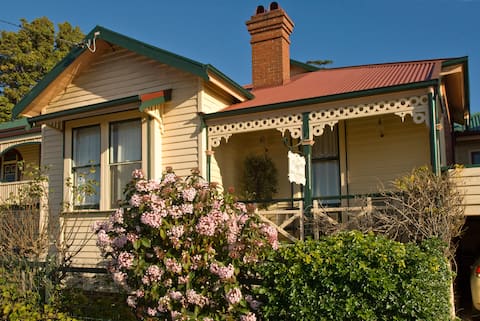
Top Performing Airbnb Properties in Burnie (2026)
Benchmark your potential! Explore examples of top-performing Airbnb properties in Burniebased on Trailing Twelve Month (TTM) revenue. Analyze their characteristics, revenue, occupancy rate, and ADR to understand what drives success in this market.
Sea You Soon: Views, Parking & WiFi
Entire Place • 3 bedrooms
Ocean Breeze - Getaway in Style
Entire Place • 3 bedrooms
Modern 3-Bed Coastal Escape
Entire Place • 3 bedrooms
Peaceful Oceanfront Gem - Close to Town.
Entire Place • 3 bedrooms

Friesland house by the beach
Entire Place • 3 bedrooms
The Duck House and garden - your North Coast haven
Entire Place • 2 bedrooms
Note: Performance varies based on location, size, amenities, seasonality, and management quality. Data reflects the past 12 months.
Top Performing Airbnb Hosts in Burnie (2026)
Learn from the best! This table showcases top-performing Airbnb hosts in Burnie based on the number of properties managed and estimated total revenue over the past year. Analyze their scale and performance metrics.
| Host Name | Properties | Grossing Revenue | Stay Reviews | Avg Rating |
|---|---|---|---|---|
| Moxxi | 7 | $212,467 | 91 | 4.83/5.0 |
| Di | 4 | $82,681 | 417 | 4.90/5.0 |
| Christine | 3 | $82,523 | 180 | 4.74/5.0 |
| Nicola | 1 | $36,474 | 59 | 5.00/5.0 |
| Shahana | 1 | $35,885 | 97 | 4.88/5.0 |
| Tirah | 2 | $34,270 | 65 | 4.96/5.0 |
| Tich | 1 | $33,133 | 69 | 4.94/5.0 |
| Scott & Renee | 1 | $33,097 | 295 | 4.81/5.0 |
| Natasha | 3 | $28,549 | 273 | 4.90/5.0 |
| Lynne | 2 | $27,873 | 111 | 4.91/5.0 |
Analyzing the strategies of top hosts, such as their property selection, pricing, and guest communication, can offer valuable lessons for optimizing your own Airbnb operations in Burnie.
Dive Deeper: Advanced Burnie STR Market Data (2026)
Ready to unlock more insights? AirROI provides access to advanced metrics and comprehensive Airbnb data for Burnie. Explore detailed analytics beyond this report to refine your investment strategy, optimize pricing, and maximize your vacation rental profits.
Explore Advanced MetricsBurnie Short-Term Rental Market Composition (2026): Property & Room Types
Room Type Distribution
Property Type Distribution
Market Composition Insights for Burnie
- The Burnie Airbnb market composition is heavily skewed towards Entire Home/Apt listings, which make up 94.6% of the 56 active rentals. This indicates strong guest preference for privacy and space.
- Looking at the property type distribution in Burnie, House properties are the most common (62.5%), reflecting the local real estate landscape.
- Houses represent a significant 62.5% portion, catering likely to families or larger groups.
- The presence of 12.5% Hotel/Boutique listings indicates integration with traditional hospitality.
Burnie Airbnb Room Capacity Analysis (2026): Bedroom Distribution
Distribution of Listings by Number of Bedrooms
Room Capacity Insights for Burnie
- The dominant room capacity in Burnie is 2 bedrooms listings, making up 41.1% of the market. This suggests a strong demand for properties suitable for couples or solo travelers.
- Together, 2 bedrooms and 3 bedrooms properties represent 69.7% of the active Airbnb listings in Burnie, indicating a high concentration in these sizes.
- A significant 35.7% of listings offer 3+ bedrooms, catering to larger groups and families seeking more space in Burnie.
Burnie Vacation Rental Guest Capacity Trends (2026)
Distribution of Listings by Guest Capacity
Guest Capacity Insights for Burnie
- The most common guest capacity trend in Burnie vacation rentals is listings accommodating 4 guests (39.3%). This suggests the primary traveler segment is likely small families or groups.
- Properties designed for 4 guests and 6 guests dominate the Burnie STR market, accounting for 58.9% of listings.
- 25.0% of properties accommodate 6+ guests, serving the market segment for larger families or group travel in Burnie.
- On average, properties in Burnie are equipped to host 4.1 guests.
Burnie Airbnb Booking Patterns (2026): Available vs. Booked Days
Available Days Distribution
Booked Days Distribution
Booking Pattern Insights for Burnie
- The most common availability pattern in Burnie falls within the 271-366 days range, representing 37.5% of listings. This suggests many properties have significant open periods on their calendars.
- Approximately 64.3% of listings show high availability (181+ days open annually), indicating potential for increased bookings or specific owner usage patterns.
- For booked days, the 181-270 days range is most frequent in Burnie (30.4%), reflecting common guest stay durations or potential owner blocking patterns.
- A notable 35.8% of properties secure long booking periods (181+ days booked per year), highlighting successful long-term rental strategies or significant owner usage.
Burnie Airbnb Minimum Stay Requirements Analysis
Distribution of Listings by Minimum Night Requirement
1 Night
14 listings
25% of total
2 Nights
31 listings
55.4% of total
3 Nights
4 listings
7.1% of total
30+ Nights
7 listings
12.5% of total
Key Insights
- The most prevalent minimum stay requirement in Burnie is 2 Nights, adopted by 55.4% of listings. This highlights the market's preference for shorter, flexible bookings.
- A strong majority (80.4%) of the Burnie Airbnb data shows acceptance of very short stays (1-2 nights), indicating a dynamic, high-turnover market.
- A significant segment (12.5%) caters to monthly stays (30+ nights) in Burnie, pointing to opportunities in the extended-stay market.
Recommendations
- Align with the market by considering a 2 Nights minimum stay, as 55.4% of Burnie hosts use this setting.
- If feasible, allowing 1-night stays, especially midweek or during low season, could capture last-minute bookings, as only 25% currently do.
- Explore offering discounts for stays of 30+ nights to attract the 12.5% of the market seeking extended stays.
- Adjust minimum nights based on seasonality – potentially shorter during low season and longer during peak demand periods in Burnie.
Burnie Airbnb Cancellation Policy Trends Analysis (2026)
Super Strict 30 Days
1 listings
1.8% of total
Flexible
22 listings
39.3% of total
Moderate
21 listings
37.5% of total
Firm
11 listings
19.6% of total
Strict
1 listings
1.8% of total
Cancellation Policy Insights for Burnie
- The prevailing Airbnb cancellation policy trend in Burnie is Flexible, used by 39.3% of listings.
- The market strongly favors guest-friendly terms, with 76.8% of listings offering Flexible or Moderate policies. This suggests guests in Burnie may expect booking flexibility.
- Strict cancellation policies are quite rare (1.8%), potentially making listings with this policy less competitive unless justified by high demand or property type.
Recommendations for Hosts
- Consider adopting a Flexible policy to align with the 39.3% market standard in Burnie.
- Using a Strict policy might deter some guests, as only 1.8% of listings use it. Evaluate if potential revenue protection outweighs possible lower booking rates.
- Regularly review your cancellation policy against competitors and market demand shifts in Burnie.
Burnie STR Booking Lead Time Analysis (2026)
Average Booking Lead Time by Month
Booking Lead Time Insights for Burnie
- The overall average booking lead time for vacation rentals in Burnie is 54 days.
- Guests book furthest in advance for stays during December (average 95 days), likely coinciding with peak travel demand or local events.
- The shortest booking windows occur for stays in June (average 34 days), indicating more last-minute travel plans during this time.
- Seasonally, Winter (68 days avg.) sees the longest lead times, while Summer (43 days avg.) has the shortest, reflecting typical travel planning cycles.
Recommendations for Hosts
- Use the overall average lead time (54 days) as a baseline for your pricing and availability strategy in Burnie.
- For December stays, consider implementing length-of-stay discounts or slightly higher rates for bookings made less than 95 days out to capitalize on advance planning.
- Target marketing efforts for the Winter season well in advance (at least 68 days) to capture early planners.
- Monitor your own booking lead times against these Burnie averages to identify opportunities for dynamic pricing adjustments.
Popular & Essential Airbnb Amenities in Burnie (2026)
Amenity Prevalence
Amenity Insights for Burnie
- Essential amenities in Burnie that guests expect include: TV, Smoke alarm, Heating. Lacking these (any) could significantly impact bookings.
- Popular amenities like Wifi, Free parking on premises, Hair dryer are common but not universal. Offering these can provide a competitive edge.
- Warning: Wifi is not universally provided but is considered essential globally. Ensure reliable Wifi is offered.
Recommendations for Hosts
- Ensure your listing includes all essential amenities for Burnie: TV, Smoke alarm, Heating.
- Prioritize adding missing essentials: Smoke alarm, Heating.
- Consider adding popular differentiators like Wifi or Free parking on premises to increase appeal.
- Highlight unique or less common amenities you offer (e.g., hot tub, dedicated workspace, EV charger) in your listing description and photos.
- Regularly check competitor amenities in Burnie to stay competitive.
Burnie Airbnb Guest Demographics & Profile Analysis (2026)
Guest Profile Summary for Burnie
- The typical guest profile for Airbnb in Burnie consists of primarily domestic travelers (90%), often arriving from nearby Hobart, typically belonging to the Post-2000s (Gen Z/Alpha) group (50%), primarily speaking English or French.
- Domestic travelers account for 90.0% of guests.
- Key international markets include Australia (90%) and United Kingdom (2%).
- Top languages spoken are English (74.5%) followed by French (6%).
- A significant demographic segment is the Post-2000s (Gen Z/Alpha) group, representing 50% of guests.
Recommendations for Hosts
- Target domestic marketing efforts towards travelers from Hobart and Melbourne.
- Tailor amenities and listing descriptions to appeal to the dominant Post-2000s (Gen Z/Alpha) demographic (e.g., highlight fast WiFi, smart home features, local guides).
- Highlight unique local experiences or amenities relevant to the primary guest profile.
- Consider seasonal promotions aligned with peak travel times for key origin markets.
Nearby Short-Term Rental Market Comparison
How does the Burnie Airbnb market stack up against its neighbors? Compare key performance metrics like average monthly revenue, ADR, and occupancy rates in surrounding areas to understand the broader regional STR landscape.
| Market | Active Properties | Monthly Revenue | Daily Rate | Avg. Occupancy |
|---|---|---|---|---|
| Kentish | 70 | $2,849 | $189.51 | 52% |
| Waratah-Wynyard | 39 | $2,706 | $194.22 | 47% |
| Turners Beach | 11 | $2,660 | $254.05 | 46% |
| West Tamar | 65 | $2,616 | $190.98 | 50% |
| Strahan | 63 | $2,606 | $167.60 | 55% |
| Meander Valley | 27 | $2,398 | $185.80 | 52% |
| Mole Creek | 17 | $2,341 | $183.19 | 46% |
| Miena | 12 | $2,301 | $149.97 | 55% |
| Ellendale | 10 | $2,150 | $167.33 | 43% |
| Arthur River | 10 | $2,109 | $162.51 | 47% |