Cairns Airbnb Market Analysis 2026: Short Term Rental Data & Vacation Rental Statistics in Queensland, Australia
Is Airbnb profitable in Cairns in 2026? Explore comprehensive Airbnb analytics for Cairns, Queensland, Australia to uncover income potential. This 2026 STR market report for Cairns, based on AirROI data from February 2025 to January 2026, reveals key trends in the market of 917 active listings.
Whether you're considering an Airbnb investment in Cairns, optimizing your existing vacation rental, or exploring rental arbitrage opportunities, understanding the Cairns Airbnb data is crucial. Leveraging the low regulation environment is key to maximizing your short term rental income potential. Let's dive into the specifics.
Key Cairns Airbnb Performance Metrics Overview
Monthly Airbnb Revenue Variations & Income Potential in Cairns (2026)
Understanding the monthly revenue variations for Airbnb listings in Cairns is key to maximizing your short term rental income potential. Seasonality significantly impacts earnings. Our analysis, based on data from the past 12 months, shows that the peak revenue month for STRs in Cairns is typically July, while February often presents the lowest earnings, highlighting opportunities for strategic pricing adjustments during shoulder and low seasons. Explore the typical Airbnb income in Cairns across different performance tiers:
- Best-in-class properties (Top 10%) achieve $6,079+ monthly, often utilizing dynamic pricing and superior guest experiences.
- Strong performing properties (Top 25%) earn $4,213 or more, indicating effective management and desirable locations/amenities.
- Typical properties (Median) generate around $2,576 per month, representing the average market performance.
- Entry-level properties (Bottom 25%) see earnings around $1,394, often with potential for optimization.
Average Monthly Airbnb Earnings Trend in Cairns
Cairns Airbnb Occupancy Rate Trends (2026)
Maximize your bookings by understanding the Cairns STR occupancy trends. Seasonal demand shifts significantly influence how often properties are booked. Typically, Julysees the highest demand (peak season occupancy), while January experiences the lowest (low season). Effective strategies, like adjusting minimum stays or offering promotions, can boost occupancy during slower periods. Here's how different property tiers perform in Cairns:
- Best-in-class properties (Top 10%) achieve 89%+ occupancy, indicating high desirability and potentially optimized availability.
- Strong performing properties (Top 25%) maintain 79% or higher occupancy, suggesting good market fit and guest satisfaction.
- Typical properties (Median) have an occupancy rate around 62%.
- Entry-level properties (Bottom 25%) average 38% occupancy, potentially facing higher vacancy.
Average Monthly Occupancy Rate Trend in Cairns
Average Daily Rate (ADR) Airbnb Trends in Cairns (2026)
Effective short term rental pricing strategy in Cairns involves understanding monthly ADR fluctuations. The Average Daily Rate (ADR) for Airbnb in Cairns typically peaks in July and dips lowest during February. Leveraging Airbnb dynamic pricing tools or strategies based on this seasonality can significantly boost revenue. Here's a look at the typical nightly rates achieved:
- Best-in-class properties (Top 10%) command rates of $312+ per night, often due to premium features or locations.
- Strong performing properties (Top 25%) achieve nightly rates of $219 or more.
- Typical properties (Median) charge around $144 per night.
- Entry-level properties (Bottom 25%) earn around $98 per night.
Average Daily Rate (ADR) Trend by Month in Cairns
Get Live Cairns Market Intelligence 👇

Explore Real-time Analytics
Airbnb Seasonality Analysis & Trends in Cairns (2026)
Peak Season (July, August, October)
- Revenue averages $4,182 per month
- Occupancy rates average 68.1%
- Daily rates average $188
Shoulder Season
- Revenue averages $3,139 per month
- Occupancy maintains around 57.2%
- Daily rates hold near $179
Low Season (January, February, March)
- Revenue drops to average $2,269 per month
- Occupancy decreases to average 47.4%
- Daily rates adjust to average $165
Seasonality Insights for Cairns
- The Airbnb seasonality in Cairns shows highly seasonal trends requiring careful strategy. While the sections above show seasonal averages, it's also insightful to look at the extremes:
- During the high season, the absolute peak month showcases Cairns's highest earning potential, with monthly revenues capable of climbing to $4,666, occupancy reaching a high of 72.8%, and ADRs peaking at $193.
- Conversely, the slowest single month of the year, typically falling within the low season, marks the market's lowest point. In this month, revenue might dip to $2,058, occupancy could drop to 41.8%, and ADRs may adjust down to $158.
- Understanding both the seasonal averages and these monthly peaks and troughs in revenue, occupancy, and ADR is crucial for maximizing your Airbnb profit potential in Cairns.
Seasonal Strategies for Maximizing Profit
- Peak Season: Maximize revenue through premium pricing and potentially longer minimum stays. Ensure high availability.
- Low Season: Offer competitive pricing, special promotions (e.g., extended stay discounts), and flexible cancellation policies. Target off-season travelers like remote workers or budget-conscious guests.
- Shoulder Seasons: Implement dynamic pricing that balances peak and low rates. Target weekend travelers or specific events. Offer slightly more flexible terms than peak season.
- Regularly analyze your own performance against these Cairns seasonality benchmarks and adjust your pricing and availability strategy accordingly.
Best Areas for Airbnb Investment in Cairns (2026)
Exploring the top neighborhoods for short-term rentals in Cairns? This section highlights key areas, outlining why they are attractive for hosts and guests, along with notable local attractions. Consider these locations based on your target guest profile and investment strategy.
| Neighborhood / Area | Why Host Here? (Target Guests & Appeal) | Key Attractions & Landmarks |
|---|---|---|
| Palm Cove | A beautiful beachside suburb known for its luxurious resorts and stunning coastline. Perfect for tourists looking for relaxation and high-end amenities. | Palm Cove Beach, Kuranda Skyrail, Cairns Tropical Zoo, Spa & Wellness Centers, Great Barrier Reef Tours |
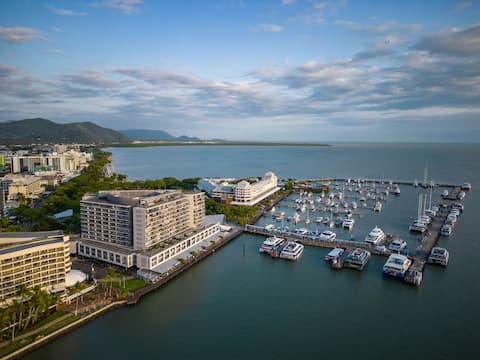
| Cairns City | The bustling heart of Cairns, ideal for urban explorers wanting to experience local culture, dining, and nightlife while being close to the Great Barrier Reef. | Cairns Esplanade, Cairns Night Markets, Cairns Convention Centre, Rusty's Markets, Cairns Botanical Gardens |
| Port Douglas | A charming coastal town known for its proximity to the Great Barrier Reef and Daintree Rainforest, appealing to nature lovers and adventure seekers. | Four Mile Beach, Mossman Gorge, Daintree Rainforest, Port Douglas Markets, Great Barrier Reef Cruises |
| Trinity Beach | A relaxed beach community popular among families and couples, offering a more tranquil beach experience while still being close to Cairns. | Trinity Beach, Earl Hill Conservation Park, local cafes and restaurants |
| Kuranda | A picturesque village in the rainforest, famous for its markets and scenic railway, attracting tourists looking for a unique experience in nature. | Kuranda Scenic Railway, Kuranda Markets, Rainforestation Nature Park, Skyrail Rainforest Cableway |
| Yorkeys Knob | A laid-back beach area known for its water sports and proximity to the reef, attractive to budget travelers and those seeking leisure activities. | Yorkeys Knob Beach, Marina Mirage, Water Sports Activities |
| Mission Beach | A tropical paradise perfect for beach lovers and adventure seekers, located near the Great Barrier Reef and Whitsunday Islands. | Mission Beach, Dunk Island, Tully River Rafting, Beaches and Nature Walks |
| Smithfield | A suburban area close to attractions like Skyrail and the Tjapukai Cultural Park, offering a balance of local life and tourist access. | Cairns Skyrail, Tjapukai Aboriginal Cultural Park, Shopping Centers |
Understanding Airbnb License Requirements & STR Laws in Cairns (2026)
While Cairns, Queensland, Australia currently shows low STR regulations, specific Airbnb license requirements might still exist or change. Always verify the latest short term rental regulations and Airbnb license requirements directly with local government authorities for Cairns to ensure full compliance before hosting.
(Source: AirROI data, 2026, based on 0% licensed listings)
Top Performing Airbnb Properties in Cairns (2026)
Benchmark your potential! Explore examples of top-performing Airbnb properties in Cairnsbased on Trailing Twelve Month (TTM) revenue. Analyze their characteristics, revenue, occupancy rate, and ADR to understand what drives success in this market.

Belle Escapes 24 Harbour Lights with Water View
Entire Place • 3 bedrooms
Belle Escapes 52 Harbour Lights with Ocean View
Entire Place • 2 bedrooms
702 CBD Apartment with elevated City & Water Views
Entire Place • 3 bedrooms
Rydges Plaza Esplanade Luxury 2-Bedroom Apartment
Entire Place • 2 bedrooms

604 Chic City Apartment with Water Views
Entire Place • 2 bedrooms
Belle Escapes 404 The Edge with Views
Entire Place • 3 bedrooms
Note: Performance varies based on location, size, amenities, seasonality, and management quality. Data reflects the past 12 months.
Top Performing Airbnb Hosts in Cairns (2026)
Learn from the best! This table showcases top-performing Airbnb hosts in Cairns based on the number of properties managed and estimated total revenue over the past year. Analyze their scale and performance metrics.
| Host Name | Properties | Grossing Revenue | Stay Reviews | Avg Rating |
|---|---|---|---|---|
| Thomas | 77 | $3,382,897 | 3692 | 4.79/5.0 |
| The Boutique Collection | 69 | $3,313,803 | 3380 | 4.77/5.0 |
| Antje | 12 | $2,102,929 | 504 | 4.85/5.0 |
| Tomoka & Brian | 21 | $898,056 | 1312 | 4.83/5.0 |
| Isabell | 18 | $842,297 | 889 | 4.94/5.0 |
| Scott & Kris | 8 | $478,763 | 1428 | 4.88/5.0 |
| Freemans | 18 | $473,297 | 381 | 4.67/5.0 |
| Scott & Kris | 9 | $472,325 | 1861 | 4.91/5.0 |
| Linda | 11 | $359,179 | 1534 | 4.87/5.0 |
| Yummy And John | 4 | $340,673 | 626 | 4.89/5.0 |
Analyzing the strategies of top hosts, such as their property selection, pricing, and guest communication, can offer valuable lessons for optimizing your own Airbnb operations in Cairns.
Dive Deeper: Advanced Cairns STR Market Data (2026)
Ready to unlock more insights? AirROI provides access to advanced metrics and comprehensive Airbnb data for Cairns. Explore detailed analytics beyond this report to refine your investment strategy, optimize pricing, and maximize your vacation rental profits.
Explore Advanced MetricsCairns Short-Term Rental Market Composition (2026): Property & Room Types
Room Type Distribution
Property Type Distribution
Market Composition Insights for Cairns
- The Cairns Airbnb market composition is heavily skewed towards Entire Home/Apt listings, which make up 83.2% of the 917 active rentals. This indicates strong guest preference for privacy and space.
- Looking at the property type distribution in Cairns, Apartment/Condo properties are the most common (60.3%), reflecting the local real estate landscape.
- Houses represent a significant 26.8% portion, catering likely to families or larger groups.
- The presence of 6.8% Hotel/Boutique listings indicates integration with traditional hospitality.
- Smaller segments like outdoor/unique, unique stays (combined 0.6%) offer potential for unique stay experiences.
Cairns Airbnb Room Capacity Analysis (2026): Bedroom Distribution
Distribution of Listings by Number of Bedrooms
Room Capacity Insights for Cairns
- The dominant room capacity in Cairns is 1 bedroom listings, making up 34.9% of the market. This suggests a strong demand for properties suitable for couples or solo travelers.
- Together, 1 bedroom and 2 bedrooms properties represent 63.5% of the active Airbnb listings in Cairns, indicating a high concentration in these sizes.
- A significant 23.1% of listings offer 3+ bedrooms, catering to larger groups and families seeking more space in Cairns.
Cairns Vacation Rental Guest Capacity Trends (2026)
Distribution of Listings by Guest Capacity
Guest Capacity Insights for Cairns
- The most common guest capacity trend in Cairns vacation rentals is listings accommodating 2 guests (26.3%). This suggests the primary traveler segment is likely couples or solo travelers.
- Properties designed for 2 guests and 4 guests dominate the Cairns STR market, accounting for 51.8% of listings.
- 24.7% of properties accommodate 6+ guests, serving the market segment for larger families or group travel in Cairns.
- On average, properties in Cairns are equipped to host 3.7 guests.
Cairns Airbnb Booking Patterns (2026): Available vs. Booked Days
Available Days Distribution
Booked Days Distribution
Booking Pattern Insights for Cairns
- The most common availability pattern in Cairns falls within the 91-180 days range, representing 35.3% of listings. This suggests many properties have significant open periods on their calendars.
- Approximately 50.3% of listings show high availability (181+ days open annually), indicating potential for increased bookings or specific owner usage patterns.
- For booked days, the 181-270 days range is most frequent in Cairns (36.2%), reflecting common guest stay durations or potential owner blocking patterns.
- A notable 51.5% of properties secure long booking periods (181+ days booked per year), highlighting successful long-term rental strategies or significant owner usage.
Cairns Airbnb Minimum Stay Requirements Analysis
Distribution of Listings by Minimum Night Requirement
1 Night
129 listings
14.1% of total
2 Nights
255 listings
27.8% of total
3 Nights
131 listings
14.3% of total
4-6 Nights
35 listings
3.8% of total
7-29 Nights
12 listings
1.3% of total
30+ Nights
355 listings
38.7% of total
Key Insights
- The most prevalent minimum stay requirement in Cairns is 30+ Nights, adopted by 38.7% of listings. This highlights the market's preference for longer commitments.
- A significant segment (38.7%) caters to monthly stays (30+ nights) in Cairns, pointing to opportunities in the extended-stay market.
Recommendations
- Align with the market by considering a 30+ Nights minimum stay, as 38.7% of Cairns hosts use this setting.
- If feasible, allowing 1-night stays, especially midweek or during low season, could capture last-minute bookings, as only 14.1% currently do.
- Explore offering discounts for stays of 30+ nights to attract the 38.7% of the market seeking extended stays.
- Adjust minimum nights based on seasonality – potentially shorter during low season and longer during peak demand periods in Cairns.
Cairns Airbnb Cancellation Policy Trends Analysis (2026)
Super Strict 60 Days
1 listings
0.1% of total
Super Strict 30 Days
10 listings
1.1% of total
Limited
26 listings
2.8% of total
Flexible
168 listings
18.3% of total
Moderate
263 listings
28.7% of total
Firm
387 listings
42.2% of total
Strict
62 listings
6.8% of total
Cancellation Policy Insights for Cairns
- The prevailing Airbnb cancellation policy trend in Cairns is Firm, used by 42.2% of listings.
- There's a relatively balanced mix between guest-friendly (47.0%) and stricter (49.0%) policies, offering choices for different guest needs.
- Strict cancellation policies are quite rare (6.8%), potentially making listings with this policy less competitive unless justified by high demand or property type.
Recommendations for Hosts
- Consider adopting a Firm policy to align with the 42.2% market standard in Cairns.
- Using a Strict policy might deter some guests, as only 6.8% of listings use it. Evaluate if potential revenue protection outweighs possible lower booking rates.
- Regularly review your cancellation policy against competitors and market demand shifts in Cairns.
Cairns STR Booking Lead Time Analysis (2026)
Average Booking Lead Time by Month
Booking Lead Time Insights for Cairns
- The overall average booking lead time for vacation rentals in Cairns is 50 days.
- Guests book furthest in advance for stays during July (average 66 days), likely coinciding with peak travel demand or local events.
- The shortest booking windows occur for stays in February (average 33 days), indicating more last-minute travel plans during this time.
- Seasonally, Summer (62 days avg.) sees the longest lead times, while Spring (44 days avg.) has the shortest, reflecting typical travel planning cycles.
Recommendations for Hosts
- Use the overall average lead time (50 days) as a baseline for your pricing and availability strategy in Cairns.
- For July stays, consider implementing length-of-stay discounts or slightly higher rates for bookings made less than 66 days out to capitalize on advance planning.
- Target marketing efforts for the Summer season well in advance (at least 62 days) to capture early planners.
- Monitor your own booking lead times against these Cairns averages to identify opportunities for dynamic pricing adjustments.
Popular & Essential Airbnb Amenities in Cairns (2026)
Amenity Prevalence
Amenity Insights for Cairns
- Essential amenities in Cairns that guests expect include: Air conditioning, Smoke alarm, Wifi, TV. Lacking these (any) could significantly impact bookings.
- Popular amenities like Washer, Kitchen, Hot water are common but not universal. Offering these can provide a competitive edge.
Recommendations for Hosts
- Ensure your listing includes all essential amenities for Cairns: Air conditioning, Smoke alarm, Wifi, TV.
- Prioritize adding missing essentials: Air conditioning, Smoke alarm, Wifi, TV.
- Consider adding popular differentiators like Washer or Kitchen to increase appeal.
- Highlight unique or less common amenities you offer (e.g., hot tub, dedicated workspace, EV charger) in your listing description and photos.
- Regularly check competitor amenities in Cairns to stay competitive.
Cairns Airbnb Guest Demographics & Profile Analysis (2026)
Guest Profile Summary for Cairns
- The typical guest profile for Airbnb in Cairns consists of a mix of domestic (54%) and international guests, often arriving from nearby Melbourne, typically belonging to the Post-2000s (Gen Z/Alpha) group (50%), primarily speaking English or German.
- Domestic travelers account for 54.4% of guests.
- Key international markets include Australia (54.4%) and United States (13.8%).
- Top languages spoken are English (60.2%) followed by German (6.9%).
- A significant demographic segment is the Post-2000s (Gen Z/Alpha) group, representing 50% of guests.
Recommendations for Hosts
- Balance marketing efforts between domestic and international channels based on the guest mix.
- Tailor amenities and listing descriptions to appeal to the dominant Post-2000s (Gen Z/Alpha) demographic (e.g., highlight fast WiFi, smart home features, local guides).
- Highlight unique local experiences or amenities relevant to the primary guest profile.
- Consider seasonal promotions aligned with peak travel times for key origin markets.
Nearby Short-Term Rental Market Comparison
How does the Cairns Airbnb market stack up against its neighbors? Compare key performance metrics like average monthly revenue, ADR, and occupancy rates in surrounding areas to understand the broader regional STR landscape.
| Market | Active Properties | Monthly Revenue | Daily Rate | Avg. Occupancy |
|---|---|---|---|---|
| Kewarra Beach | 47 | $4,698 | $360.15 | 51% |
| Palm Cove | 99 | $3,938 | $361.83 | 48% |
| Cairns Regional | 693 | $3,554 | $312.48 | 43% |
| Trinity Beach | 14 | $3,387 | $316.88 | 50% |
| Port Douglas | 647 | $2,992 | $339.48 | 40% |
| Douglas Shire | 149 | $2,812 | $291.13 | 41% |
| Mossman | 11 | $2,656 | $212.54 | 48% |
| Cairns North | 27 | $2,548 | $217.45 | 52% |
| Tablelands Regional | 41 | $2,533 | $248.64 | 46% |
| Cairns City | 22 | $2,437 | $221.74 | 48% |