Tigre Airbnb Market Analysis 2026: Short Term Rental Data & Vacation Rental Statistics in Buenos Aires, Argentina
Is Airbnb profitable in Tigre in 2026? Explore comprehensive Airbnb analytics for Tigre, Buenos Aires, Argentina to uncover income potential. This 2026 STR market report for Tigre, based on AirROI data from February 2025 to January 2026, reveals key trends in the market of 260 active listings.
Whether you're considering an Airbnb investment in Tigre, optimizing your existing vacation rental, or exploring rental arbitrage opportunities, understanding the Tigre Airbnb data is crucial. Leveraging the low regulation environment is key to maximizing your short term rental income potential. Let's dive into the specifics.
Key Tigre Airbnb Performance Metrics Overview
Monthly Airbnb Revenue Variations & Income Potential in Tigre (2026)
Understanding the monthly revenue variations for Airbnb listings in Tigre is key to maximizing your short term rental income potential. Seasonality significantly impacts earnings. Our analysis, based on data from the past 12 months, shows that the peak revenue month for STRs in Tigre is typically December, while June often presents the lowest earnings, highlighting opportunities for strategic pricing adjustments during shoulder and low seasons. Explore the typical Airbnb income in Tigre across different performance tiers:
- Best-in-class properties (Top 10%) achieve $1,802+ monthly, often utilizing dynamic pricing and superior guest experiences.
- Strong performing properties (Top 25%) earn $1,219 or more, indicating effective management and desirable locations/amenities.
- Typical properties (Median) generate around $719 per month, representing the average market performance.
- Entry-level properties (Bottom 25%) see earnings around $349, often with potential for optimization.
Average Monthly Airbnb Earnings Trend in Tigre
Tigre Airbnb Occupancy Rate Trends (2026)
Maximize your bookings by understanding the Tigre STR occupancy trends. Seasonal demand shifts significantly influence how often properties are booked. Typically, Februarysees the highest demand (peak season occupancy), while June experiences the lowest (low season). Effective strategies, like adjusting minimum stays or offering promotions, can boost occupancy during slower periods. Here's how different property tiers perform in Tigre:
- Best-in-class properties (Top 10%) achieve 75%+ occupancy, indicating high desirability and potentially optimized availability.
- Strong performing properties (Top 25%) maintain 55% or higher occupancy, suggesting good market fit and guest satisfaction.
- Typical properties (Median) have an occupancy rate around 32%.
- Entry-level properties (Bottom 25%) average 15% occupancy, potentially facing higher vacancy.
Average Monthly Occupancy Rate Trend in Tigre
Average Daily Rate (ADR) Airbnb Trends in Tigre (2026)
Effective short term rental pricing strategy in Tigre involves understanding monthly ADR fluctuations. The Average Daily Rate (ADR) for Airbnb in Tigre typically peaks in January and dips lowest during March. Leveraging Airbnb dynamic pricing tools or strategies based on this seasonality can significantly boost revenue. Here's a look at the typical nightly rates achieved:
- Best-in-class properties (Top 10%) command rates of $151+ per night, often due to premium features or locations.
- Strong performing properties (Top 25%) achieve nightly rates of $97 or more.
- Typical properties (Median) charge around $68 per night.
- Entry-level properties (Bottom 25%) earn around $49 per night.
Average Daily Rate (ADR) Trend by Month in Tigre
Get Live Tigre Market Intelligence 👇

Explore Real-time Analytics
Airbnb Seasonality Analysis & Trends in Tigre (2026)
Peak Season (December, February, March)
- Revenue averages $1,100 per month
- Occupancy rates average 43.9%
- Daily rates average $86
Shoulder Season
- Revenue averages $914 per month
- Occupancy maintains around 36.7%
- Daily rates hold near $87
Low Season (May, June, August)
- Revenue drops to average $716 per month
- Occupancy decreases to average 30.8%
- Daily rates adjust to average $85
Seasonality Insights for Tigre
- The Airbnb seasonality in Tigre shows moderate seasonality with distinct peak and low periods. While the sections above show seasonal averages, it's also insightful to look at the extremes:
- During the high season, the absolute peak month showcases Tigre's highest earning potential, with monthly revenues capable of climbing to $1,159, occupancy reaching a high of 46.8%, and ADRs peaking at $91.
- Conversely, the slowest single month of the year, typically falling within the low season, marks the market's lowest point. In this month, revenue might dip to $638, occupancy could drop to 26.4%, and ADRs may adjust down to $83.
- Understanding both the seasonal averages and these monthly peaks and troughs in revenue, occupancy, and ADR is crucial for maximizing your Airbnb profit potential in Tigre.
Seasonal Strategies for Maximizing Profit
- Peak Season: Maximize revenue through premium pricing and potentially longer minimum stays. Ensure high availability.
- Low Season: Offer competitive pricing, special promotions (e.g., extended stay discounts), and flexible cancellation policies. Target off-season travelers like remote workers or budget-conscious guests.
- Shoulder Seasons: Implement dynamic pricing that balances peak and low rates. Target weekend travelers or specific events. Offer slightly more flexible terms than peak season.
- Regularly analyze your own performance against these Tigre seasonality benchmarks and adjust your pricing and availability strategy accordingly.
Best Areas for Airbnb Investment in Tigre (2026)
Exploring the top neighborhoods for short-term rentals in Tigre? This section highlights key areas, outlining why they are attractive for hosts and guests, along with notable local attractions. Consider these locations based on your target guest profile and investment strategy.
| Neighborhood / Area | Why Host Here? (Target Guests & Appeal) | Key Attractions & Landmarks |
|---|---|---|
| Tigre Delta | A stunning natural reserve that attracts tourists looking for relaxation and outdoor activities. Perfect for offering serene getaways with access to beautiful waterways and nature. | Tigre Delta, Puerto de Frutos, Tigre Art Museum, Parque de la Costa, Catamarans Tours, San Isidro Historic District |
| Puerto de Frutos | A vibrant market area that draws both locals and tourists. Ideal for hosting guests who want to experience local crafts and culinary delights. | Puerto de Frutos Market, Local Fruit Stalls, Craft Shops, Riverside Restaurants, Artisan Food Vendors |
| San Fernando | A nearby city known for its charming residential areas and local culture. Great for families and travelers looking for a quieter stay close to Tigre. | Plaza de San Fernando, Museo de la Ciudad, Riverside Walks, Local Cafes, Shopping Centers |
| Nautical Club Tigre | A popular area for water sports, attracting sailing enthusiasts and those who enjoy recreational boating. Perfect for adventurous travelers. | Nautical Club, Boat Rentals, Water Sports Activities, Tigre River, Fisherman’s Wharf |
| Isla del Becerro | A beautiful island community that offers a unique lodging experience. Ideal for eco-tourism and nature lovers. | Natural Parks, Kayaking, Wildlife Watching, Scenic Views, Remote Getaways |
| Escobar | A nearby city with a more suburban feel. Attracts visitors looking to combine city life with the charm of the countryside. | Bioparque Temaikèn, Local Markets, Park of the Old Station, Cultural Events, Nature Trails |
| Belén de Escobar | Known for its cultural events and green spaces. It's a good location for hosting families and travelers interested in local traditions. | Cultural Center, Local Festivals, Family Parks, Art Exhibits |
| Villa La Noria | A small, quiet area that's great for those wanting a peaceful retreat while still being close to the attractions of Tigre. | Quiet Residential Area, Nature Trails, Cultural Heritage Sites, Riverside Parks |
Understanding Airbnb License Requirements & STR Laws in Tigre (2026)
While Tigre, Buenos Aires, Argentina currently shows low STR regulations, specific Airbnb license requirements might still exist or change. Always verify the latest short term rental regulations and Airbnb license requirements directly with local government authorities for Tigre to ensure full compliance before hosting.
(Source: AirROI data, 2026, based on 0% licensed listings)
Top Performing Airbnb Properties in Tigre (2026)
Benchmark your potential! Explore examples of top-performing Airbnb properties in Tigrebased on Trailing Twelve Month (TTM) revenue. Analyze their characteristics, revenue, occupancy rate, and ADR to understand what drives success in this market.

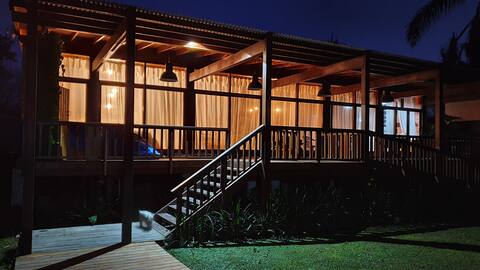
Experience. Two cabins
Entire Place • 5 bedrooms

Cabin in the Delta 8
Entire Place • 3 bedrooms
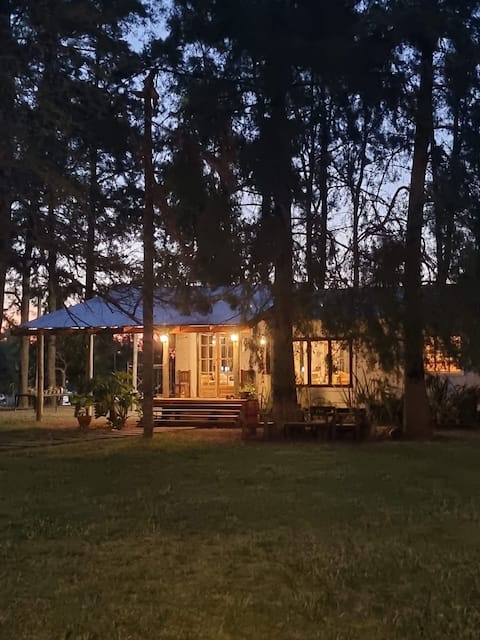
House in 11 Ha of nature and 80 m in front of the river
Entire Place • 4 bedrooms
La Bayta - Delta Experience
Entire Place • 3 bedrooms
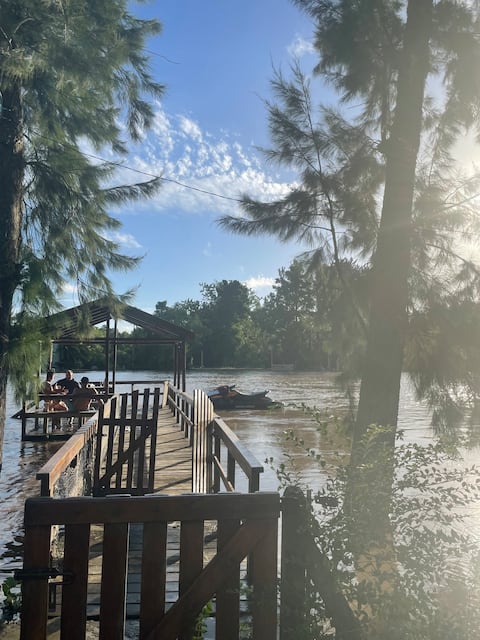
House in the Delta Over the River San Antonio Tigre
Entire Place • 1 bedroom

Petit Atelier Puerto Eclipse (Eclipse Port Studio)
Entire Place • 1 bedroom
Note: Performance varies based on location, size, amenities, seasonality, and management quality. Data reflects the past 12 months.
Top Performing Airbnb Hosts in Tigre (2026)
Learn from the best! This table showcases top-performing Airbnb hosts in Tigre based on the number of properties managed and estimated total revenue over the past year. Analyze their scale and performance metrics.
| Host Name | Properties | Grossing Revenue | Stay Reviews | Avg Rating |
|---|---|---|---|---|
| Luciana | 3 | $100,246 | 73 | 4.97/5.0 |
| Sebastian | 5 | $90,071 | 591 | 4.85/5.0 |
| Anneliese | 2 | $45,389 | 110 | 4.93/5.0 |
| Claudio | 3 | $41,823 | 558 | 4.97/5.0 |
| Sofía | 2 | $36,799 | 51 | 4.74/5.0 |
| Emily | 1 | $33,876 | 30 | 4.97/5.0 |
| Puerto Arekuna. | 1 | $33,196 | 17 | 5.00/5.0 |
| Flor Y Nano | 2 | $28,812 | 188 | 4.97/5.0 |
| Sebastian | 1 | $27,818 | 82 | 4.95/5.0 |
| Paulina | 2 | $24,229 | 114 | 4.80/5.0 |
Analyzing the strategies of top hosts, such as their property selection, pricing, and guest communication, can offer valuable lessons for optimizing your own Airbnb operations in Tigre.
Dive Deeper: Advanced Tigre STR Market Data (2026)
Ready to unlock more insights? AirROI provides access to advanced metrics and comprehensive Airbnb data for Tigre. Explore detailed analytics beyond this report to refine your investment strategy, optimize pricing, and maximize your vacation rental profits.
Explore Advanced MetricsTigre Short-Term Rental Market Composition (2026): Property & Room Types
Room Type Distribution
Property Type Distribution
Market Composition Insights for Tigre
- The Tigre Airbnb market composition is heavily skewed towards Entire Home/Apt listings, which make up 96.9% of the 260 active rentals. This indicates strong guest preference for privacy and space.
- Looking at the property type distribution in Tigre, Apartment/Condo properties are the most common (38.1%), reflecting the local real estate landscape.
- Houses represent a significant 25% portion, catering likely to families or larger groups.
- Smaller segments like hotel/boutique, unique stays (combined 5.0%) offer potential for unique stay experiences.
Tigre Airbnb Room Capacity Analysis (2026): Bedroom Distribution
Distribution of Listings by Number of Bedrooms
Room Capacity Insights for Tigre
- The dominant room capacity in Tigre is 1 bedroom listings, making up 56.9% of the market. This suggests a strong demand for properties suitable for couples or solo travelers.
- Together, 1 bedroom and 2 bedrooms properties represent 85.7% of the active Airbnb listings in Tigre, indicating a high concentration in these sizes.
- With over half the market (56.9%) consisting of studios or 1-bedroom units, Tigre is particularly well-suited for individuals or couples.
- Listings with 3+ bedrooms (8.1%) represent a smaller niche, potentially indicating an underserved market for larger group accommodations in Tigre.
Tigre Vacation Rental Guest Capacity Trends (2026)
Distribution of Listings by Guest Capacity
Guest Capacity Insights for Tigre
- The most common guest capacity trend in Tigre vacation rentals is listings accommodating 2 guests (34.6%). This suggests the primary traveler segment is likely couples or solo travelers.
- Properties designed for 2 guests and 4 guests dominate the Tigre STR market, accounting for 60.4% of listings.
- 16.5% of properties accommodate 6+ guests, serving the market segment for larger families or group travel in Tigre.
- On average, properties in Tigre are equipped to host 3.6 guests.
Tigre Airbnb Booking Patterns (2026): Available vs. Booked Days
Available Days Distribution
Booked Days Distribution
Booking Pattern Insights for Tigre
- The most common availability pattern in Tigre falls within the 271-366 days range, representing 62.7% of listings. This suggests many properties have significant open periods on their calendars.
- Approximately 85.0% of listings show high availability (181+ days open annually), indicating potential for increased bookings or specific owner usage patterns.
- For booked days, the 1-30 days range is most frequent in Tigre (32.7%), reflecting common guest stay durations or potential owner blocking patterns.
- A notable 15.4% of properties secure long booking periods (181+ days booked per year), highlighting successful long-term rental strategies or significant owner usage.
Tigre Airbnb Minimum Stay Requirements Analysis
Distribution of Listings by Minimum Night Requirement
1 Night
81 listings
31.2% of total
2 Nights
85 listings
32.7% of total
3 Nights
21 listings
8.1% of total
4-6 Nights
5 listings
1.9% of total
7-29 Nights
13 listings
5% of total
30+ Nights
55 listings
21.2% of total
Key Insights
- The most prevalent minimum stay requirement in Tigre is 2 Nights, adopted by 32.7% of listings. This highlights the market's preference for shorter, flexible bookings.
- A strong majority (63.9%) of the Tigre Airbnb data shows acceptance of very short stays (1-2 nights), indicating a dynamic, high-turnover market.
- A significant segment (21.2%) caters to monthly stays (30+ nights) in Tigre, pointing to opportunities in the extended-stay market.
Recommendations
- Align with the market by considering a 2 Nights minimum stay, as 32.7% of Tigre hosts use this setting.
- Explore offering discounts for stays of 30+ nights to attract the 21.2% of the market seeking extended stays.
- Adjust minimum nights based on seasonality – potentially shorter during low season and longer during peak demand periods in Tigre.
Tigre Airbnb Cancellation Policy Trends Analysis (2026)
Limited
13 listings
5% of total
Flexible
103 listings
39.6% of total
Moderate
67 listings
25.8% of total
Firm
62 listings
23.8% of total
Strict
15 listings
5.8% of total
Cancellation Policy Insights for Tigre
- The prevailing Airbnb cancellation policy trend in Tigre is Flexible, used by 39.6% of listings.
- There's a relatively balanced mix between guest-friendly (65.4%) and stricter (29.6%) policies, offering choices for different guest needs.
- Strict cancellation policies are quite rare (5.8%), potentially making listings with this policy less competitive unless justified by high demand or property type.
Recommendations for Hosts
- Consider adopting a Flexible policy to align with the 39.6% market standard in Tigre.
- Using a Strict policy might deter some guests, as only 5.8% of listings use it. Evaluate if potential revenue protection outweighs possible lower booking rates.
- Regularly review your cancellation policy against competitors and market demand shifts in Tigre.
Tigre STR Booking Lead Time Analysis (2026)
Average Booking Lead Time by Month
Booking Lead Time Insights for Tigre
- The overall average booking lead time for vacation rentals in Tigre is 23 days.
- Guests book furthest in advance for stays during January (average 29 days), likely coinciding with peak travel demand or local events.
- The shortest booking windows occur for stays in June (average 12 days), indicating more last-minute travel plans during this time.
- Seasonally, Winter (26 days avg.) sees the longest lead times, while Summer (18 days avg.) has the shortest, reflecting typical travel planning cycles.
Recommendations for Hosts
- Use the overall average lead time (23 days) as a baseline for your pricing and availability strategy in Tigre.
- During June, focus on last-minute booking availability and promotions, as guests book with very short notice (12 days avg.).
- Target marketing efforts for the Winter season well in advance (at least 26 days) to capture early planners.
- Monitor your own booking lead times against these Tigre averages to identify opportunities for dynamic pricing adjustments.
Popular & Essential Airbnb Amenities in Tigre (2026)
Amenity Prevalence
Amenity Insights for Tigre
- Popular amenities like Kitchen, Wifi, Hot water are common but not universal. Offering these can provide a competitive edge.
- Warning: Wifi is not universally provided but is considered essential globally. Ensure reliable Wifi is offered.
Recommendations for Hosts
- Consider adding popular differentiators like Kitchen or Wifi to increase appeal.
- Highlight unique or less common amenities you offer (e.g., hot tub, dedicated workspace, EV charger) in your listing description and photos.
- Regularly check competitor amenities in Tigre to stay competitive.
Tigre Airbnb Guest Demographics & Profile Analysis (2026)
Guest Profile Summary for Tigre
- The typical guest profile for Airbnb in Tigre consists of a mix of domestic (57%) and international guests, often arriving from nearby Buenos Aires, typically belonging to the Post-2000s (Gen Z/Alpha) group (50%), primarily speaking Spanish or English.
- Domestic travelers account for 56.6% of guests.
- Key international markets include Argentina (56.6%) and United States (7.8%).
- Top languages spoken are Spanish (38.3%) followed by English (37.6%).
- A significant demographic segment is the Post-2000s (Gen Z/Alpha) group, representing 50% of guests.
Recommendations for Hosts
- Balance marketing efforts between domestic and international channels based on the guest mix.
- Tailor amenities and listing descriptions to appeal to the dominant Post-2000s (Gen Z/Alpha) demographic (e.g., highlight fast WiFi, smart home features, local guides).
- Highlight unique local experiences or amenities relevant to the primary guest profile.
- Consider seasonal promotions aligned with peak travel times for key origin markets.
Nearby Short-Term Rental Market Comparison
How does the Tigre Airbnb market stack up against its neighbors? Compare key performance metrics like average monthly revenue, ADR, and occupancy rates in surrounding areas to understand the broader regional STR landscape.
| Market | Active Properties | Monthly Revenue | Daily Rate | Avg. Occupancy |
|---|---|---|---|---|
| Colonia Esterella | 13 | $1,620 | $328.28 | 23% |
| Open Door | 12 | $1,533 | $211.34 | 27% |
| El Cazador | 25 | $1,285 | $174.20 | 33% |
| Luján | 49 | $1,278 | $152.81 | 36% |
| Don Torcuato | 14 | $1,272 | $205.31 | 35% |
| Lobos | 49 | $1,268 | $253.18 | 28% |
| General Pacheco | 13 | $1,250 | $196.50 | 35% |
| Carmelo | 40 | $1,230 | $172.77 | 27% |
| Manzanares | 18 | $1,227 | $216.77 | 30% |
| Exaltación de la Cruz | 32 | $1,124 | $181.17 | 32% |