Tandil Airbnb Market Analysis 2026: Short Term Rental Data & Vacation Rental Statistics in Buenos Aires, Argentina
Is Airbnb profitable in Tandil in 2026? Explore comprehensive Airbnb analytics for Tandil, Buenos Aires, Argentina to uncover income potential. This 2026 STR market report for Tandil, based on AirROI data from February 2025 to January 2026, reveals key trends in the market of 284 active listings.
Whether you're considering an Airbnb investment in Tandil, optimizing your existing vacation rental, or exploring rental arbitrage opportunities, understanding the Tandil Airbnb data is crucial. Leveraging the low regulation environment is key to maximizing your short term rental income potential. Let's dive into the specifics.
Key Tandil Airbnb Performance Metrics Overview
Monthly Airbnb Revenue Variations & Income Potential in Tandil (2026)
Understanding the monthly revenue variations for Airbnb listings in Tandil is key to maximizing your short term rental income potential. Seasonality significantly impacts earnings. Our analysis, based on data from the past 12 months, shows that the peak revenue month for STRs in Tandil is typically February, while June often presents the lowest earnings, highlighting opportunities for strategic pricing adjustments during shoulder and low seasons. Explore the typical Airbnb income in Tandil across different performance tiers:
- Best-in-class properties (Top 10%) achieve $2,229+ monthly, often utilizing dynamic pricing and superior guest experiences.
- Strong performing properties (Top 25%) earn $1,163 or more, indicating effective management and desirable locations/amenities.
- Typical properties (Median) generate around $607 per month, representing the average market performance.
- Entry-level properties (Bottom 25%) see earnings around $295, often with potential for optimization.
Average Monthly Airbnb Earnings Trend in Tandil
Tandil Airbnb Occupancy Rate Trends (2026)
Maximize your bookings by understanding the Tandil STR occupancy trends. Seasonal demand shifts significantly influence how often properties are booked. Typically, Februarysees the highest demand (peak season occupancy), while June experiences the lowest (low season). Effective strategies, like adjusting minimum stays or offering promotions, can boost occupancy during slower periods. Here's how different property tiers perform in Tandil:
- Best-in-class properties (Top 10%) achieve 67%+ occupancy, indicating high desirability and potentially optimized availability.
- Strong performing properties (Top 25%) maintain 46% or higher occupancy, suggesting good market fit and guest satisfaction.
- Typical properties (Median) have an occupancy rate around 26%.
- Entry-level properties (Bottom 25%) average 14% occupancy, potentially facing higher vacancy.
Average Monthly Occupancy Rate Trend in Tandil
Average Daily Rate (ADR) Airbnb Trends in Tandil (2026)
Effective short term rental pricing strategy in Tandil involves understanding monthly ADR fluctuations. The Average Daily Rate (ADR) for Airbnb in Tandil typically peaks in September and dips lowest during March. Leveraging Airbnb dynamic pricing tools or strategies based on this seasonality can significantly boost revenue. Here's a look at the typical nightly rates achieved:
- Best-in-class properties (Top 10%) command rates of $175+ per night, often due to premium features or locations.
- Strong performing properties (Top 25%) achieve nightly rates of $104 or more.
- Typical properties (Median) charge around $66 per night.
- Entry-level properties (Bottom 25%) earn around $48 per night.
Average Daily Rate (ADR) Trend by Month in Tandil
Get Live Tandil Market Intelligence 👇

Explore Real-time Analytics
Airbnb Seasonality Analysis & Trends in Tandil (2026)
Peak Season (February, March, July)
- Revenue averages $1,181 per month
- Occupancy rates average 38.8%
- Daily rates average $90
Shoulder Season
- Revenue averages $973 per month
- Occupancy maintains around 31.5%
- Daily rates hold near $92
Low Season (May, June, September)
- Revenue drops to average $787 per month
- Occupancy decreases to average 26.2%
- Daily rates adjust to average $92
Seasonality Insights for Tandil
- The Airbnb seasonality in Tandil shows moderate seasonality with distinct peak and low periods. While the sections above show seasonal averages, it's also insightful to look at the extremes:
- During the high season, the absolute peak month showcases Tandil's highest earning potential, with monthly revenues capable of climbing to $1,214, occupancy reaching a high of 40.4%, and ADRs peaking at $95.
- Conversely, the slowest single month of the year, typically falling within the low season, marks the market's lowest point. In this month, revenue might dip to $748, occupancy could drop to 25.2%, and ADRs may adjust down to $89.
- Understanding both the seasonal averages and these monthly peaks and troughs in revenue, occupancy, and ADR is crucial for maximizing your Airbnb profit potential in Tandil.
Seasonal Strategies for Maximizing Profit
- Peak Season: Maximize revenue through premium pricing and potentially longer minimum stays. Ensure high availability.
- Low Season: Offer competitive pricing, special promotions (e.g., extended stay discounts), and flexible cancellation policies. Target off-season travelers like remote workers or budget-conscious guests.
- Shoulder Seasons: Implement dynamic pricing that balances peak and low rates. Target weekend travelers or specific events. Offer slightly more flexible terms than peak season.
- Regularly analyze your own performance against these Tandil seasonality benchmarks and adjust your pricing and availability strategy accordingly.
Best Areas for Airbnb Investment in Tandil (2026)
Exploring the top neighborhoods for short-term rentals in Tandil? This section highlights key areas, outlining why they are attractive for hosts and guests, along with notable local attractions. Consider these locations based on your target guest profile and investment strategy.
| Neighborhood / Area | Why Host Here? (Target Guests & Appeal) | Key Attractions & Landmarks |
|---|---|---|
| Cerro El Tunduqueral | A popular natural attraction providing stunning views of Tandil and the surrounding area. Ideal for tourists who enjoy hiking and scenic landscapes. | Cerro El Tunduqueral, El Centinela, Parque Independencia, Dique del Fuerte, Laguna de las Ánimas |
| La Movediza | Known for the famous moved stone, this area is rich in history and offers unique geological features, attracting visitors interested in nature and culture. | La Movediza, Parque de la Independencia, Museo y Parque Rodante, Piedra Movediza, Cerro de las Ánimas |
| Centro Tandil | The heart of Tandil filled with shops, restaurants, and cultural sites. Great for travelers looking to experience the local city life and amenities. | Plaza Independencia, Iglesia del Santo Espíritu, Museo Histórico Fuerte Independencia, Calle San Martín, Café de la Plaza |
| Parque del Bicentenario | A large green space perfect for outdoor activities, picnics, and relaxation. Attractive for families and those who love outdoor adventures. | Parque del Bicentenario, Lago del Parque, El Reloj de Sol, Juegos para Niños, Senderos para Caminar |
| Piedra Movediza | Famous for its remarkable balancing stone, this area is a key attraction in Tandil, drawing visitors wanting to see this natural wonder. | Piedra Movediza, Cerro El Centinela, Mirador del Fuerte, Sendero de la Movediza, Cascadas de Tandil |
| Río Tandil | A scenic area along the river, perfect for fishing, walking, and enjoying nature. Appeals to outdoor enthusiasts and families. | Río Tandil, Parque del Fuerte, Caminos del Río, Sendero de los Tres Puentes, Naturaleza y Deporte |
| Los Cuentos | A picturesque area known for its charming views and rural atmosphere, ideal for travelers looking for a peaceful getaway close to nature. | Los Cuentos, Ruta del Tandil, Caminos de la Sierra, Estancias de Tandil, Vistas Panorámicas |
| Cerro de La Virgen | A religious and historical site offering stunning panoramic views of Tandil, perfect for spiritual travelers and those seeking tranquility. | Cerro de La Virgen, Parroquia Santa Ana, Mirador de la Virgen, Sendero Espiritual, Los Miradores |
Understanding Airbnb License Requirements & STR Laws in Tandil (2026)
While Tandil, Buenos Aires, Argentina currently shows low STR regulations, specific Airbnb license requirements might still exist or change. Always verify the latest short term rental regulations and Airbnb license requirements directly with local government authorities for Tandil to ensure full compliance before hosting.
(Source: AirROI data, 2026, finding no licensed listings among those analyzed)
Top Performing Airbnb Properties in Tandil (2026)
Benchmark your potential! Explore examples of top-performing Airbnb properties in Tandilbased on Trailing Twelve Month (TTM) revenue. Analyze their characteristics, revenue, occupancy rate, and ADR to understand what drives success in this market.
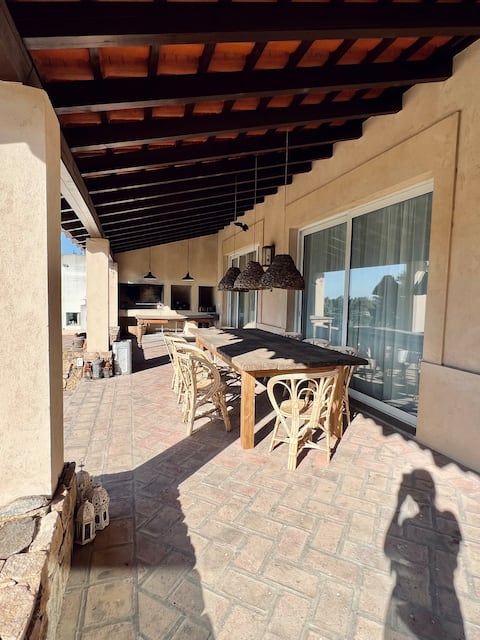
Casa Las Hortensias at the foot of the mountains
Entire Place • 4 bedrooms

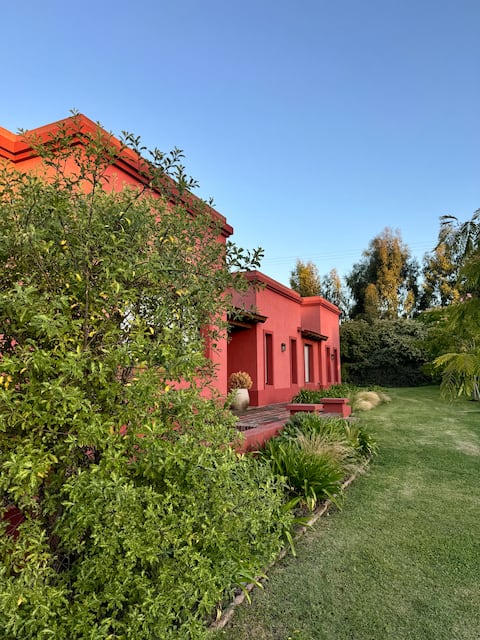
Colonial-style house
Entire Place • 5 bedrooms
Excellent house for rent P7
Entire Place • 3 bedrooms
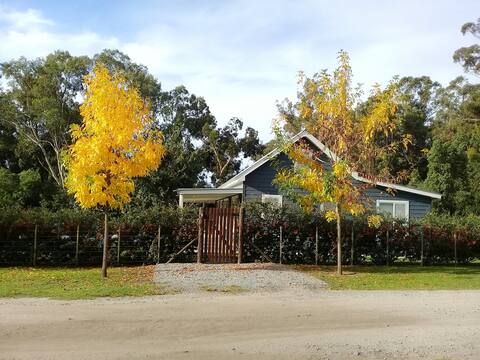
New zealand house
Entire Place • 4 bedrooms
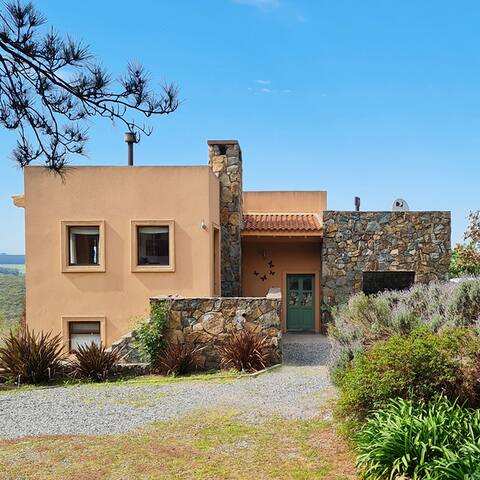
Los Romerillos - House in the Sierras de Tandil
Entire Place • 3 bedrooms

The Forest of Souls
Entire Place • 5 bedrooms
Note: Performance varies based on location, size, amenities, seasonality, and management quality. Data reflects the past 12 months.
Top Performing Airbnb Hosts in Tandil (2026)
Learn from the best! This table showcases top-performing Airbnb hosts in Tandil based on the number of properties managed and estimated total revenue over the past year. Analyze their scale and performance metrics.
| Host Name | Properties | Grossing Revenue | Stay Reviews | Avg Rating |
|---|---|---|---|---|
| Mora | 1 | $67,391 | 12 | 5.00/5.0 |
| Dolores | 1 | $67,306 | 19 | 5.00/5.0 |
| Martin | 3 | $65,574 | 74 | 4.92/5.0 |
| Juli | 14 | $63,662 | 117 | 4.81/5.0 |
| Ana | 1 | $60,465 | 12 | 5.00/5.0 |
| Fede | 3 | $50,854 | 29 | 4.79/5.0 |
| Lula | 8 | $44,776 | 160 | 4.85/5.0 |
| Mario | 1 | $44,358 | 42 | 4.98/5.0 |
| Paula | 1 | $42,554 | 122 | 4.98/5.0 |
| Ariel | 1 | $41,866 | 9 | 5.00/5.0 |
Analyzing the strategies of top hosts, such as their property selection, pricing, and guest communication, can offer valuable lessons for optimizing your own Airbnb operations in Tandil.
Dive Deeper: Advanced Tandil STR Market Data (2026)
Ready to unlock more insights? AirROI provides access to advanced metrics and comprehensive Airbnb data for Tandil. Explore detailed analytics beyond this report to refine your investment strategy, optimize pricing, and maximize your vacation rental profits.
Explore Advanced MetricsTandil Short-Term Rental Market Composition (2026): Property & Room Types
Room Type Distribution
Property Type Distribution
Market Composition Insights for Tandil
- The Tandil Airbnb market composition is heavily skewed towards Entire Home/Apt listings, which make up 94.4% of the 284 active rentals. This indicates strong guest preference for privacy and space.
- Looking at the property type distribution in Tandil, Apartment/Condo properties are the most common (39.4%), reflecting the local real estate landscape.
- Houses represent a significant 39.1% portion, catering likely to families or larger groups.
- The presence of 8.1% Hotel/Boutique listings indicates integration with traditional hospitality.
- Smaller segments like others, unique stays (combined 1.8%) offer potential for unique stay experiences.
Tandil Airbnb Room Capacity Analysis (2026): Bedroom Distribution
Distribution of Listings by Number of Bedrooms
Room Capacity Insights for Tandil
- The dominant room capacity in Tandil is 1 bedroom listings, making up 51.8% of the market. This suggests a strong demand for properties suitable for couples or solo travelers.
- Together, 1 bedroom and 2 bedrooms properties represent 77.2% of the active Airbnb listings in Tandil, indicating a high concentration in these sizes.
- With over half the market (51.8%) consisting of studios or 1-bedroom units, Tandil is particularly well-suited for individuals or couples.
Tandil Vacation Rental Guest Capacity Trends (2026)
Distribution of Listings by Guest Capacity
Guest Capacity Insights for Tandil
- The most common guest capacity trend in Tandil vacation rentals is listings accommodating 4 guests (34.9%). This suggests the primary traveler segment is likely small families or groups.
- Properties designed for 4 guests and 2 guests dominate the Tandil STR market, accounting for 54.3% of listings.
- 21.9% of properties accommodate 6+ guests, serving the market segment for larger families or group travel in Tandil.
- On average, properties in Tandil are equipped to host 4.1 guests.
Tandil Airbnb Booking Patterns (2026): Available vs. Booked Days
Available Days Distribution
Booked Days Distribution
Booking Pattern Insights for Tandil
- The most common availability pattern in Tandil falls within the 271-366 days range, representing 65.8% of listings. This suggests many properties have significant open periods on their calendars.
- Approximately 93.6% of listings show high availability (181+ days open annually), indicating potential for increased bookings or specific owner usage patterns.
- For booked days, the 31-90 days range is most frequent in Tandil (32.7%), reflecting common guest stay durations or potential owner blocking patterns.
- A notable 7.0% of properties secure long booking periods (181+ days booked per year), highlighting successful long-term rental strategies or significant owner usage.
Tandil Airbnb Minimum Stay Requirements Analysis
Distribution of Listings by Minimum Night Requirement
1 Night
72 listings
25.4% of total
2 Nights
102 listings
36% of total
3 Nights
13 listings
4.6% of total
4-6 Nights
2 listings
0.7% of total
30+ Nights
94 listings
33.2% of total
Key Insights
- The most prevalent minimum stay requirement in Tandil is 2 Nights, adopted by 36% of listings. This highlights the market's preference for shorter, flexible bookings.
- A strong majority (61.4%) of the Tandil Airbnb data shows acceptance of very short stays (1-2 nights), indicating a dynamic, high-turnover market.
- A significant segment (33.2%) caters to monthly stays (30+ nights) in Tandil, pointing to opportunities in the extended-stay market.
Recommendations
- Align with the market by considering a 2 Nights minimum stay, as 36% of Tandil hosts use this setting.
- If feasible, allowing 1-night stays, especially midweek or during low season, could capture last-minute bookings, as only 25.4% currently do.
- Explore offering discounts for stays of 30+ nights to attract the 33.2% of the market seeking extended stays.
- Adjust minimum nights based on seasonality – potentially shorter during low season and longer during peak demand periods in Tandil.
Tandil Airbnb Cancellation Policy Trends Analysis (2026)
Limited
28 listings
9.9% of total
Flexible
102 listings
35.9% of total
Moderate
88 listings
31% of total
Firm
59 listings
20.8% of total
Strict
7 listings
2.5% of total
Cancellation Policy Insights for Tandil
- The prevailing Airbnb cancellation policy trend in Tandil is Flexible, used by 35.9% of listings.
- There's a relatively balanced mix between guest-friendly (66.9%) and stricter (23.3%) policies, offering choices for different guest needs.
- Strict cancellation policies are quite rare (2.5%), potentially making listings with this policy less competitive unless justified by high demand or property type.
Recommendations for Hosts
- Consider adopting a Flexible policy to align with the 35.9% market standard in Tandil.
- Using a Strict policy might deter some guests, as only 2.5% of listings use it. Evaluate if potential revenue protection outweighs possible lower booking rates.
- Regularly review your cancellation policy against competitors and market demand shifts in Tandil.
Tandil STR Booking Lead Time Analysis (2026)
Average Booking Lead Time by Month
Booking Lead Time Insights for Tandil
- The overall average booking lead time for vacation rentals in Tandil is 27 days.
- Guests book furthest in advance for stays during November (average 42 days), likely coinciding with peak travel demand or local events.
- The shortest booking windows occur for stays in June (average 16 days), indicating more last-minute travel plans during this time.
- Seasonally, Fall (33 days avg.) sees the longest lead times, while Summer (23 days avg.) has the shortest, reflecting typical travel planning cycles.
Recommendations for Hosts
- Use the overall average lead time (27 days) as a baseline for your pricing and availability strategy in Tandil.
- For November stays, consider implementing length-of-stay discounts or slightly higher rates for bookings made less than 42 days out to capitalize on advance planning.
- Target marketing efforts for the Fall season well in advance (at least 33 days) to capture early planners.
- Monitor your own booking lead times against these Tandil averages to identify opportunities for dynamic pricing adjustments.
Popular & Essential Airbnb Amenities in Tandil (2026)
Amenity Prevalence
Amenity Insights for Tandil
- Essential amenities in Tandil that guests expect include: Wifi, TV. Lacking these (any) could significantly impact bookings.
- Popular amenities like Kitchen, Heating, Hot water are common but not universal. Offering these can provide a competitive edge.
Recommendations for Hosts
- Ensure your listing includes all essential amenities for Tandil: Wifi, TV.
- Prioritize adding missing essentials: Wifi, TV.
- Consider adding popular differentiators like Kitchen or Heating to increase appeal.
- Highlight unique or less common amenities you offer (e.g., hot tub, dedicated workspace, EV charger) in your listing description and photos.
- Regularly check competitor amenities in Tandil to stay competitive.
Tandil Airbnb Guest Demographics & Profile Analysis (2026)
Guest Profile Summary for Tandil
- The typical guest profile for Airbnb in Tandil consists of primarily domestic travelers (86%), often arriving from nearby Buenos Aires, typically belonging to the Post-2000s (Gen Z/Alpha) group (50%), primarily speaking Spanish or English.
- Domestic travelers account for 85.7% of guests.
- Key international markets include Argentina (85.7%) and United States (4.6%).
- Top languages spoken are Spanish (48.5%) followed by English (38.1%).
- A significant demographic segment is the Post-2000s (Gen Z/Alpha) group, representing 50% of guests.
Recommendations for Hosts
- Target domestic marketing efforts towards travelers from Buenos Aires and Mar del Plata.
- Tailor amenities and listing descriptions to appeal to the dominant Post-2000s (Gen Z/Alpha) demographic (e.g., highlight fast WiFi, smart home features, local guides).
- Highlight unique local experiences or amenities relevant to the primary guest profile.
- Consider seasonal promotions aligned with peak travel times for key origin markets.
Nearby Short-Term Rental Market Comparison
How does the Tandil Airbnb market stack up against its neighbors? Compare key performance metrics like average monthly revenue, ADR, and occupancy rates in surrounding areas to understand the broader regional STR landscape.
| Market | Active Properties | Monthly Revenue | Daily Rate | Avg. Occupancy |
|---|---|---|---|---|
| Las Flores | 11 | $621 | $217.52 | 24% |
| Azul | 25 | $337 | $68.99 | 25% |
| Quequén | 48 | $317 | $106.69 | 26% |
| Necochea | 118 | $249 | $71.26 | 28% |
| Olavarría | 21 | $192 | $51.23 | 23% |
| Claromecó | 15 | $188 | $89.68 | 24% |
| San José de Balcarce | 24 | $173 | $47.05 | 26% |