Monte Hermoso Airbnb Market Analysis 2026: Short Term Rental Data & Vacation Rental Statistics in Buenos Aires, Argentina
Is Airbnb profitable in Monte Hermoso in 2026? Explore comprehensive Airbnb analytics for Monte Hermoso, Buenos Aires, Argentina to uncover income potential. This 2026 STR market report for Monte Hermoso, based on AirROI data from February 2025 to January 2026, reveals key trends in the niche market of 107 active listings.
Whether you're considering an Airbnb investment in Monte Hermoso, optimizing your existing vacation rental, or exploring rental arbitrage opportunities, understanding the Monte Hermoso Airbnb data is crucial. Leveraging the low regulation environment is key to maximizing your short term rental income potential. Let's dive into the specifics.
Key Monte Hermoso Airbnb Performance Metrics Overview
Monthly Airbnb Revenue Variations & Income Potential in Monte Hermoso (2026)
Understanding the monthly revenue variations for Airbnb listings in Monte Hermoso is key to maximizing your short term rental income potential. Seasonality significantly impacts earnings. Our analysis, based on data from the past 12 months, shows that the peak revenue month for STRs in Monte Hermoso is typically February, while August often presents the lowest earnings, highlighting opportunities for strategic pricing adjustments during shoulder and low seasons. Explore the typical Airbnb income in Monte Hermoso across different performance tiers:
- Best-in-class properties (Top 10%) achieve $2,186+ monthly, often utilizing dynamic pricing and superior guest experiences.
- Strong performing properties (Top 25%) earn $1,319 or more, indicating effective management and desirable locations/amenities.
- Typical properties (Median) generate around $682 per month, representing the average market performance.
- Entry-level properties (Bottom 25%) see earnings around $376, often with potential for optimization.
Average Monthly Airbnb Earnings Trend in Monte Hermoso
Monte Hermoso Airbnb Occupancy Rate Trends (2026)
Maximize your bookings by understanding the Monte Hermoso STR occupancy trends. Seasonal demand shifts significantly influence how often properties are booked. Typically, Februarysees the highest demand (peak season occupancy), while August experiences the lowest (low season). Effective strategies, like adjusting minimum stays or offering promotions, can boost occupancy during slower periods. Here's how different property tiers perform in Monte Hermoso:
- Best-in-class properties (Top 10%) achieve 45%+ occupancy, indicating high desirability and potentially optimized availability.
- Strong performing properties (Top 25%) maintain 35% or higher occupancy, suggesting good market fit and guest satisfaction.
- Typical properties (Median) have an occupancy rate around 19%.
- Entry-level properties (Bottom 25%) average 11% occupancy, potentially facing higher vacancy.
Average Monthly Occupancy Rate Trend in Monte Hermoso
Average Daily Rate (ADR) Airbnb Trends in Monte Hermoso (2026)
Effective short term rental pricing strategy in Monte Hermoso involves understanding monthly ADR fluctuations. The Average Daily Rate (ADR) for Airbnb in Monte Hermoso typically peaks in January and dips lowest during May. Leveraging Airbnb dynamic pricing tools or strategies based on this seasonality can significantly boost revenue. Here's a look at the typical nightly rates achieved:
- Best-in-class properties (Top 10%) command rates of $205+ per night, often due to premium features or locations.
- Strong performing properties (Top 25%) achieve nightly rates of $162 or more.
- Typical properties (Median) charge around $114 per night.
- Entry-level properties (Bottom 25%) earn around $85 per night.
Average Daily Rate (ADR) Trend by Month in Monte Hermoso
Get Live Monte Hermoso Market Intelligence 👇

Explore Real-time Analytics
Airbnb Seasonality Analysis & Trends in Monte Hermoso (2026)
Peak Season (February, January, March)
- Revenue averages $1,968 per month
- Occupancy rates average 43.7%
- Daily rates average $134
Shoulder Season
- Revenue averages $748 per month
- Occupancy maintains around 19.4%
- Daily rates hold near $131
Low Season (May, June, August)
- Revenue drops to average $418 per month
- Occupancy decreases to average 11.7%
- Daily rates adjust to average $119
Seasonality Insights for Monte Hermoso
- The Airbnb seasonality in Monte Hermoso shows highly seasonal trends requiring careful strategy. While the sections above show seasonal averages, it's also insightful to look at the extremes:
- During the high season, the absolute peak month showcases Monte Hermoso's highest earning potential, with monthly revenues capable of climbing to $2,597, occupancy reaching a high of 58.9%, and ADRs peaking at $144.
- Conversely, the slowest single month of the year, typically falling within the low season, marks the market's lowest point. In this month, revenue might dip to $382, occupancy could drop to 10.6%, and ADRs may adjust down to $118.
- Understanding both the seasonal averages and these monthly peaks and troughs in revenue, occupancy, and ADR is crucial for maximizing your Airbnb profit potential in Monte Hermoso.
Seasonal Strategies for Maximizing Profit
- Peak Season: Maximize revenue through premium pricing and potentially longer minimum stays. Ensure high availability.
- Low Season: Offer competitive pricing, special promotions (e.g., extended stay discounts), and flexible cancellation policies. Target off-season travelers like remote workers or budget-conscious guests.
- Shoulder Seasons: Implement dynamic pricing that balances peak and low rates. Target weekend travelers or specific events. Offer slightly more flexible terms than peak season.
- Regularly analyze your own performance against these Monte Hermoso seasonality benchmarks and adjust your pricing and availability strategy accordingly.
Best Areas for Airbnb Investment in Monte Hermoso (2026)
Exploring the top neighborhoods for short-term rentals in Monte Hermoso? This section highlights key areas, outlining why they are attractive for hosts and guests, along with notable local attractions. Consider these locations based on your target guest profile and investment strategy.
| Neighborhood / Area | Why Host Here? (Target Guests & Appeal) | Key Attractions & Landmarks |
|---|---|---|
| Playa Centro | The central beach area of Monte Hermoso, featuring beautiful sands and easy access to restaurants and shopping. A prime spot for tourists looking for convenience and local attractions. | Monte Hermoso Beach, Local eateries, Water sports activities, Shopping centers |
| Parque Municipal | A lush park area located near the beach, offering a scenic backdrop and opportunities for nature activities. Ideal for families and nature lovers. | Parque Municipal, Nature trails, Picnic areas, Birdwatching spots |
| Avenida Costanera | A picturesque avenue along the coastline, perfect for strolls and cycling. It attracts tourists for its beautiful views and proximity to waterfront activities. | Costanera promenades, Beachside cafes, Scenic views, Cycling paths |
| Barrio El Faro | A quieter residential area that's close to the main tourist attractions, offering a more local experience for visitors. Great for families and longer stays. | Local shops, Cultural experiences, Authentic Argentine cuisine, Community events |
| Zona de Chiringuitos | A popular area with beach bars and chiringuitos (beach shacks), it’s vibrant during the summer and attracts both tourists and locals looking for fun and food. | Beach bars, Live music, Gastronomic festivals, Sunset views |
| Complejo Turístico | A complex that offers various recreational facilities, including swimming pools and sports areas. This is appealing for tourists looking for resort-like amenities. | Swimming pools, Sports facilities, Family activities, Event areas |
| Puerto de Monte Hermoso | The local port area where visitors can enjoy maritime activities and fresh seafood. It gives a unique experience to those interested in fishing and boating. | Fishing tours, Boat rentals, Seafood markets, Maritime history |
| Cerro de la Cruz | A hill that provides stunning panoramic views of Monte Hermoso and the ocean. It’s a great spot for hiking and enjoying nature, attracting adventure seekers. | Hiking trails, Scenic overlooks, Nature photography, Wildlife watching |
Understanding Airbnb License Requirements & STR Laws in Monte Hermoso (2026)
While Monte Hermoso, Buenos Aires, Argentina currently shows low STR regulations, specific Airbnb license requirements might still exist or change. Always verify the latest short term rental regulations and Airbnb license requirements directly with local government authorities for Monte Hermoso to ensure full compliance before hosting.
(Source: AirROI data, 2026, finding no licensed listings among those analyzed)
Top Performing Airbnb Properties in Monte Hermoso (2026)
Benchmark your potential! Explore examples of top-performing Airbnb properties in Monte Hermosobased on Trailing Twelve Month (TTM) revenue. Analyze their characteristics, revenue, occupancy rate, and ADR to understand what drives success in this market.

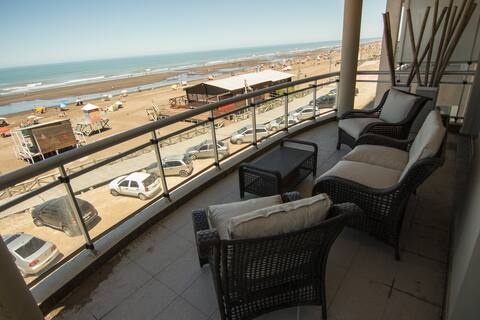
Apartment with a panoramic ocean view
Entire Place • 2 bedrooms

Apartment facing the sea, with a great view and balcony. Premium
Entire Place • 2 bedrooms
Monte Hermoso oceanfront apartment
Entire Place • 3 bedrooms
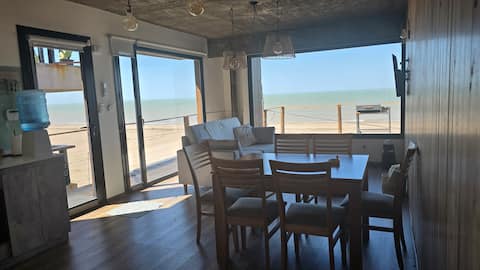
A beachfront house in Sauce G.
Entire Place • 3 bedrooms
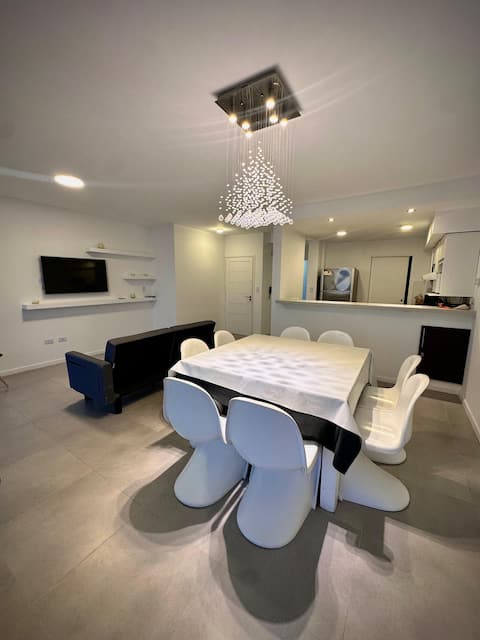
Oceanfront apartment
Entire Place • 3 bedrooms

House for four people meters from the sea (2/4)
Entire Place • 1 bedroom
Note: Performance varies based on location, size, amenities, seasonality, and management quality. Data reflects the past 12 months.
Top Performing Airbnb Hosts in Monte Hermoso (2026)
Learn from the best! This table showcases top-performing Airbnb hosts in Monte Hermoso based on the number of properties managed and estimated total revenue over the past year. Analyze their scale and performance metrics.
| Host Name | Properties | Grossing Revenue | Stay Reviews | Avg Rating |
|---|---|---|---|---|
| Franco | 5 | $37,482 | 44 | 4.99/5.0 |
| Ernesto | 3 | $34,875 | 18 | 5.00/5.0 |
| Flor | 2 | $33,137 | 5 | 5.00/5.0 |
| Micaela | 2 | $29,084 | 4 | 4.33/5.0 |
| Ana | 5 | $26,170 | 30 | 4.84/5.0 |
| Eduardo | 1 | $24,644 | 30 | 5.00/5.0 |
| Mariano | 1 | $21,404 | 27 | 5.00/5.0 |
| Agustin | 1 | $19,640 | 39 | 4.90/5.0 |
| Pablo | 2 | $15,799 | 30 | 4.83/5.0 |
| Adry | 1 | $14,722 | 11 | 5.00/5.0 |
Analyzing the strategies of top hosts, such as their property selection, pricing, and guest communication, can offer valuable lessons for optimizing your own Airbnb operations in Monte Hermoso.
Dive Deeper: Advanced Monte Hermoso STR Market Data (2026)
Ready to unlock more insights? AirROI provides access to advanced metrics and comprehensive Airbnb data for Monte Hermoso. Explore detailed analytics beyond this report to refine your investment strategy, optimize pricing, and maximize your vacation rental profits.
Explore Advanced MetricsMonte Hermoso Short-Term Rental Market Composition (2026): Property & Room Types
Room Type Distribution
Property Type Distribution
Market Composition Insights for Monte Hermoso
- The Monte Hermoso Airbnb market composition is heavily skewed towards Entire Home/Apt listings, which make up 98.1% of the 107 active rentals. This indicates strong guest preference for privacy and space.
- Looking at the property type distribution in Monte Hermoso, Apartment/Condo properties are the most common (57.9%), reflecting the local real estate landscape.
- Houses represent a significant 40.2% portion, catering likely to families or larger groups.
- Smaller segments like hotel/boutique, outdoor/unique (combined 1.8%) offer potential for unique stay experiences.
Monte Hermoso Airbnb Room Capacity Analysis (2026): Bedroom Distribution
Distribution of Listings by Number of Bedrooms
Room Capacity Insights for Monte Hermoso
- The dominant room capacity in Monte Hermoso is 2 bedrooms listings, making up 42.1% of the market. This suggests a strong demand for properties suitable for couples or solo travelers.
- Together, 2 bedrooms and 1 bedroom properties represent 68.3% of the active Airbnb listings in Monte Hermoso, indicating a high concentration in these sizes.
- A significant 22.4% of listings offer 3+ bedrooms, catering to larger groups and families seeking more space in Monte Hermoso.
Monte Hermoso Vacation Rental Guest Capacity Trends (2026)
Distribution of Listings by Guest Capacity
Guest Capacity Insights for Monte Hermoso
- The most common guest capacity trend in Monte Hermoso vacation rentals is listings accommodating 4 guests (31.8%). This suggests the primary traveler segment is likely small families or groups.
- Properties designed for 4 guests and 6 guests dominate the Monte Hermoso STR market, accounting for 54.2% of listings.
- 35.5% of properties accommodate 6+ guests, serving the market segment for larger families or group travel in Monte Hermoso.
- On average, properties in Monte Hermoso are equipped to host 5.0 guests.
Monte Hermoso Airbnb Booking Patterns (2026): Available vs. Booked Days
Available Days Distribution
Booked Days Distribution
Booking Pattern Insights for Monte Hermoso
- The most common availability pattern in Monte Hermoso falls within the 271-366 days range, representing 95.3% of listings. This suggests many properties have significant open periods on their calendars.
- Approximately 100.0% of listings show high availability (181+ days open annually), indicating potential for increased bookings or specific owner usage patterns.
- For booked days, the 31-90 days range is most frequent in Monte Hermoso (51.4%), reflecting common guest stay durations or potential owner blocking patterns.
Monte Hermoso Airbnb Minimum Stay Requirements Analysis
Distribution of Listings by Minimum Night Requirement
1 Night
5 listings
4.7% of total
2 Nights
7 listings
6.5% of total
3 Nights
14 listings
13.1% of total
4-6 Nights
32 listings
29.9% of total
7-29 Nights
8 listings
7.5% of total
30+ Nights
41 listings
38.3% of total
Key Insights
- The most prevalent minimum stay requirement in Monte Hermoso is 30+ Nights, adopted by 38.3% of listings. This highlights the market's preference for longer commitments.
- Very short stays (1-2 nights) are less common (11.2%), suggesting hosts prefer slightly longer bookings to optimize turnover.
- A significant segment (38.3%) caters to monthly stays (30+ nights) in Monte Hermoso, pointing to opportunities in the extended-stay market.
Recommendations
- Align with the market by considering a 30+ Nights minimum stay, as 38.3% of Monte Hermoso hosts use this setting.
- If feasible, allowing 1-night stays, especially midweek or during low season, could capture last-minute bookings, as only 4.7% currently do.
- Explore offering discounts for stays of 30+ nights to attract the 38.3% of the market seeking extended stays.
- Adjust minimum nights based on seasonality – potentially shorter during low season and longer during peak demand periods in Monte Hermoso.
Monte Hermoso Airbnb Cancellation Policy Trends Analysis (2026)
Limited
3 listings
2.8% of total
Flexible
25 listings
23.4% of total
Moderate
16 listings
15% of total
Firm
47 listings
43.9% of total
Strict
16 listings
15% of total
Cancellation Policy Insights for Monte Hermoso
- The prevailing Airbnb cancellation policy trend in Monte Hermoso is Firm, used by 43.9% of listings.
- A majority (58.9%) of hosts in Monte Hermoso utilize Firm or Strict policies, indicating a market where hosts prioritize booking security.
Recommendations for Hosts
- Consider adopting a Firm policy to align with the 43.9% market standard in Monte Hermoso.
- Regularly review your cancellation policy against competitors and market demand shifts in Monte Hermoso.
Monte Hermoso STR Booking Lead Time Analysis (2026)
Average Booking Lead Time by Month
Booking Lead Time Insights for Monte Hermoso
- The overall average booking lead time for vacation rentals in Monte Hermoso is 32 days.
- Guests book furthest in advance for stays during January (average 57 days), likely coinciding with peak travel demand or local events.
- The shortest booking windows occur for stays in June (average 2 days), indicating more last-minute travel plans during this time.
- Seasonally, Winter (43 days avg.) sees the longest lead times, while Summer (8 days avg.) has the shortest, reflecting typical travel planning cycles.
Recommendations for Hosts
- Use the overall average lead time (32 days) as a baseline for your pricing and availability strategy in Monte Hermoso.
- For January stays, consider implementing length-of-stay discounts or slightly higher rates for bookings made less than 57 days out to capitalize on advance planning.
- During June, focus on last-minute booking availability and promotions, as guests book with very short notice (2 days avg.).
- Target marketing efforts for the Winter season well in advance (at least 43 days) to capture early planners.
- Monitor your own booking lead times against these Monte Hermoso averages to identify opportunities for dynamic pricing adjustments.
Popular & Essential Airbnb Amenities in Monte Hermoso (2026)
Amenity Prevalence
Amenity Insights for Monte Hermoso
- Essential amenities in Monte Hermoso that guests expect include: TV, Wifi. Lacking these (any) could significantly impact bookings.
- Popular amenities like Kitchen, Free parking on premises, Hot water are common but not universal. Offering these can provide a competitive edge.
Recommendations for Hosts
- Ensure your listing includes all essential amenities for Monte Hermoso: TV, Wifi.
- Prioritize adding missing essentials: TV, Wifi.
- Consider adding popular differentiators like Kitchen or Free parking on premises to increase appeal.
- Highlight unique or less common amenities you offer (e.g., hot tub, dedicated workspace, EV charger) in your listing description and photos.
- Regularly check competitor amenities in Monte Hermoso to stay competitive.
Monte Hermoso Airbnb Guest Demographics & Profile Analysis (2026)
Guest Profile Summary for Monte Hermoso
- The typical guest profile for Airbnb in Monte Hermoso consists of primarily domestic travelers (93%), often arriving from nearby Buenos Aires, typically belonging to the Post-2000s (Gen Z/Alpha) group (50%), primarily speaking Spanish or English.
- Domestic travelers account for 92.6% of guests.
- Key international markets include Argentina (92.6%) and United States (4.2%).
- Top languages spoken are Spanish (56.8%) followed by English (35.8%).
- A significant demographic segment is the Post-2000s (Gen Z/Alpha) group, representing 50% of guests.
Recommendations for Hosts
- Target domestic marketing efforts towards travelers from Buenos Aires and Bahía Blanca.
- Tailor amenities and listing descriptions to appeal to the dominant Post-2000s (Gen Z/Alpha) demographic (e.g., highlight fast WiFi, smart home features, local guides).
- Highlight unique local experiences or amenities relevant to the primary guest profile.
- Consider seasonal promotions aligned with peak travel times for key origin markets.
Nearby Short-Term Rental Market Comparison
How does the Monte Hermoso Airbnb market stack up against its neighbors? Compare key performance metrics like average monthly revenue, ADR, and occupancy rates in surrounding areas to understand the broader regional STR landscape.
| Market | Active Properties | Monthly Revenue | Daily Rate | Avg. Occupancy |
|---|---|---|---|---|
| Sierra de la Ventana | 23 | $390 | $87.35 | 21% |
| Villa Ventana | 18 | $374 | $97.01 | 21% |
| Bahía Blanca | 164 | $356 | $51.06 | 36% |
| Pehuencó | 13 | $266 | $84.74 | 30% |
| Claromecó | 15 | $188 | $89.68 | 24% |
| Carhué | 10 | $170 | $34.01 | 19% |