Mar del Tuyú Airbnb Market Analysis 2026: Short Term Rental Data & Vacation Rental Statistics in Buenos Aires, Argentina
Is Airbnb profitable in Mar del Tuyú in 2026? Explore comprehensive Airbnb analytics for Mar del Tuyú, Buenos Aires, Argentina to uncover income potential. This 2026 STR market report for Mar del Tuyú, based on AirROI data from February 2025 to January 2026, reveals key trends in the niche market of 31 active listings.
Whether you're considering an Airbnb investment in Mar del Tuyú, optimizing your existing vacation rental, or exploring rental arbitrage opportunities, understanding the Mar del Tuyú Airbnb data is crucial. Leveraging the low regulation environment is key to maximizing your short term rental income potential. Let's dive into the specifics.
Key Mar del Tuyú Airbnb Performance Metrics Overview
Monthly Airbnb Revenue Variations & Income Potential in Mar del Tuyú (2026)
Understanding the monthly revenue variations for Airbnb listings in Mar del Tuyú is key to maximizing your short term rental income potential. Seasonality significantly impacts earnings. Our analysis, based on data from the past 12 months, shows that the peak revenue month for STRs in Mar del Tuyú is typically February, while August often presents the lowest earnings, highlighting opportunities for strategic pricing adjustments during shoulder and low seasons. Explore the typical Airbnb income in Mar del Tuyú across different performance tiers:
- Best-in-class properties (Top 10%) achieve $677+ monthly, often utilizing dynamic pricing and superior guest experiences.
- Strong performing properties (Top 25%) earn $430 or more, indicating effective management and desirable locations/amenities.
- Typical properties (Median) generate around $258 per month, representing the average market performance.
- Entry-level properties (Bottom 25%) see earnings around $149, often with potential for optimization.
Average Monthly Airbnb Earnings Trend in Mar del Tuyú
Mar del Tuyú Airbnb Occupancy Rate Trends (2026)
Maximize your bookings by understanding the Mar del Tuyú STR occupancy trends. Seasonal demand shifts significantly influence how often properties are booked. Typically, Februarysees the highest demand (peak season occupancy), while August experiences the lowest (low season). Effective strategies, like adjusting minimum stays or offering promotions, can boost occupancy during slower periods. Here's how different property tiers perform in Mar del Tuyú:
- Best-in-class properties (Top 10%) achieve 40%+ occupancy, indicating high desirability and potentially optimized availability.
- Strong performing properties (Top 25%) maintain 24% or higher occupancy, suggesting good market fit and guest satisfaction.
- Typical properties (Median) have an occupancy rate around 14%.
- Entry-level properties (Bottom 25%) average 8% occupancy, potentially facing higher vacancy.
Average Monthly Occupancy Rate Trend in Mar del Tuyú
Average Daily Rate (ADR) Airbnb Trends in Mar del Tuyú (2026)
Effective short term rental pricing strategy in Mar del Tuyú involves understanding monthly ADR fluctuations. The Average Daily Rate (ADR) for Airbnb in Mar del Tuyú typically peaks in September and dips lowest during November. Leveraging Airbnb dynamic pricing tools or strategies based on this seasonality can significantly boost revenue. Here's a look at the typical nightly rates achieved:
- Best-in-class properties (Top 10%) command rates of $98+ per night, often due to premium features or locations.
- Strong performing properties (Top 25%) achieve nightly rates of $79 or more.
- Typical properties (Median) charge around $60 per night.
- Entry-level properties (Bottom 25%) earn around $50 per night.
Average Daily Rate (ADR) Trend by Month in Mar del Tuyú
Get Live Mar del Tuyú Market Intelligence 👇

Explore Real-time Analytics
Airbnb Seasonality Analysis & Trends in Mar del Tuyú (2026)
Peak Season (February, January, March)
- Revenue averages $675 per month
- Occupancy rates average 38.3%
- Daily rates average $65
Shoulder Season
- Revenue averages $252 per month
- Occupancy maintains around 14.4%
- Daily rates hold near $65
Low Season (May, July, August)
- Revenue drops to average $94 per month
- Occupancy decreases to average 5.8%
- Daily rates adjust to average $65
Seasonality Insights for Mar del Tuyú
- The Airbnb seasonality in Mar del Tuyú shows highly seasonal trends requiring careful strategy. While the sections above show seasonal averages, it's also insightful to look at the extremes:
- During the high season, the absolute peak month showcases Mar del Tuyú's highest earning potential, with monthly revenues capable of climbing to $1,073, occupancy reaching a high of 62.5%, and ADRs peaking at $68.
- Conversely, the slowest single month of the year, typically falling within the low season, marks the market's lowest point. In this month, revenue might dip to $57, occupancy could drop to 4.3%, and ADRs may adjust down to $64.
- Understanding both the seasonal averages and these monthly peaks and troughs in revenue, occupancy, and ADR is crucial for maximizing your Airbnb profit potential in Mar del Tuyú.
Seasonal Strategies for Maximizing Profit
- Peak Season: Maximize revenue through premium pricing and potentially longer minimum stays. Ensure high availability.
- Low Season: Offer competitive pricing, special promotions (e.g., extended stay discounts), and flexible cancellation policies. Target off-season travelers like remote workers or budget-conscious guests.
- Shoulder Seasons: Implement dynamic pricing that balances peak and low rates. Target weekend travelers or specific events. Offer slightly more flexible terms than peak season.
- Regularly analyze your own performance against these Mar del Tuyú seasonality benchmarks and adjust your pricing and availability strategy accordingly.
Best Areas for Airbnb Investment in Mar del Tuyú (2026)
Exploring the top neighborhoods for short-term rentals in Mar del Tuyú? This section highlights key areas, outlining why they are attractive for hosts and guests, along with notable local attractions. Consider these locations based on your target guest profile and investment strategy.
| Neighborhood / Area | Why Host Here? (Target Guests & Appeal) | Key Attractions & Landmarks |
|---|---|---|
| Playa de Mar del Tuyú | A beautiful beach location, perfect for families and tourists looking for a sun-soaked vacation by the sea. Ideal for beach bars, water sports, and relaxing holidays. | Mar del Tuyú Beach, Water sports activities, Beachfront restaurants, Local artisan markets |
| Centro de Mar del Tuyú | The vibrant city center offers a mix of dining, shopping, and local culture. A great spot for those seeking convenience and proximity to various amenities. | Local shops, Restaurants, Cafes, Cultural events, Public square |
| Parque Municipal | A tranquil park area for nature lovers, known for its green spaces and family-friendly atmosphere. Attracts visitors looking to enjoy outdoor activities. | Nature trails, Picnic areas, Children's play zones, Outdoor sports |
| Playa Copacabana | A less crowded beach area, known for its peaceful ambiance and natural beauty. Ideal for those seeking relaxation and quiet surroundings. | Secluded beach, Walking trails, Nature views, Small local eateries |
| Barrio Mar del Tuyú | A neighborhood that offers a more local experience with a mix of community vibes and proximity to the beach, catering to tourists looking for an authentic stay. | Local stores, Community parks, Cultural exchanges, Gastronomic experiences |
| La Reserva Natural | A beautiful natural reserve that attracts eco-tourists and nature lovers. Opportunities for wildlife observation and outdoor activities. | Wildlife watching, Trekking routes, Photography spots, Nature conservation areas |
| Vista al Mar | Neighborhood known for its panoramic views of the sea. Attracts visitors looking for picturesque scenery and a relaxing environment. | Scenic viewpoints, Beach access, Seaside cafes, Sunset watching spots |
| Los Acantilados | A scenic area with cliffs and stunning sea views. Ideal for those looking to explore rugged natural beauty and enjoy hiking. | Cliffside walking paths, Breathtaking views, Photography opportunities, Hiking trails |
Understanding Airbnb License Requirements & STR Laws in Mar del Tuyú (2026)
While Mar del Tuyú, Buenos Aires, Argentina currently shows low STR regulations, specific Airbnb license requirements might still exist or change. Always verify the latest short term rental regulations and Airbnb license requirements directly with local government authorities for Mar del Tuyú to ensure full compliance before hosting.
(Source: AirROI data, 2026, based on 3% licensed listings)
Top Performing Airbnb Properties in Mar del Tuyú (2026)
Benchmark your potential! Explore examples of top-performing Airbnb properties in Mar del Tuyúbased on Trailing Twelve Month (TTM) revenue. Analyze their characteristics, revenue, occupancy rate, and ADR to understand what drives success in this market.
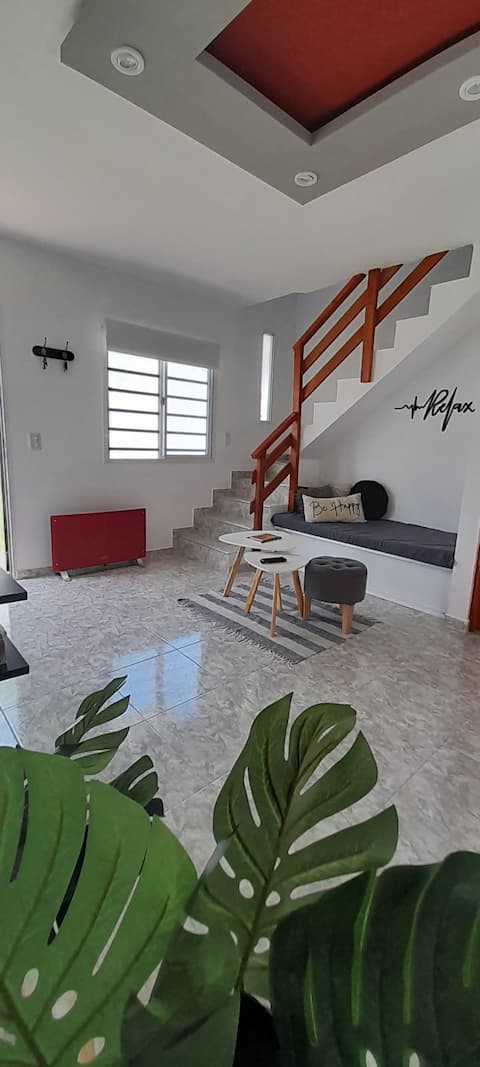
Mar del Tuyú Duplex Relax
Entire Place • 2 bedrooms
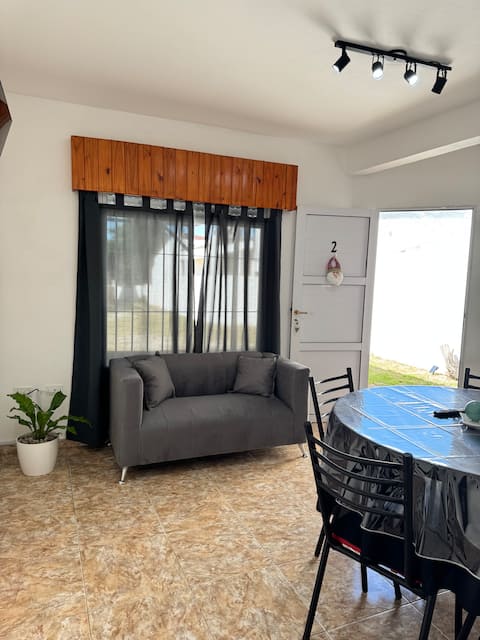
NAEN Complex - (Beach Apartments) Mar del Tuyú (2)
Entire Place • 2 bedrooms
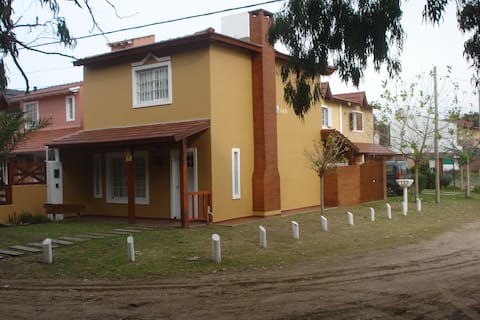
Beautiful house in the middle of a forest reserve
Entire Place • 2 bedrooms
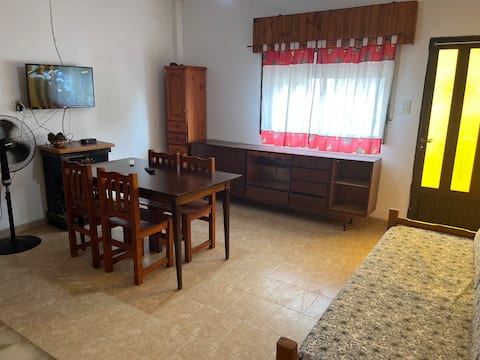
NAEN Complex - (Beach Apartments) Mar del Tuyú (1)
Entire Place • 2 bedrooms
Calandrias del Tuyu d3. Apartment for 4 people
Entire Place • 1 bedroom
Duplex for 7 people Mar del Tuyu
Entire Place • 3 bedrooms
Note: Performance varies based on location, size, amenities, seasonality, and management quality. Data reflects the past 12 months.
Top Performing Airbnb Hosts in Mar del Tuyú (2026)
Learn from the best! This table showcases top-performing Airbnb hosts in Mar del Tuyú based on the number of properties managed and estimated total revenue over the past year. Analyze their scale and performance metrics.
| Host Name | Properties | Grossing Revenue | Stay Reviews | Avg Rating |
|---|---|---|---|---|
| Mariano | 6 | $10,396 | 154 | 4.75/5.0 |
| Karina | 1 | $7,863 | 20 | 4.85/5.0 |
| Ezequiel | 2 | $7,282 | 4 | 5.00/5.0 |
| Dario | 1 | $3,792 | 11 | 4.64/5.0 |
| Akke | 3 | $2,895 | 64 | 4.54/5.0 |
| Claudio | 1 | $2,728 | 1 | Not Rated |
| Nancy | 1 | $2,657 | 16 | 4.31/5.0 |
| Fabrizio | 1 | $2,609 | 5 | 4.60/5.0 |
| Mariela | 1 | $2,311 | 29 | 4.83/5.0 |
| María Fernanda | 2 | $2,238 | 18 | 4.75/5.0 |
Analyzing the strategies of top hosts, such as their property selection, pricing, and guest communication, can offer valuable lessons for optimizing your own Airbnb operations in Mar del Tuyú.
Dive Deeper: Advanced Mar del Tuyú STR Market Data (2026)
Ready to unlock more insights? AirROI provides access to advanced metrics and comprehensive Airbnb data for Mar del Tuyú. Explore detailed analytics beyond this report to refine your investment strategy, optimize pricing, and maximize your vacation rental profits.
Explore Advanced MetricsMar del Tuyú Short-Term Rental Market Composition (2026): Property & Room Types
Room Type Distribution
Property Type Distribution
Market Composition Insights for Mar del Tuyú
- The Mar del Tuyú Airbnb market composition is heavily skewed towards Entire Home/Apt listings, which make up 100% of the 31 active rentals. This indicates strong guest preference for privacy and space.
- Looking at the property type distribution in Mar del Tuyú, House properties are the most common (48.4%), reflecting the local real estate landscape.
- Houses represent a significant 48.4% portion, catering likely to families or larger groups.
- Smaller segments like outdoor/unique (combined 3.2%) offer potential for unique stay experiences.
Mar del Tuyú Airbnb Room Capacity Analysis (2026): Bedroom Distribution
Distribution of Listings by Number of Bedrooms
Room Capacity Insights for Mar del Tuyú
- The dominant room capacity in Mar del Tuyú is 2 bedrooms listings, making up 54.8% of the market. This suggests a strong demand for properties suitable for couples or solo travelers.
- Together, 2 bedrooms and 1 bedroom properties represent 77.4% of the active Airbnb listings in Mar del Tuyú, indicating a high concentration in these sizes.
Mar del Tuyú Vacation Rental Guest Capacity Trends (2026)
Distribution of Listings by Guest Capacity
Guest Capacity Insights for Mar del Tuyú
- The most common guest capacity trend in Mar del Tuyú vacation rentals is listings accommodating 6 guests (35.5%). This suggests the primary traveler segment is likely larger groups.
- Properties designed for 6 guests and 4 guests dominate the Mar del Tuyú STR market, accounting for 58.1% of listings.
- 51.7% of properties accommodate 6+ guests, serving the market segment for larger families or group travel in Mar del Tuyú.
- On average, properties in Mar del Tuyú are equipped to host 5.5 guests.
Mar del Tuyú Airbnb Booking Patterns (2026): Available vs. Booked Days
Available Days Distribution
Booked Days Distribution
Booking Pattern Insights for Mar del Tuyú
- The most common availability pattern in Mar del Tuyú falls within the 271-366 days range, representing 96.8% of listings. This suggests many properties have significant open periods on their calendars.
- Approximately 100.0% of listings show high availability (181+ days open annually), indicating potential for increased bookings or specific owner usage patterns.
- For booked days, the 1-30 days range is most frequent in Mar del Tuyú (54.8%), reflecting common guest stay durations or potential owner blocking patterns.
Mar del Tuyú Airbnb Minimum Stay Requirements Analysis
Distribution of Listings by Minimum Night Requirement
1 Night
6 listings
19.4% of total
2 Nights
5 listings
16.1% of total
3 Nights
5 listings
16.1% of total
4-6 Nights
4 listings
12.9% of total
7-29 Nights
2 listings
6.5% of total
30+ Nights
9 listings
29% of total
Key Insights
- The most prevalent minimum stay requirement in Mar del Tuyú is 30+ Nights, adopted by 29% of listings. This highlights the market's preference for longer commitments.
- A significant segment (29%) caters to monthly stays (30+ nights) in Mar del Tuyú, pointing to opportunities in the extended-stay market.
Recommendations
- Align with the market by considering a 30+ Nights minimum stay, as 29% of Mar del Tuyú hosts use this setting.
- If feasible, allowing 1-night stays, especially midweek or during low season, could capture last-minute bookings, as only 19.4% currently do.
- Explore offering discounts for stays of 30+ nights to attract the 29% of the market seeking extended stays.
- Adjust minimum nights based on seasonality – potentially shorter during low season and longer during peak demand periods in Mar del Tuyú.
Mar del Tuyú Airbnb Cancellation Policy Trends Analysis (2026)
Limited
1 listings
3.2% of total
Flexible
4 listings
12.9% of total
Moderate
5 listings
16.1% of total
Firm
20 listings
64.5% of total
Strict
1 listings
3.2% of total
Cancellation Policy Insights for Mar del Tuyú
- The prevailing Airbnb cancellation policy trend in Mar del Tuyú is Firm, used by 64.5% of listings.
- A majority (67.7%) of hosts in Mar del Tuyú utilize Firm or Strict policies, indicating a market where hosts prioritize booking security.
- Strict cancellation policies are quite rare (3.2%), potentially making listings with this policy less competitive unless justified by high demand or property type.
Recommendations for Hosts
- Consider adopting a Firm policy to align with the 64.5% market standard in Mar del Tuyú.
- Using a Strict policy might deter some guests, as only 3.2% of listings use it. Evaluate if potential revenue protection outweighs possible lower booking rates.
- Regularly review your cancellation policy against competitors and market demand shifts in Mar del Tuyú.
Mar del Tuyú STR Booking Lead Time Analysis (2026)
Average Booking Lead Time by Month
Booking Lead Time Insights for Mar del Tuyú
- The overall average booking lead time for vacation rentals in Mar del Tuyú is 26 days.
- Guests book furthest in advance for stays during January (average 37 days), likely coinciding with peak travel demand or local events.
- The shortest booking windows occur for stays in July (average 5 days), indicating more last-minute travel plans during this time.
- Seasonally, Winter (32 days avg.) sees the longest lead times, while Summer (5 days avg.) has the shortest, reflecting typical travel planning cycles.
Recommendations for Hosts
- Use the overall average lead time (26 days) as a baseline for your pricing and availability strategy in Mar del Tuyú.
- For January stays, consider implementing length-of-stay discounts or slightly higher rates for bookings made less than 37 days out to capitalize on advance planning.
- During July, focus on last-minute booking availability and promotions, as guests book with very short notice (5 days avg.).
- Target marketing efforts for the Winter season well in advance (at least 32 days) to capture early planners.
- Monitor your own booking lead times against these Mar del Tuyú averages to identify opportunities for dynamic pricing adjustments.
Popular & Essential Airbnb Amenities in Mar del Tuyú (2026)
Amenity Prevalence
Amenity Insights for Mar del Tuyú
- Essential amenities in Mar del Tuyú that guests expect include: Kitchen, TV. Lacking these (any) could significantly impact bookings.
- Popular amenities like Wifi, Free parking on premises, Dishes and silverware are common but not universal. Offering these can provide a competitive edge.
- Warning: Wifi is not universally provided but is considered essential globally. Ensure reliable Wifi is offered.
Recommendations for Hosts
- Ensure your listing includes all essential amenities for Mar del Tuyú: Kitchen, TV.
- Prioritize adding missing essentials: TV.
- Consider adding popular differentiators like Wifi or Free parking on premises to increase appeal.
- Highlight unique or less common amenities you offer (e.g., hot tub, dedicated workspace, EV charger) in your listing description and photos.
- Regularly check competitor amenities in Mar del Tuyú to stay competitive.
Mar del Tuyú Airbnb Guest Demographics & Profile Analysis (2026)
Guest Profile Summary for Mar del Tuyú
- The typical guest profile for Airbnb in Mar del Tuyú consists of primarily domestic travelers (88%), often arriving from nearby Buenos Aires, typically belonging to the Post-2000s (Gen Z/Alpha) group (50%), primarily speaking Spanish or English.
- Domestic travelers account for 87.5% of guests.
- Key international markets include Argentina (87.5%) and United States (6.3%).
- Top languages spoken are Spanish (52.9%) followed by English (29.4%).
- A significant demographic segment is the Post-2000s (Gen Z/Alpha) group, representing 50% of guests.
Recommendations for Hosts
- Target domestic marketing efforts towards travelers from Buenos Aires and Ramos Mejía.
- Tailor amenities and listing descriptions to appeal to the dominant Post-2000s (Gen Z/Alpha) demographic (e.g., highlight fast WiFi, smart home features, local guides).
- Highlight unique local experiences or amenities relevant to the primary guest profile.
- Consider seasonal promotions aligned with peak travel times for key origin markets.
Nearby Short-Term Rental Market Comparison
How does the Mar del Tuyú Airbnb market stack up against its neighbors? Compare key performance metrics like average monthly revenue, ADR, and occupancy rates in surrounding areas to understand the broader regional STR landscape.
| Market | Active Properties | Monthly Revenue | Daily Rate | Avg. Occupancy |
|---|---|---|---|---|
| Costa Esmeralda | 255 | $1,589 | $270.37 | 29% |
| Villarobles | 16 | $1,468 | $299.78 | 32% |
| Cariló | 216 | $1,420 | $235.40 | 31% |
| Mar de las Pampas | 115 | $680 | $138.97 | 31% |
| Pinamar | 700 | $659 | $138.32 | 31% |
| Las Gaviotas | 62 | $656 | $124.37 | 34% |
| Sierra de los Padres | 58 | $536 | $110.54 | 27% |
| Valeria del Mar | 139 | $480 | $124.93 | 31% |
| Mar Azul | 160 | $439 | $117.02 | 29% |
| Costa del Este | 36 | $417 | $110.70 | 25% |