City Bell Airbnb Market Analysis 2026: Short Term Rental Data & Vacation Rental Statistics in Buenos Aires, Argentina
Is Airbnb profitable in City Bell in 2026? Explore comprehensive Airbnb analytics for City Bell, Buenos Aires, Argentina to uncover income potential. This 2026 STR market report for City Bell, based on AirROI data from February 2025 to January 2026, reveals key trends in the niche market of 29 active listings.
Whether you're considering an Airbnb investment in City Bell, optimizing your existing vacation rental, or exploring rental arbitrage opportunities, understanding the City Bell Airbnb data is crucial. Leveraging the low regulation environment is key to maximizing your short term rental income potential. Let's dive into the specifics.
Key City Bell Airbnb Performance Metrics Overview
Monthly Airbnb Revenue Variations & Income Potential in City Bell (2026)
Understanding the monthly revenue variations for Airbnb listings in City Bell is key to maximizing your short term rental income potential. Seasonality significantly impacts earnings. Our analysis, based on data from the past 12 months, shows that the peak revenue month for STRs in City Bell is typically March, while October often presents the lowest earnings, highlighting opportunities for strategic pricing adjustments during shoulder and low seasons. Explore the typical Airbnb income in City Bell across different performance tiers:
- Best-in-class properties (Top 10%) achieve $1,978+ monthly, often utilizing dynamic pricing and superior guest experiences.
- Strong performing properties (Top 25%) earn $897 or more, indicating effective management and desirable locations/amenities.
- Typical properties (Median) generate around $464 per month, representing the average market performance.
- Entry-level properties (Bottom 25%) see earnings around $254, often with potential for optimization.
Average Monthly Airbnb Earnings Trend in City Bell
City Bell Airbnb Occupancy Rate Trends (2026)
Maximize your bookings by understanding the City Bell STR occupancy trends. Seasonal demand shifts significantly influence how often properties are booked. Typically, Aprilsees the highest demand (peak season occupancy), while October experiences the lowest (low season). Effective strategies, like adjusting minimum stays or offering promotions, can boost occupancy during slower periods. Here's how different property tiers perform in City Bell:
- Best-in-class properties (Top 10%) achieve 60%+ occupancy, indicating high desirability and potentially optimized availability.
- Strong performing properties (Top 25%) maintain 40% or higher occupancy, suggesting good market fit and guest satisfaction.
- Typical properties (Median) have an occupancy rate around 22%.
- Entry-level properties (Bottom 25%) average 9% occupancy, potentially facing higher vacancy.
Average Monthly Occupancy Rate Trend in City Bell
Average Daily Rate (ADR) Airbnb Trends in City Bell (2026)
Effective short term rental pricing strategy in City Bell involves understanding monthly ADR fluctuations. The Average Daily Rate (ADR) for Airbnb in City Bell typically peaks in January and dips lowest during April. Leveraging Airbnb dynamic pricing tools or strategies based on this seasonality can significantly boost revenue. Here's a look at the typical nightly rates achieved:
- Best-in-class properties (Top 10%) command rates of $150+ per night, often due to premium features or locations.
- Strong performing properties (Top 25%) achieve nightly rates of $110 or more.
- Typical properties (Median) charge around $74 per night.
- Entry-level properties (Bottom 25%) earn around $55 per night.
Average Daily Rate (ADR) Trend by Month in City Bell
Get Live City Bell Market Intelligence 👇

Explore Real-time Analytics
Airbnb Seasonality Analysis & Trends in City Bell (2026)
Peak Season (March, April, February)
- Revenue averages $1,156 per month
- Occupancy rates average 38.4%
- Daily rates average $85
Shoulder Season
- Revenue averages $642 per month
- Occupancy maintains around 26.3%
- Daily rates hold near $89
Low Season (May, August, October)
- Revenue drops to average $440 per month
- Occupancy decreases to average 17.7%
- Daily rates adjust to average $85
Seasonality Insights for City Bell
- The Airbnb seasonality in City Bell shows highly seasonal trends requiring careful strategy. While the sections above show seasonal averages, it's also insightful to look at the extremes:
- During the high season, the absolute peak month showcases City Bell's highest earning potential, with monthly revenues capable of climbing to $1,338, occupancy reaching a high of 40.4%, and ADRs peaking at $93.
- Conversely, the slowest single month of the year, typically falling within the low season, marks the market's lowest point. In this month, revenue might dip to $370, occupancy could drop to 15.2%, and ADRs may adjust down to $84.
- Understanding both the seasonal averages and these monthly peaks and troughs in revenue, occupancy, and ADR is crucial for maximizing your Airbnb profit potential in City Bell.
Seasonal Strategies for Maximizing Profit
- Peak Season: Maximize revenue through premium pricing and potentially longer minimum stays. Ensure high availability.
- Low Season: Offer competitive pricing, special promotions (e.g., extended stay discounts), and flexible cancellation policies. Target off-season travelers like remote workers or budget-conscious guests.
- Shoulder Seasons: Implement dynamic pricing that balances peak and low rates. Target weekend travelers or specific events. Offer slightly more flexible terms than peak season.
- Regularly analyze your own performance against these City Bell seasonality benchmarks and adjust your pricing and availability strategy accordingly.
Best Areas for Airbnb Investment in City Bell (2026)
Exploring the top neighborhoods for short-term rentals in City Bell? This section highlights key areas, outlining why they are attractive for hosts and guests, along with notable local attractions. Consider these locations based on your target guest profile and investment strategy.
| Neighborhood / Area | Why Host Here? (Target Guests & Appeal) | Key Attractions & Landmarks |
|---|---|---|
| City Center | The heart of City Bell, offering a mix of cultural, dining, and shopping experiences. It attracts both tourists and locals, making it a prime location for short-term rentals. | City Bell Park, Shopping areas, Cafes and restaurants, Cultural events, Public transportation access |
| Breathe Life Park | A serene area with green spaces and recreational activities. It's popular among families and nature lovers, ideal for those looking to relax in nature. | Breathe Life Park, Walking trails, Picnic areas, Playgrounds, Nature walks |
| Grocery and Commerce District | Home to the main grocery stores and markets, this area is vital for short-term visitors who prioritize convenience and easy access to essentials. | Local grocery stores, Markets, Restaurants, Cafes, Shopping options |
| Cultural Avenue | This area features cultural institutions and is home to local artists. It attracts visitors interested in the arts and local culture. | Art galleries, Local theaters, Cultural festivals, Music venues, Art fairs |
| Hospitality District | Known for its hotels and dining options, this region caters to tourists looking for accommodation close to various amenities and experiences. | Major hotels, Restaurants, Bars, Entertainment venues, Public transport |
| Residential District | A quiet residential area that attracts travelers looking for a more local experience, offering comfort and homely accommodations. | Local homes, Parks, Community centers, Quiet streets, Family-friendly environment |
| Educational Hub | In proximity to educational institutions, this area attracts students and families involved in education, making it a steady location for Airbnb rentals. | Universities and colleges, Libraries, Study spots, Student cafes, Community gatherings |
| Craft Beer Lane | This trendy area is known for its craft breweries and bars, drawing a younger crowd interested in nightlife and local brews. | Craft breweries, Bars and nightclubs, Live music venues, Food trucks, Culinary festivals |
Understanding Airbnb License Requirements & STR Laws in City Bell (2026)
While City Bell, Buenos Aires, Argentina currently shows low STR regulations, specific Airbnb license requirements might still exist or change. Always verify the latest short term rental regulations and Airbnb license requirements directly with local government authorities for City Bell to ensure full compliance before hosting.
(Source: AirROI data, 2026, finding no licensed listings among those analyzed)
Top Performing Airbnb Properties in City Bell (2026)
Benchmark your potential! Explore examples of top-performing Airbnb properties in City Bellbased on Trailing Twelve Month (TTM) revenue. Analyze their characteristics, revenue, occupancy rate, and ADR to understand what drives success in this market.

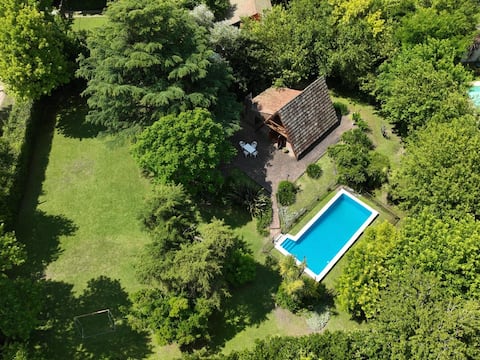
Large country cabin
Entire Place • 2 bedrooms
Casa Oliva
Entire Place • 2 bedrooms

Casa Quinta City Bell
Entire Place • 3 bedrooms
Casa Quinta City Bell, 🌲🌴pool and💦 grill area
Entire Place • 2 bedrooms

El Aguaribay | The perfect getaway
Entire Place • 1 bedroom

Like Home Casa City Bell
Entire Place • 2 bedrooms
Note: Performance varies based on location, size, amenities, seasonality, and management quality. Data reflects the past 12 months.
Top Performing Airbnb Hosts in City Bell (2026)
Learn from the best! This table showcases top-performing Airbnb hosts in City Bell based on the number of properties managed and estimated total revenue over the past year. Analyze their scale and performance metrics.
| Host Name | Properties | Grossing Revenue | Stay Reviews | Avg Rating |
|---|---|---|---|---|
| Sol | 1 | $18,413 | 6 | 5.00/5.0 |
| Lucia | 2 | $17,761 | 29 | 4.83/5.0 |
| Osvaldo | 1 | $16,070 | 30 | 5.00/5.0 |
| Gla | 2 | $12,432 | 61 | 5.00/5.0 |
| Romina | 1 | $11,619 | 6 | 4.83/5.0 |
| Elena | 2 | $11,505 | 50 | 4.81/5.0 |
| Federico | 1 | $10,723 | 30 | 4.80/5.0 |
| Like Home | 1 | $9,677 | 1 | Not Rated |
| Carolina | 1 | $7,653 | 2 | Not Rated |
| Mercedes | 1 | $6,445 | 35 | 4.89/5.0 |
Analyzing the strategies of top hosts, such as their property selection, pricing, and guest communication, can offer valuable lessons for optimizing your own Airbnb operations in City Bell.
Dive Deeper: Advanced City Bell STR Market Data (2026)
Ready to unlock more insights? AirROI provides access to advanced metrics and comprehensive Airbnb data for City Bell. Explore detailed analytics beyond this report to refine your investment strategy, optimize pricing, and maximize your vacation rental profits.
Explore Advanced MetricsCity Bell Short-Term Rental Market Composition (2026): Property & Room Types
Room Type Distribution
Property Type Distribution
Market Composition Insights for City Bell
- The City Bell Airbnb market composition is heavily skewed towards Entire Home/Apt listings, which make up 89.7% of the 29 active rentals. This indicates strong guest preference for privacy and space.
- Looking at the property type distribution in City Bell, House properties are the most common (75.9%), reflecting the local real estate landscape.
- Houses represent a significant 75.9% portion, catering likely to families or larger groups.
- The presence of 6.9% Hotel/Boutique listings indicates integration with traditional hospitality.
- Smaller segments like others, outdoor/unique (combined 6.8%) offer potential for unique stay experiences.
City Bell Airbnb Room Capacity Analysis (2026): Bedroom Distribution
Distribution of Listings by Number of Bedrooms
Room Capacity Insights for City Bell
- The dominant room capacity in City Bell is 2 bedrooms listings, making up 41.4% of the market. This suggests a strong demand for properties suitable for couples or solo travelers.
- Together, 2 bedrooms and 1 bedroom properties represent 75.9% of the active Airbnb listings in City Bell, indicating a high concentration in these sizes.
City Bell Vacation Rental Guest Capacity Trends (2026)
Distribution of Listings by Guest Capacity
Guest Capacity Insights for City Bell
- The most common guest capacity trend in City Bell vacation rentals is listings accommodating 2 guests (17.2%). This suggests the primary traveler segment is likely couples or solo travelers.
- Properties designed for 2 guests and 6 guests dominate the City Bell STR market, accounting for 34.4% of listings.
- 27.5% of properties accommodate 6+ guests, serving the market segment for larger families or group travel in City Bell.
- On average, properties in City Bell are equipped to host 3.8 guests.
City Bell Airbnb Booking Patterns (2026): Available vs. Booked Days
Available Days Distribution
Booked Days Distribution
Booking Pattern Insights for City Bell
- The most common availability pattern in City Bell falls within the 271-366 days range, representing 75.9% of listings. This suggests many properties have significant open periods on their calendars.
- Approximately 96.6% of listings show high availability (181+ days open annually), indicating potential for increased bookings or specific owner usage patterns.
- For booked days, the 1-30 days range is most frequent in City Bell (37.9%), reflecting common guest stay durations or potential owner blocking patterns.
- A notable 3.4% of properties secure long booking periods (181+ days booked per year), highlighting successful long-term rental strategies or significant owner usage.
City Bell Airbnb Minimum Stay Requirements Analysis
Distribution of Listings by Minimum Night Requirement
1 Night
7 listings
24.1% of total
2 Nights
7 listings
24.1% of total
3 Nights
3 listings
10.3% of total
4-6 Nights
2 listings
6.9% of total
7-29 Nights
3 listings
10.3% of total
30+ Nights
7 listings
24.1% of total
Key Insights
- The most prevalent minimum stay requirement in City Bell is 1 Night, adopted by 24.1% of listings. This highlights the market's preference for shorter, flexible bookings.
- A significant segment (24.1%) caters to monthly stays (30+ nights) in City Bell, pointing to opportunities in the extended-stay market.
Recommendations
- Align with the market by considering a 1 Night minimum stay, as 24.1% of City Bell hosts use this setting.
- If feasible, allowing 1-night stays, especially midweek or during low season, could capture last-minute bookings, as only 24.1% currently do.
- Explore offering discounts for stays of 30+ nights to attract the 24.1% of the market seeking extended stays.
- Adjust minimum nights based on seasonality – potentially shorter during low season and longer during peak demand periods in City Bell.
City Bell Airbnb Cancellation Policy Trends Analysis (2026)
Limited
2 listings
6.9% of total
Flexible
12 listings
41.4% of total
Moderate
7 listings
24.1% of total
Firm
5 listings
17.2% of total
Strict
3 listings
10.3% of total
Cancellation Policy Insights for City Bell
- The prevailing Airbnb cancellation policy trend in City Bell is Flexible, used by 41.4% of listings.
- There's a relatively balanced mix between guest-friendly (65.5%) and stricter (27.5%) policies, offering choices for different guest needs.
Recommendations for Hosts
- Consider adopting a Flexible policy to align with the 41.4% market standard in City Bell.
- Using a Strict policy might deter some guests, as only 10.3% of listings use it. Evaluate if potential revenue protection outweighs possible lower booking rates.
- Regularly review your cancellation policy against competitors and market demand shifts in City Bell.
City Bell STR Booking Lead Time Analysis (2026)
Average Booking Lead Time by Month
Booking Lead Time Insights for City Bell
- The overall average booking lead time for vacation rentals in City Bell is 16 days.
- Guests book furthest in advance for stays during December (average 30 days), likely coinciding with peak travel demand or local events.
- The shortest booking windows occur for stays in August (average 7 days), indicating more last-minute travel plans during this time.
- Seasonally, Winter (25 days avg.) sees the longest lead times, while Fall (12 days avg.) has the shortest, reflecting typical travel planning cycles.
Recommendations for Hosts
- Use the overall average lead time (16 days) as a baseline for your pricing and availability strategy in City Bell.
- For December stays, consider implementing length-of-stay discounts or slightly higher rates for bookings made less than 30 days out to capitalize on advance planning.
- During August, focus on last-minute booking availability and promotions, as guests book with very short notice (7 days avg.).
- Target marketing efforts for the Winter season well in advance (at least 25 days) to capture early planners.
- Monitor your own booking lead times against these City Bell averages to identify opportunities for dynamic pricing adjustments.
Popular & Essential Airbnb Amenities in City Bell (2026)
Amenity Prevalence
Amenity Insights for City Bell
- Essential amenities in City Bell that guests expect include: Wifi. Lacking these (this) could significantly impact bookings.
- Popular amenities like Air conditioning, Free parking on premises, Kitchen are common but not universal. Offering these can provide a competitive edge.
Recommendations for Hosts
- Ensure your listing includes all essential amenities for City Bell: Wifi.
- Prioritize adding missing essentials: Wifi.
- Consider adding popular differentiators like Air conditioning or Free parking on premises to increase appeal.
- Highlight unique or less common amenities you offer (e.g., hot tub, dedicated workspace, EV charger) in your listing description and photos.
- Regularly check competitor amenities in City Bell to stay competitive.
City Bell Airbnb Guest Demographics & Profile Analysis (2026)
Guest Profile Summary for City Bell
- The typical guest profile for Airbnb in City Bell consists of a mix of domestic (58%) and international guests, often arriving from nearby Buenos Aires, typically belonging to the Post-2000s (Gen Z/Alpha) group (50%), primarily speaking Spanish or English.
- Domestic travelers account for 58.3% of guests.
- Key international markets include Argentina (58.3%) and Spain (10.4%).
- Top languages spoken are Spanish (43.4%) followed by English (39.6%).
- A significant demographic segment is the Post-2000s (Gen Z/Alpha) group, representing 50% of guests.
Recommendations for Hosts
- Balance marketing efforts between domestic and international channels based on the guest mix.
- Tailor amenities and listing descriptions to appeal to the dominant Post-2000s (Gen Z/Alpha) demographic (e.g., highlight fast WiFi, smart home features, local guides).
- Highlight unique local experiences or amenities relevant to the primary guest profile.
- Consider seasonal promotions aligned with peak travel times for key origin markets.
Nearby Short-Term Rental Market Comparison
How does the City Bell Airbnb market stack up against its neighbors? Compare key performance metrics like average monthly revenue, ADR, and occupancy rates in surrounding areas to understand the broader regional STR landscape.
| Market | Active Properties | Monthly Revenue | Daily Rate | Avg. Occupancy |
|---|---|---|---|---|
| Colonia Esterella | 13 | $1,620 | $328.28 | 23% |
| Open Door | 12 | $1,533 | $211.34 | 27% |
| El Cazador | 25 | $1,285 | $174.20 | 33% |
| Luján | 49 | $1,278 | $152.81 | 36% |
| Don Torcuato | 14 | $1,272 | $205.31 | 35% |
| Lobos | 49 | $1,268 | $253.18 | 28% |
| General Pacheco | 13 | $1,250 | $196.50 | 35% |
| Carmelo | 40 | $1,230 | $172.77 | 27% |
| Manzanares | 18 | $1,227 | $216.77 | 30% |
| Exaltación de la Cruz | 32 | $1,124 | $181.17 | 32% |