Buenos Aires Airbnb Market Analysis 2026: Short Term Rental Data & Vacation Rental Statistics in Autonomous City of Buenos Aires, Argentina
Is Airbnb profitable in Buenos Aires in 2026? Explore comprehensive Airbnb analytics for Buenos Aires, Autonomous City of Buenos Aires, Argentina to uncover income potential. This 2026 STR market report for Buenos Aires, based on AirROI data from February 2025 to January 2026, reveals key trends in the bustling market of 23,283 active listings.
Whether you're considering an Airbnb investment in Buenos Aires, optimizing your existing vacation rental, or exploring rental arbitrage opportunities, understanding the Buenos Aires Airbnb data is crucial. Leveraging the low regulation environment is key to maximizing your short term rental income potential. Let's dive into the specifics.
Key Buenos Aires Airbnb Performance Metrics Overview
Monthly Airbnb Revenue Variations & Income Potential in Buenos Aires (2026)
Understanding the monthly revenue variations for Airbnb listings in Buenos Aires is key to maximizing your short term rental income potential. Seasonality significantly impacts earnings. Our analysis, based on data from the past 12 months, shows that the peak revenue month for STRs in Buenos Aires is typically November, while May often presents the lowest earnings, highlighting opportunities for strategic pricing adjustments during shoulder and low seasons. Explore the typical Airbnb income in Buenos Aires across different performance tiers:
- Best-in-class properties (Top 10%) achieve $1,913+ monthly, often utilizing dynamic pricing and superior guest experiences.
- Strong performing properties (Top 25%) earn $1,244 or more, indicating effective management and desirable locations/amenities.
- Typical properties (Median) generate around $815 per month, representing the average market performance.
- Entry-level properties (Bottom 25%) see earnings around $445, often with potential for optimization.
Average Monthly Airbnb Earnings Trend in Buenos Aires
Buenos Aires Airbnb Occupancy Rate Trends (2026)
Maximize your bookings by understanding the Buenos Aires STR occupancy trends. Seasonal demand shifts significantly influence how often properties are booked. Typically, Novembersees the highest demand (peak season occupancy), while January experiences the lowest (low season). Effective strategies, like adjusting minimum stays or offering promotions, can boost occupancy during slower periods. Here's how different property tiers perform in Buenos Aires:
- Best-in-class properties (Top 10%) achieve 90%+ occupancy, indicating high desirability and potentially optimized availability.
- Strong performing properties (Top 25%) maintain 78% or higher occupancy, suggesting good market fit and guest satisfaction.
- Typical properties (Median) have an occupancy rate around 56%.
- Entry-level properties (Bottom 25%) average 28% occupancy, potentially facing higher vacancy.
Average Monthly Occupancy Rate Trend in Buenos Aires
Average Daily Rate (ADR) Airbnb Trends in Buenos Aires (2026)
Effective short term rental pricing strategy in Buenos Aires involves understanding monthly ADR fluctuations. The Average Daily Rate (ADR) for Airbnb in Buenos Aires typically peaks in December and dips lowest during February. Leveraging Airbnb dynamic pricing tools or strategies based on this seasonality can significantly boost revenue. Here's a look at the typical nightly rates achieved:
- Best-in-class properties (Top 10%) command rates of $104+ per night, often due to premium features or locations.
- Strong performing properties (Top 25%) achieve nightly rates of $67 or more.
- Typical properties (Median) charge around $46 per night.
- Entry-level properties (Bottom 25%) earn around $35 per night.
Average Daily Rate (ADR) Trend by Month in Buenos Aires
Get Live Buenos Aires Market Intelligence 👇

Explore Real-time Analytics
Airbnb Seasonality Analysis & Trends in Buenos Aires (2026)
Peak Season (November, December, October)
- Revenue averages $1,276 per month
- Occupancy rates average 58.7%
- Daily rates average $70
Shoulder Season
- Revenue averages $1,001 per month
- Occupancy maintains around 52.9%
- Daily rates hold near $63
Low Season (February, May, June)
- Revenue drops to average $840 per month
- Occupancy decreases to average 48.7%
- Daily rates adjust to average $59
Seasonality Insights for Buenos Aires
- The Airbnb seasonality in Buenos Aires shows moderate seasonality with distinct peak and low periods. While the sections above show seasonal averages, it's also insightful to look at the extremes:
- During the high season, the absolute peak month showcases Buenos Aires's highest earning potential, with monthly revenues capable of climbing to $1,400, occupancy reaching a high of 63.7%, and ADRs peaking at $71.
- Conversely, the slowest single month of the year, typically falling within the low season, marks the market's lowest point. In this month, revenue might dip to $799, occupancy could drop to 44.3%, and ADRs may adjust down to $57.
- Understanding both the seasonal averages and these monthly peaks and troughs in revenue, occupancy, and ADR is crucial for maximizing your Airbnb profit potential in Buenos Aires.
Seasonal Strategies for Maximizing Profit
- Peak Season: Maximize revenue through premium pricing and potentially longer minimum stays. Ensure high availability.
- Low Season: Offer competitive pricing, special promotions (e.g., extended stay discounts), and flexible cancellation policies. Target off-season travelers like remote workers or budget-conscious guests.
- Shoulder Seasons: Implement dynamic pricing that balances peak and low rates. Target weekend travelers or specific events. Offer slightly more flexible terms than peak season.
- Regularly analyze your own performance against these Buenos Aires seasonality benchmarks and adjust your pricing and availability strategy accordingly.
Best Areas for Airbnb Investment in Buenos Aires (2026)
Exploring the top neighborhoods for short-term rentals in Buenos Aires? This section highlights key areas, outlining why they are attractive for hosts and guests, along with notable local attractions. Consider these locations based on your target guest profile and investment strategy.
| Neighborhood / Area | Why Host Here? (Target Guests & Appeal) | Key Attractions & Landmarks |
|---|---|---|
| Palermo | A trendy neighborhood known for its parks, nightlife, and cultural scene. Ideal for young travelers and locals looking for a vibrant atmosphere filled with cafes, restaurants, and boutiques. | Bosques de Palermo, Rosedal, Calle Serrano, Plaza Italia, Malba Museum |
| Recoleta | An upscale neighborhood famous for its European-style architecture, rich cultural history, and proximity to museums and parks. Recoleta is a favorite among affluent tourists and travelers who appreciate fine dining and elegance. | Recoleta Cemetery, Museo Nacional de Bellas Artes, El Ateneo Grand Splendid, Plaza Francia, Shopping Recoleta |
| San Telmo | A historic neighborhood recognized for its cobblestone streets, antique shops, and vibrant tango culture. Attracts those interested in a bohemian vibe and authentic Argentine experiences. | San Telmo Market, Plaza Dorrego, Barrio Historico, Tango shows, El Zanjón |
| Belgrano | A tranquil and residential area with green spaces, making it perfect for families and longer stays. Belgrano offers a more local experience while still being close to the city center. | Barrancas de Belgrano, Parque de la Memoria, Museo Sarmiento, Pavillon de las Rosas, Shopping Dot |
| Puerto Madero | A modern waterfront district known for its contemporary architecture and upscale dining. Puerto Madero is popular among business travelers and those looking for luxury accommodations. | Puente de la Mujer, Reserva Ecológica Costanera Sur, Faena Arts Center, Acuario de Buenos Aires, Museo de site |
| Microcentro | The bustling downtown area of Buenos Aires, close to key attractions, shopping, and business centers. Microcentro hosts a variety of international travelers and professionals. | Obelisco, Teatro Colón, Plaza de Mayo, Café Tortoni, Palacio Barolo |
| Los Abrojos | A charming neighborhood recognized for its picturesque streets and unique architecture, appealing to tourists looking for a less commercial experience. Offers a mix of local shops and restaurants. | Café de los Abrojos, El Jardín Japonés, Barrio Chino, Paseo El Rosedal, Plaza Evita |
| Villa Urquiza | A residential neighborhood that provides an authentic Buenos Aires experience away from the tourist crowds. Excellent for longer-term Airbnb rentals with local flair. | Plaza de Villa Urquiza, Parque Sarmiento, Centro Cultural 25 de Mayo, Cine Belgrano, Estadio Club Atlético All Boys |
Understanding Airbnb License Requirements & STR Laws in Buenos Aires (2026)
While Buenos Aires, Autonomous City of Buenos Aires, Argentina currently shows low STR regulations, specific Airbnb license requirements might still exist or change. Always verify the latest short term rental regulations and Airbnb license requirements directly with local government authorities for Buenos Aires to ensure full compliance before hosting.
(Source: AirROI data, 2026, based on 2% licensed listings)
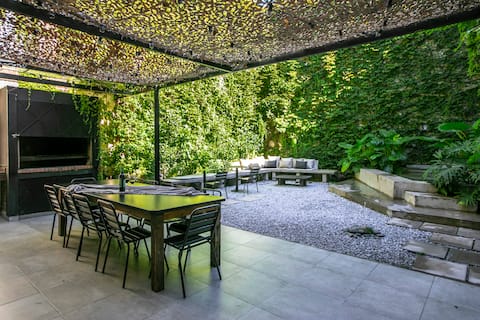
Top Performing Airbnb Properties in Buenos Aires (2026)
Benchmark your potential! Explore examples of top-performing Airbnb properties in Buenos Airesbased on Trailing Twelve Month (TTM) revenue. Analyze their characteristics, revenue, occupancy rate, and ADR to understand what drives success in this market.
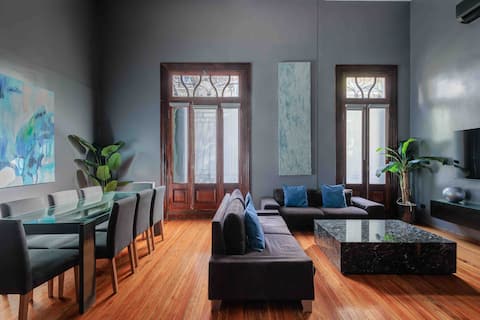
Palermo Soho Masterpiece designed for large groups
Entire Place • 7 bedrooms

MOT + Casa Chic - 8 Lux Units 30 pax
Entire Place • 8 bedrooms

Luxury mansion: Spa, Jacuzzi and Heated Pool
Entire Place • 4 bedrooms

Modern Luxury Home Perfect for Couples & Families
Entire Place • 4 bedrooms
Great house with garden ideal groups Palermo27 pax
Entire Place • 9 bedrooms

Modern Apartment in Palermo
Entire Place • N/A
Note: Performance varies based on location, size, amenities, seasonality, and management quality. Data reflects the past 12 months.
Top Performing Airbnb Hosts in Buenos Aires (2026)
Learn from the best! This table showcases top-performing Airbnb hosts in Buenos Aires based on the number of properties managed and estimated total revenue over the past year. Analyze their scale and performance metrics.
| Host Name | Properties | Grossing Revenue | Stay Reviews | Avg Rating |
|---|---|---|---|---|
| Mot | 194 | $3,992,677 | 8429 | 4.49/5.0 |
| Giorgina Y Angel | 109 | $3,050,827 | 5484 | 4.69/5.0 |
| HomelyJoy | 197 | $2,271,355 | 17342 | 4.76/5.0 |
| Diego | 71 | $1,749,381 | 3280 | 4.84/5.0 |
| Be Local | 81 | $1,265,194 | 8434 | 4.82/5.0 |
| Alejandro | 105 | $1,214,916 | 6376 | 4.78/5.0 |
| Federico | 94 | $1,175,170 | 5861 | 4.73/5.0 |
| Jean & Fernando | 80 | $1,163,462 | 8297 | 4.89/5.0 |
| Rodrigo | 63 | $938,321 | 1870 | 4.86/5.0 |
| Hestia Stays BA | 81 | $874,219 | 3904 | 4.66/5.0 |
Analyzing the strategies of top hosts, such as their property selection, pricing, and guest communication, can offer valuable lessons for optimizing your own Airbnb operations in Buenos Aires.
Dive Deeper: Advanced Buenos Aires STR Market Data (2026)
Ready to unlock more insights? AirROI provides access to advanced metrics and comprehensive Airbnb data for Buenos Aires. Explore detailed analytics beyond this report to refine your investment strategy, optimize pricing, and maximize your vacation rental profits.
Explore Advanced MetricsBuenos Aires Short-Term Rental Market Composition (2026): Property & Room Types
Room Type Distribution
Property Type Distribution
Market Composition Insights for Buenos Aires
- The Buenos Aires Airbnb market composition is heavily skewed towards Entire Home/Apt listings, which make up 94.1% of the 23,283 active rentals. This indicates strong guest preference for privacy and space.
- Looking at the property type distribution in Buenos Aires, Apartment/Condo properties are the most common (94.2%), reflecting the local real estate landscape.
- Smaller segments like house, hotel/boutique, others (combined 5.8%) offer potential for unique stay experiences.
Buenos Aires Airbnb Room Capacity Analysis (2026): Bedroom Distribution
Distribution of Listings by Number of Bedrooms
Room Capacity Insights for Buenos Aires
- The dominant room capacity in Buenos Aires is 1 bedroom listings, making up 61.7% of the market. This suggests a strong demand for properties suitable for couples or solo travelers.
- Together, 1 bedroom and 2 bedrooms properties represent 77.1% of the active Airbnb listings in Buenos Aires, indicating a high concentration in these sizes.
- With over half the market (61.7%) consisting of studios or 1-bedroom units, Buenos Aires is particularly well-suited for individuals or couples.
- Listings with 3+ bedrooms (5.3%) represent a smaller niche, potentially indicating an underserved market for larger group accommodations in Buenos Aires.
Buenos Aires Vacation Rental Guest Capacity Trends (2026)
Distribution of Listings by Guest Capacity
Guest Capacity Insights for Buenos Aires
- The most common guest capacity trend in Buenos Aires vacation rentals is listings accommodating 2 guests (45.3%). This suggests the primary traveler segment is likely couples or solo travelers.
- Properties designed for 2 guests and 4 guests dominate the Buenos Aires STR market, accounting for 67.0% of listings.
- A significant 46.1% of listings cater specifically to 1-2 guests, highlighting strong demand from couples and solo travelers in Buenos Aires.
- On average, properties in Buenos Aires are equipped to host 2.9 guests.
Buenos Aires Airbnb Booking Patterns (2026): Available vs. Booked Days
Available Days Distribution
Booked Days Distribution
Booking Pattern Insights for Buenos Aires
- The most common availability pattern in Buenos Aires falls within the 271-366 days range, representing 39.8% of listings. This suggests many properties have significant open periods on their calendars.
- Approximately 66.5% of listings show high availability (181+ days open annually), indicating potential for increased bookings or specific owner usage patterns.
- For booked days, the 91-180 days range is most frequent in Buenos Aires (26.9%), reflecting common guest stay durations or potential owner blocking patterns.
- A notable 34.7% of properties secure long booking periods (181+ days booked per year), highlighting successful long-term rental strategies or significant owner usage.
Buenos Aires Airbnb Minimum Stay Requirements Analysis
Distribution of Listings by Minimum Night Requirement
1 Night
4602 listings
19.8% of total
2 Nights
4718 listings
20.3% of total
3 Nights
3282 listings
14.1% of total
4-6 Nights
2540 listings
10.9% of total
7-29 Nights
1770 listings
7.6% of total
30+ Nights
6369 listings
27.4% of total
Key Insights
- The most prevalent minimum stay requirement in Buenos Aires is 30+ Nights, adopted by 27.4% of listings. This highlights the market's preference for longer commitments.
- A significant segment (27.4%) caters to monthly stays (30+ nights) in Buenos Aires, pointing to opportunities in the extended-stay market.
Recommendations
- Align with the market by considering a 30+ Nights minimum stay, as 27.4% of Buenos Aires hosts use this setting.
- If feasible, allowing 1-night stays, especially midweek or during low season, could capture last-minute bookings, as only 19.8% currently do.
- Explore offering discounts for stays of 30+ nights to attract the 27.4% of the market seeking extended stays.
- Adjust minimum nights based on seasonality – potentially shorter during low season and longer during peak demand periods in Buenos Aires.
Buenos Aires Airbnb Cancellation Policy Trends Analysis (2026)
Limited
789 listings
3.4% of total
Super Strict 60 Days
53 listings
0.2% of total
Super Strict 30 Days
31 listings
0.1% of total
Flexible
6693 listings
28.9% of total
Moderate
6631 listings
28.6% of total
Firm
7123 listings
30.7% of total
Strict
1861 listings
8% of total
Cancellation Policy Insights for Buenos Aires
- The prevailing Airbnb cancellation policy trend in Buenos Aires is Firm, used by 30.7% of listings.
- There's a relatively balanced mix between guest-friendly (57.5%) and stricter (38.7%) policies, offering choices for different guest needs.
- Strict cancellation policies are quite rare (8%), potentially making listings with this policy less competitive unless justified by high demand or property type.
Recommendations for Hosts
- Consider adopting a Firm policy to align with the 30.7% market standard in Buenos Aires.
- Using a Strict policy might deter some guests, as only 8% of listings use it. Evaluate if potential revenue protection outweighs possible lower booking rates.
- Regularly review your cancellation policy against competitors and market demand shifts in Buenos Aires.
Buenos Aires STR Booking Lead Time Analysis (2026)
Average Booking Lead Time by Month
Booking Lead Time Insights for Buenos Aires
- The overall average booking lead time for vacation rentals in Buenos Aires is 29 days.
- Guests book furthest in advance for stays during November (average 43 days), likely coinciding with peak travel demand or local events.
- The shortest booking windows occur for stays in June (average 20 days), indicating more last-minute travel plans during this time.
- Seasonally, Fall (36 days avg.) sees the longest lead times, while Spring (25 days avg.) has the shortest, reflecting typical travel planning cycles.
Recommendations for Hosts
- Use the overall average lead time (29 days) as a baseline for your pricing and availability strategy in Buenos Aires.
- For November stays, consider implementing length-of-stay discounts or slightly higher rates for bookings made less than 43 days out to capitalize on advance planning.
- Target marketing efforts for the Fall season well in advance (at least 36 days) to capture early planners.
- Monitor your own booking lead times against these Buenos Aires averages to identify opportunities for dynamic pricing adjustments.
Popular & Essential Airbnb Amenities in Buenos Aires (2026)
Amenity Prevalence
Amenity Insights for Buenos Aires
- Essential amenities in Buenos Aires that guests expect include: Wifi, Air conditioning. Lacking these (any) could significantly impact bookings.
- Popular amenities like Kitchen, TV, Hot water are common but not universal. Offering these can provide a competitive edge.
Recommendations for Hosts
- Ensure your listing includes all essential amenities for Buenos Aires: Wifi, Air conditioning.
- Prioritize adding missing essentials: Wifi, Air conditioning.
- Consider adding popular differentiators like Kitchen or TV to increase appeal.
- Highlight unique or less common amenities you offer (e.g., hot tub, dedicated workspace, EV charger) in your listing description and photos.
- Regularly check competitor amenities in Buenos Aires to stay competitive.
Buenos Aires Airbnb Guest Demographics & Profile Analysis (2026)
Guest Profile Summary for Buenos Aires
- The typical guest profile for Airbnb in Buenos Aires consists of a mix of domestic (35%) and international guests, with top international origins including United States, typically belonging to the Post-2000s (Gen Z/Alpha) group (50%), primarily speaking Spanish or English.
- Domestic travelers account for 35.1% of guests.
- Key international markets include Argentina (35.1%) and United States (12.9%).
- Top languages spoken are Spanish (37.9%) followed by English (36.4%).
- A significant demographic segment is the Post-2000s (Gen Z/Alpha) group, representing 50% of guests.
Recommendations for Hosts
- Focus marketing internationally, particularly towards travelers from United States.
- Offer listing details and communication support in Spanish.
- Tailor amenities and listing descriptions to appeal to the dominant Post-2000s (Gen Z/Alpha) demographic (e.g., highlight fast WiFi, smart home features, local guides).
- Highlight unique local experiences or amenities relevant to the primary guest profile.
- Consider seasonal promotions aligned with peak travel times for key origin markets.
Nearby Short-Term Rental Market Comparison
How does the Buenos Aires Airbnb market stack up against its neighbors? Compare key performance metrics like average monthly revenue, ADR, and occupancy rates in surrounding areas to understand the broader regional STR landscape.
| Market | Active Properties | Monthly Revenue | Daily Rate | Avg. Occupancy |
|---|---|---|---|---|
| Colonia Esterella | 13 | $1,620 | $328.28 | 23% |
| Open Door | 12 | $1,533 | $211.34 | 27% |
| El Cazador | 25 | $1,285 | $174.20 | 33% |
| Luján | 49 | $1,278 | $152.81 | 36% |
| Don Torcuato | 14 | $1,272 | $205.31 | 35% |
| Lobos | 49 | $1,268 | $253.18 | 28% |
| General Pacheco | 13 | $1,250 | $196.50 | 35% |
| Carmelo | 40 | $1,230 | $172.77 | 27% |
| Manzanares | 18 | $1,227 | $216.77 | 30% |
| Exaltación de la Cruz | 32 | $1,124 | $181.17 | 32% |