Chéraga Airbnb Market Analysis 2026: Short Term Rental Data & Vacation Rental Statistics in Algiers, Algeria
Is Airbnb profitable in Chéraga in 2026? Explore comprehensive Airbnb analytics for Chéraga, Algiers, Algeria to uncover income potential. This 2026 STR market report for Chéraga, based on AirROI data from February 2025 to January 2026, reveals key trends in the niche market of 56 active listings.
Whether you're considering an Airbnb investment in Chéraga, optimizing your existing vacation rental, or exploring rental arbitrage opportunities, understanding the Chéraga Airbnb data is crucial. Leveraging the low regulation environment is key to maximizing your short term rental income potential. Let's dive into the specifics.
Key Chéraga Airbnb Performance Metrics Overview
Monthly Airbnb Revenue Variations & Income Potential in Chéraga (2026)
Understanding the monthly revenue variations for Airbnb listings in Chéraga is key to maximizing your short term rental income potential. Seasonality significantly impacts earnings. Our analysis, based on data from the past 12 months, shows that the peak revenue month for STRs in Chéraga is typically July, while March often presents the lowest earnings, highlighting opportunities for strategic pricing adjustments during shoulder and low seasons. Explore the typical Airbnb income in Chéraga across different performance tiers:
- Best-in-class properties (Top 10%) achieve $2,084+ monthly, often utilizing dynamic pricing and superior guest experiences.
- Strong performing properties (Top 25%) earn $1,428 or more, indicating effective management and desirable locations/amenities.
- Typical properties (Median) generate around $838 per month, representing the average market performance.
- Entry-level properties (Bottom 25%) see earnings around $416, often with potential for optimization.
Average Monthly Airbnb Earnings Trend in Chéraga
Chéraga Airbnb Occupancy Rate Trends (2026)
Maximize your bookings by understanding the Chéraga STR occupancy trends. Seasonal demand shifts significantly influence how often properties are booked. Typically, Julysees the highest demand (peak season occupancy), while January experiences the lowest (low season). Effective strategies, like adjusting minimum stays or offering promotions, can boost occupancy during slower periods. Here's how different property tiers perform in Chéraga:
- Best-in-class properties (Top 10%) achieve 80%+ occupancy, indicating high desirability and potentially optimized availability.
- Strong performing properties (Top 25%) maintain 60% or higher occupancy, suggesting good market fit and guest satisfaction.
- Typical properties (Median) have an occupancy rate around 38%.
- Entry-level properties (Bottom 25%) average 19% occupancy, potentially facing higher vacancy.
Average Monthly Occupancy Rate Trend in Chéraga
Average Daily Rate (ADR) Airbnb Trends in Chéraga (2026)
Effective short term rental pricing strategy in Chéraga involves understanding monthly ADR fluctuations. The Average Daily Rate (ADR) for Airbnb in Chéraga typically peaks in September and dips lowest during March. Leveraging Airbnb dynamic pricing tools or strategies based on this seasonality can significantly boost revenue. Here's a look at the typical nightly rates achieved:
- Best-in-class properties (Top 10%) command rates of $141+ per night, often due to premium features or locations.
- Strong performing properties (Top 25%) achieve nightly rates of $86 or more.
- Typical properties (Median) charge around $69 per night.
- Entry-level properties (Bottom 25%) earn around $55 per night.
Average Daily Rate (ADR) Trend by Month in Chéraga
Get Live Chéraga Market Intelligence 👇

Explore Real-time Analytics
Airbnb Seasonality Analysis & Trends in Chéraga (2026)
Peak Season (July, August, September)
- Revenue averages $1,643 per month
- Occupancy rates average 51.7%
- Daily rates average $88
Shoulder Season
- Revenue averages $925 per month
- Occupancy maintains around 40.2%
- Daily rates hold near $84
Low Season (January, February, March)
- Revenue drops to average $653 per month
- Occupancy decreases to average 32.8%
- Daily rates adjust to average $81
Seasonality Insights for Chéraga
- The Airbnb seasonality in Chéraga shows highly seasonal trends requiring careful strategy. While the sections above show seasonal averages, it's also insightful to look at the extremes:
- During the high season, the absolute peak month showcases Chéraga's highest earning potential, with monthly revenues capable of climbing to $1,883, occupancy reaching a high of 55.9%, and ADRs peaking at $89.
- Conversely, the slowest single month of the year, typically falling within the low season, marks the market's lowest point. In this month, revenue might dip to $605, occupancy could drop to 26.7%, and ADRs may adjust down to $78.
- Understanding both the seasonal averages and these monthly peaks and troughs in revenue, occupancy, and ADR is crucial for maximizing your Airbnb profit potential in Chéraga.
Seasonal Strategies for Maximizing Profit
- Peak Season: Maximize revenue through premium pricing and potentially longer minimum stays. Ensure high availability.
- Low Season: Offer competitive pricing, special promotions (e.g., extended stay discounts), and flexible cancellation policies. Target off-season travelers like remote workers or budget-conscious guests.
- Shoulder Seasons: Implement dynamic pricing that balances peak and low rates. Target weekend travelers or specific events. Offer slightly more flexible terms than peak season.
- Regularly analyze your own performance against these Chéraga seasonality benchmarks and adjust your pricing and availability strategy accordingly.
Best Areas for Airbnb Investment in Chéraga (2026)
Exploring the top neighborhoods for short-term rentals in Chéraga? This section highlights key areas, outlining why they are attractive for hosts and guests, along with notable local attractions. Consider these locations based on your target guest profile and investment strategy.
| Neighborhood / Area | Why Host Here? (Target Guests & Appeal) | Key Attractions & Landmarks |
|---|---|---|
| Chéraga Central | The heart of Chéraga, offering easy access to local amenities, restaurants, and shops. A prime area for visitors seeking convenience and a local experience. | Local markets, Restaurants, Cafes, Parks, Public transportation |
| Chéraga Hills | A quiet residential area characterized by its scenic views and spacious properties. Ideal for families or groups looking for a peaceful retreat while still being close to the city. | Scenic viewpoints, Nature trails, Family-friendly parks, Local festivals |
| Chéraga Beach | A coastal area popular for its beach activities and waterfront dining. Excellent for those wanting a relaxed, beachside experience. | Beaches, Waterfront restaurants, Walking paths, Local seafood markets |
| Chéraga Cultural District | Rich in history and culture, this area showcases local architecture and community events. Great for cultural tourists and those interested in local traditions. | Museums, Cultural centers, Historical sites, Art galleries |
| Chéraga Gardens | Known for its lush greenery and parks, this area is perfect for nature lovers and travelers looking to relax in a tranquil environment. | Public gardens, Parks, Walking trails, Picnic areas |
| Chéraga Market Area | A bustling marketplace offering a taste of local life, food, and crafts. Attracts visitors looking for authentic experiences and souvenirs. | Local crafts, Food stalls, Weekly markets, Cultural events |
| Chéraga Promenade | The picturesque waterfront promenade is ideal for leisure walks and sunset views, appealing to both locals and tourists. | Walking paths, Seaside cafes, Outdoor events, Night markets |
| Chéraga Nightlife Zone | A lively area full of bars and nightclubs, ideal for young travelers looking to enjoy the nightlife in Chéraga. | Bars, Clubs, Live music venues, Restaurants |
Understanding Airbnb License Requirements & STR Laws in Chéraga (2026)
While Chéraga, Algiers, Algeria currently shows low STR regulations, specific Airbnb license requirements might still exist or change. Always verify the latest short term rental regulations and Airbnb license requirements directly with local government authorities for Chéraga to ensure full compliance before hosting.
(Source: AirROI data, 2026, finding no licensed listings among those analyzed)
Top Performing Airbnb Properties in Chéraga (2026)
Benchmark your potential! Explore examples of top-performing Airbnb properties in Chéragabased on Trailing Twelve Month (TTM) revenue. Analyze their characteristics, revenue, occupancy rate, and ADR to understand what drives success in this market.

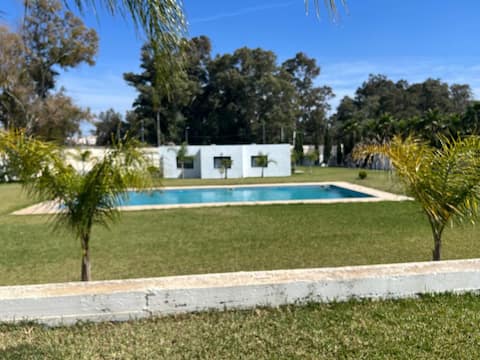
Villa with pool, garage and sea view.
Entire Place • 4 bedrooms
Bouchaoui gazebo
Entire Place • 4 bedrooms
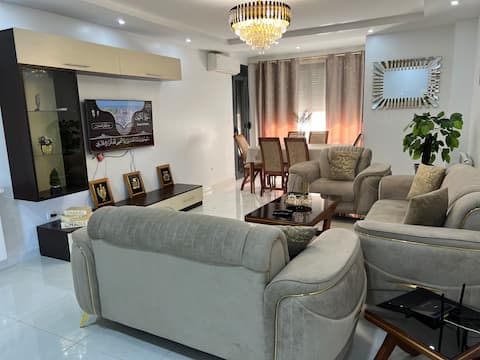
Beautiful and luxurious apartment (F4) (Cheraga)
Entire Place • 3 bedrooms
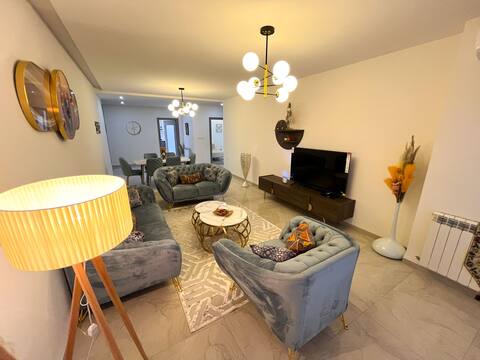
Elegance and Absolute Comfort
Entire Place • 4 bedrooms
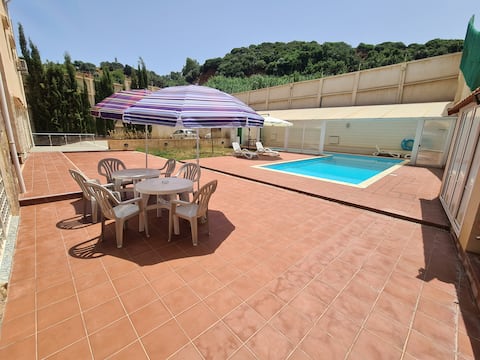
5* Villa rental with pool
Entire Place • 3 bedrooms

Apartment le garden
Entire Place • 2 bedrooms
Note: Performance varies based on location, size, amenities, seasonality, and management quality. Data reflects the past 12 months.
Top Performing Airbnb Hosts in Chéraga (2026)
Learn from the best! This table showcases top-performing Airbnb hosts in Chéraga based on the number of properties managed and estimated total revenue over the past year. Analyze their scale and performance metrics.
| Host Name | Properties | Grossing Revenue | Stay Reviews | Avg Rating |
|---|---|---|---|---|
| Amir | 2 | $32,959 | 43 | 4.86/5.0 |
| Hocine | 1 | $31,261 | 13 | 4.69/5.0 |
| Bibeh | 2 | $30,246 | 148 | 4.97/5.0 |
| Amine | 1 | $28,743 | 23 | 4.74/5.0 |
| Imad | 2 | $28,194 | 45 | 5.00/5.0 |
| Nasreddine | 2 | $27,788 | 218 | 4.90/5.0 |
| Dalila | 2 | $23,097 | 88 | 4.71/5.0 |
| Mounir | 2 | $21,936 | 82 | 4.65/5.0 |
| Cherif | 1 | $17,167 | 2 | Not Rated |
| Mehdi | 1 | $16,604 | 10 | 5.00/5.0 |
Analyzing the strategies of top hosts, such as their property selection, pricing, and guest communication, can offer valuable lessons for optimizing your own Airbnb operations in Chéraga.
Dive Deeper: Advanced Chéraga STR Market Data (2026)
Ready to unlock more insights? AirROI provides access to advanced metrics and comprehensive Airbnb data for Chéraga. Explore detailed analytics beyond this report to refine your investment strategy, optimize pricing, and maximize your vacation rental profits.
Explore Advanced MetricsChéraga Short-Term Rental Market Composition (2026): Property & Room Types
Room Type Distribution
Property Type Distribution
Market Composition Insights for Chéraga
- The Chéraga Airbnb market composition is heavily skewed towards Entire Home/Apt listings, which make up 98.2% of the 56 active rentals. This indicates strong guest preference for privacy and space.
- Looking at the property type distribution in Chéraga, Apartment/Condo properties are the most common (89.3%), reflecting the local real estate landscape.
- Smaller segments like hotel/boutique (combined 3.6%) offer potential for unique stay experiences.
Chéraga Airbnb Room Capacity Analysis (2026): Bedroom Distribution
Distribution of Listings by Number of Bedrooms
Room Capacity Insights for Chéraga
- The dominant room capacity in Chéraga is 2 bedrooms listings, making up 50% of the market. This suggests a strong demand for properties suitable for couples or solo travelers.
- Together, 2 bedrooms and 3 bedrooms properties represent 71.4% of the active Airbnb listings in Chéraga, indicating a high concentration in these sizes.
- A significant 26.8% of listings offer 3+ bedrooms, catering to larger groups and families seeking more space in Chéraga.
Chéraga Vacation Rental Guest Capacity Trends (2026)
Distribution of Listings by Guest Capacity
Guest Capacity Insights for Chéraga
- The most common guest capacity trend in Chéraga vacation rentals is listings accommodating 4 guests (26.8%). This suggests the primary traveler segment is likely small families or groups.
- Properties designed for 4 guests and 5 guests dominate the Chéraga STR market, accounting for 48.2% of listings.
- 28.7% of properties accommodate 6+ guests, serving the market segment for larger families or group travel in Chéraga.
- On average, properties in Chéraga are equipped to host 4.5 guests.
Chéraga Airbnb Booking Patterns (2026): Available vs. Booked Days
Available Days Distribution
Booked Days Distribution
Booking Pattern Insights for Chéraga
- The most common availability pattern in Chéraga falls within the 271-366 days range, representing 50% of listings. This suggests many properties have significant open periods on their calendars.
- Approximately 87.5% of listings show high availability (181+ days open annually), indicating potential for increased bookings or specific owner usage patterns.
- For booked days, the 1-30 days range is most frequent in Chéraga (33.9%), reflecting common guest stay durations or potential owner blocking patterns.
- A notable 16.1% of properties secure long booking periods (181+ days booked per year), highlighting successful long-term rental strategies or significant owner usage.
Chéraga Airbnb Minimum Stay Requirements Analysis
Distribution of Listings by Minimum Night Requirement
1 Night
17 listings
30.4% of total
2 Nights
11 listings
19.6% of total
3 Nights
7 listings
12.5% of total
4-6 Nights
3 listings
5.4% of total
7-29 Nights
1 listings
1.8% of total
30+ Nights
17 listings
30.4% of total
Key Insights
- The most prevalent minimum stay requirement in Chéraga is 1 Night, adopted by 30.4% of listings. This highlights the market's preference for shorter, flexible bookings.
- A significant segment (30.4%) caters to monthly stays (30+ nights) in Chéraga, pointing to opportunities in the extended-stay market.
Recommendations
- Align with the market by considering a 1 Night minimum stay, as 30.4% of Chéraga hosts use this setting.
- Explore offering discounts for stays of 30+ nights to attract the 30.4% of the market seeking extended stays.
- Adjust minimum nights based on seasonality – potentially shorter during low season and longer during peak demand periods in Chéraga.
Chéraga Airbnb Cancellation Policy Trends Analysis (2026)
Limited
3 listings
5.4% of total
Flexible
30 listings
53.6% of total
Moderate
16 listings
28.6% of total
Firm
7 listings
12.5% of total
Cancellation Policy Insights for Chéraga
- The prevailing Airbnb cancellation policy trend in Chéraga is Flexible, used by 53.6% of listings.
- The market strongly favors guest-friendly terms, with 82.2% of listings offering Flexible or Moderate policies. This suggests guests in Chéraga may expect booking flexibility.
Recommendations for Hosts
- Consider adopting a Flexible policy to align with the 53.6% market standard in Chéraga.
- Given the high prevalence of Flexible policies (53.6%), offering this can enhance booking appeal, especially during shoulder seasons.
- Regularly review your cancellation policy against competitors and market demand shifts in Chéraga.
Chéraga STR Booking Lead Time Analysis (2026)
Average Booking Lead Time by Month
Booking Lead Time Insights for Chéraga
- The overall average booking lead time for vacation rentals in Chéraga is 23 days.
- Guests book furthest in advance for stays during August (average 55 days), likely coinciding with peak travel demand or local events.
- The shortest booking windows occur for stays in January (average 7 days), indicating more last-minute travel plans during this time.
- Seasonally, Summer (39 days avg.) sees the longest lead times, while Winter (11 days avg.) has the shortest, reflecting typical travel planning cycles.
Recommendations for Hosts
- Use the overall average lead time (23 days) as a baseline for your pricing and availability strategy in Chéraga.
- For August stays, consider implementing length-of-stay discounts or slightly higher rates for bookings made less than 55 days out to capitalize on advance planning.
- During January, focus on last-minute booking availability and promotions, as guests book with very short notice (7 days avg.).
- Target marketing efforts for the Summer season well in advance (at least 39 days) to capture early planners.
- Monitor your own booking lead times against these Chéraga averages to identify opportunities for dynamic pricing adjustments.
Popular & Essential Airbnb Amenities in Chéraga (2026)
Amenity Prevalence
Amenity Insights for Chéraga
- Essential amenities in Chéraga that guests expect include: Air conditioning, Washer, Kitchen. Lacking these (any) could significantly impact bookings.
- Popular amenities like Wifi, TV, Free parking on premises are common but not universal. Offering these can provide a competitive edge.
- Warning: Wifi is not universally provided but is considered essential globally. Ensure reliable Wifi is offered.
Recommendations for Hosts
- Ensure your listing includes all essential amenities for Chéraga: Air conditioning, Washer, Kitchen.
- Prioritize adding missing essentials: Washer, Kitchen.
- Consider adding popular differentiators like Wifi or TV to increase appeal.
- Highlight unique or less common amenities you offer (e.g., hot tub, dedicated workspace, EV charger) in your listing description and photos.
- Regularly check competitor amenities in Chéraga to stay competitive.
Chéraga Airbnb Guest Demographics & Profile Analysis (2026)
Guest Profile Summary for Chéraga
- The typical guest profile for Airbnb in Chéraga consists of predominantly international visitors (94%), with top international origins including Algeria, typically belonging to the Post-2000s (Gen Z/Alpha) group (50%), primarily speaking French or English.
- Domestic travelers account for 6.3% of guests.
- Key international markets include France (78.5%) and Algeria (6.3%).
- Top languages spoken are French (35.8%) followed by English (32.5%).
- A significant demographic segment is the Post-2000s (Gen Z/Alpha) group, representing 50% of guests.
Recommendations for Hosts
- Focus marketing internationally, particularly towards travelers from Algeria.
- Offer listing details and communication support in French.
- Tailor amenities and listing descriptions to appeal to the dominant Post-2000s (Gen Z/Alpha) demographic (e.g., highlight fast WiFi, smart home features, local guides).
- Highlight unique local experiences or amenities relevant to the primary guest profile.
- Consider seasonal promotions aligned with peak travel times for key origin markets.
Nearby Short-Term Rental Market Comparison
How does the Chéraga Airbnb market stack up against its neighbors? Compare key performance metrics like average monthly revenue, ADR, and occupancy rates in surrounding areas to understand the broader regional STR landscape.
| Market | Active Properties | Monthly Revenue | Daily Rate | Avg. Occupancy |
|---|---|---|---|---|
| Alger-Centre | 88 | $929 | $69.13 | 51% |
| Hydra | 74 | $895 | $85.45 | 44% |
| Sidi M'Hamed | 31 | $879 | $68.58 | 49% |
| Ouled Moussa | 25 | $811 | $83.90 | 40% |
| Staoueli | 28 | $741 | $89.25 | 35% |
| Ain Benian | 17 | $728 | $95.89 | 36% |
| Birkhadem | 36 | $699 | $95.26 | 35% |
| El Mouradia | 28 | $677 | $64.03 | 50% |
| Ben Aknoun | 16 | $631 | $84.04 | 31% |
| Alger Centre | 13 | $626 | $66.60 | 44% |