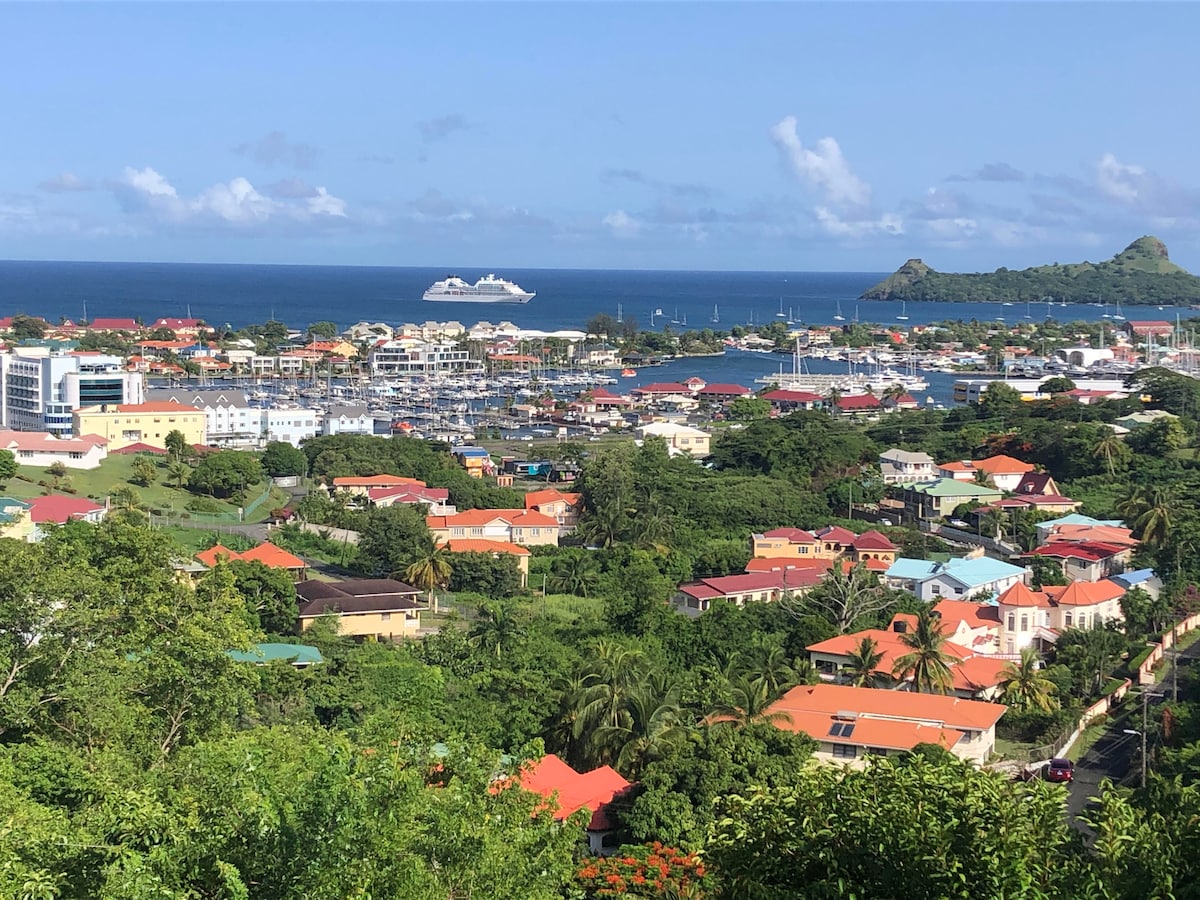
Airbnb Market Analytics, Statistics and Data in Beausejour, Gros Islet, St. Lucia
Last updated: 2025-01-31
Looking to make more money with hosting or rental arbitraging Airbnbs, short-term rentals, vacation rentals in Beausejour? AirROI have just the data insights! Over the last twelve months from February 2024 to January 2025, we've uncovered key trends and opportunities that successful hosts are leveraging in Beausejour:
How much do Airbnb hosts make on average per month in Beausejour?
The short-term rental market in Beausejour shows distinct revenue patterns across different property tiers. Our analysis reveals that successful properties combine strategic pricing with quality management to maximize earnings potential. Market data demonstrates clear revenue differentiation among properties:
- Typical properties (median) earn $1,496 per month
- Strong performing properties (top 25%) make $2,651 or more
- Best-in-class properties (top 10%) achieve $5,556+ monthly
- Entry-level properties (bottom 25%) typically earn around $756
Revenue Variations by Month
Occupancy Rates Throughout the Year in Beausejour
The market in Beausejour shows distinct occupancy patterns influenced by seasonal trends and local dynamics. Properties that maintain high guest satisfaction scores and implement strategic pricing consistently achieve stronger occupancy rates. Current market data shows:
- Typical properties (median) maintain 39% occupancy rates
- Strong performing properties (top 25%) achieve 66% or higher
- Best-in-class properties (top 10%) reach 85%+occupancy
- Entry-level properties (bottom 25%) average around 19%
Occupancy Variations by Month
Average Daily Rates Seasonal Trends in Beausejour
Daily rates in Beausejour vary based on seasonality, property quality, and market dynamics. Properties that effectively balance competitive pricing with strong amenities typically command higher rates. Market analysis shows the following rate structure:
- Typical properties (median) generate $104 per night
- Strong performing properties (top 25%) secure $159 or more
- Best-in-class properties (top 10%) pull in $286+ per night
- Entry-level properties (bottom 25%) earn around $78
Daily Rate Variations by Month
Get Live Beausejour Market Intelligence 👇

Explore Real-time Analytics
Seasonality patterns in Beausejour
Peak Season (April, May, March)
- Revenue peaks at $2739.92 per month
- Occupancy rates reach 50.36%
- Daily rates average $156.04
Shoulder Season
- Revenue averages $2308.09 per month
- Occupancy maintains 43.89%
- Daily rates hold at $146.03
Low Season (October, November, September)
- Revenue drops to $1669.54 per month
- Occupancy decreases to 37.62%
- Daily rates adjust to $142.85
Is it still profitable to do Airbnb in Beausejour in 2025?
Yes! Beausejour demonstrates moderate seasonality with good off-peak opportunities, featuring a growing occupancy rate of 44% and solid monthly revenue averaging $2308 and The market's 129 active listings indicate growing demand with plenty of opportunity for new properties. There's also room for profit through rental arbitrage strategies, if you can identify competitively priced properties. To maximize your return on investment, consider employing the following strategies:
Peak Season Strategy
- Implement premium seasonal pricing strategies
- Set longer minimum stay requirements during high-demand periods
- Enforce stricter cancellation policies
Shoulder Season Strategy
- Maintain competitive market-based pricing
- Offer moderate-length stay incentives
- Target a mix of leisure and business travelers with flexible booking terms
- Focus on weekend getaway packages and mid-week business traveler promotions
Low Season Strategy
- Adjust pricing to remain competitive in the market
- Target different guest segments (leaf-peepers, wine tourists, cultural festival attendees, solo travelers)
- Create targeted promotional campaigns to drive occupancy
Top Places to Start Airbnb in Beausejour
| Area | Why Choose This Area | Key Attractions |
|---|---|---|
| Rodney Bay | A bustling area known for its beautiful beach, vibrant nightlife, and numerous dining and shopping options. It attracts both tourists and locals, making it a desirable destination for Airbnb hosts. | Pigeon Island National Park, Reduit Beach, Baywalk Mall, Cas en Bas Beach, Rodney Bay Marina |
| Gros Islet | Famous for its Friday night street party and close proximity to stunning beaches and resorts. A great place for visitors who want to experience local culture and beach life. | Gros Islet Street Party, Pigeon Island National Park, Windward Islands Yacht Charters, Rodney Bay, Derek Walcott Square |
| Marigot Bay | Known for its picturesque bay and luxury villas, Marigot Bay is a slice of paradise that attracts tourists seeking tranquility and stunning views. | Marigot Bay, Rainforest Adventures, Diving and snorkeling spots, Local restaurants overlooking the bay |
| Cap Estate | This upscale residential area features luxury villas, golf courses, and stunning ocean views. It's appealing for high-end travelers looking for a lavish stay. | Sandals Golf and Country Club, Cap Estate Beach, The Smugglers Cove Beach |
| Anse La Raye | A beautiful fishing village with stunning coastal views and a quiet atmosphere, perfect for visitors wanting a more local, authentic experience away from busy tourist spots. | Anse La Raye Beach, Local fish fry events, Hiking trails with ocean views |
| Soufrière | Famous for its stunning natural beauty, including the Pitons and Sulphur Springs. It attracts eco-tourists and those looking to explore St. Lucia's lush landscapes. | The Pitons, Sulphur Springs, Diamond Falls, Toraille Waterfall, Jalousie Beach |
| Castries | The capital city offering cultural experiences, local markets, and historical sites. An ideal base for visitors who want to explore the island. | Castries Market, Immaculate Conception Cathedral, Derek Walcott Square, The Cathedral of the Assumption |
| Vigie | A residential area close to the airport with beautiful beaches, perfect for travelers who want convenience and easy access to local attractions. | Vigie Beach, Fort Charlotte, Ciceron Beach |
Do you need a license for Airbnb in Beausejour?
We recommend checking directly with Beausejour's local government regarding short-term rental licensing requirements. Current market data shows limited licensing information (0% of listings), making it essential to verify current regulations before starting your Airbnb business.
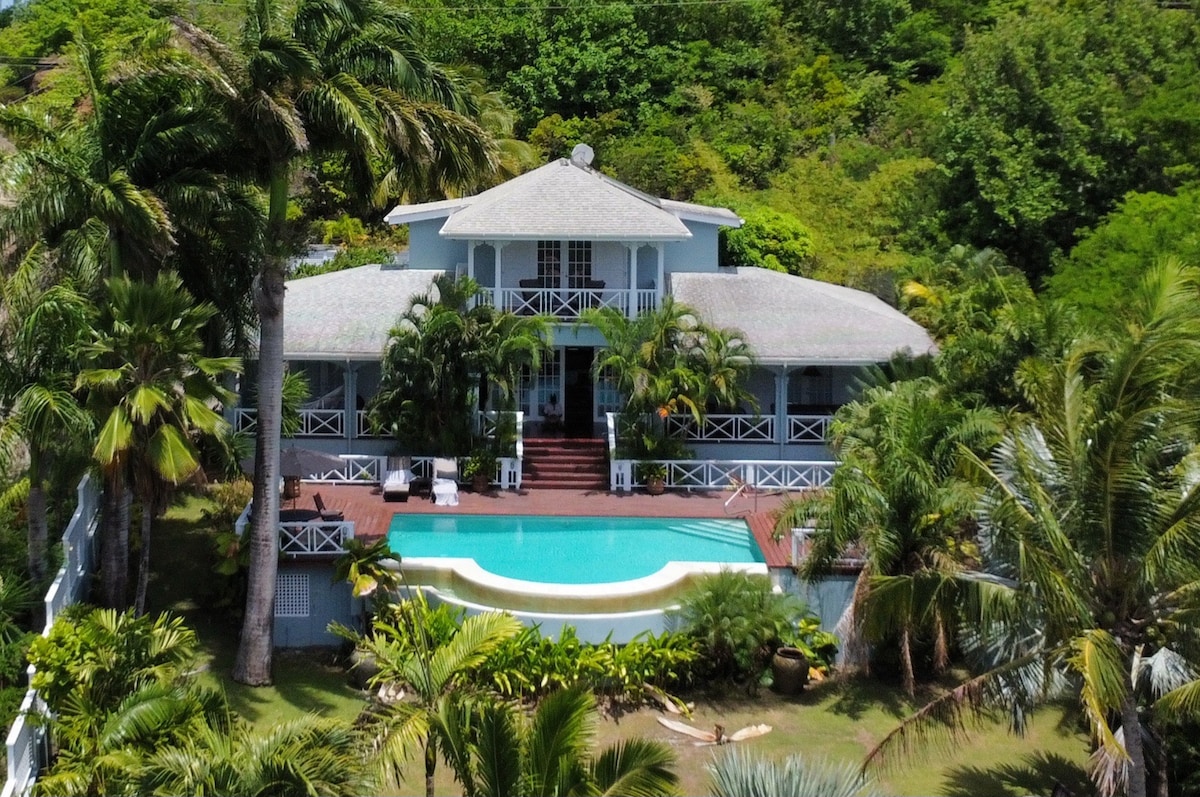
Top Performing Airbnb Properties in Beausejour

Entire house, private pool, spectacular sea views
Entire Place • 6 bedrooms

Calypso Court - 3 bdrm Ocean view Villa
Entire Place • 3 bedrooms

Sunset Bliss Villa
Entire Place • 3 bedrooms
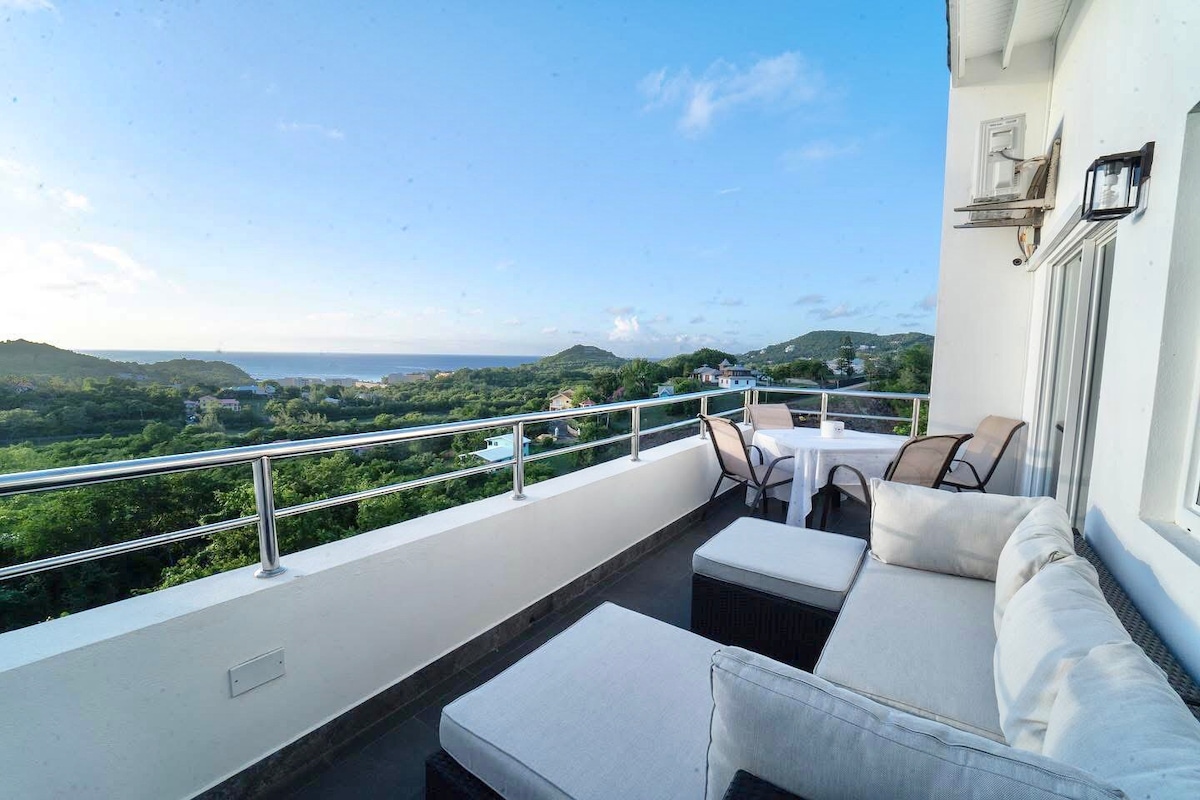
Peaceful 4BR Villa w/ Panoramic Ocean Views
Entire Place • 4 bedrooms
Beautiful Caribbean style 2-bed family Villa Kessi
Entire Place • 2 bedrooms
Bon Esprit Villas #10
Entire Place • 3 bedrooms
Top Performing Professional Hosts in Beausejour
| Host Name | Properties | Grossing Revenue | Stay Reviews | Avg Rating |
|---|---|---|---|---|
| Dirk | 4 | $239,885 | 141 | 4.89/5.0 |
| Blue Sky Luxury St. Lucia | 2 | $166,923 | 24 | 4.88/5.0 |
| Gregory | 6 | $135,644 | 66 | 4.01/5.0 |
| Karen | 3 | $111,944 | 150 | 4.88/5.0 |
| Wilbertha | 2 | $95,492 | 33 | 4.86/5.0 |
| Tracey | 1 | $84,150 | 34 | 4.91/5.0 |
| Gale | 1 | $77,353 | 30 | 4.87/5.0 |
| 429112100 | 1 | $74,507 | 0 | 0.00/5.0 |
| Walid | 3 | $74,127 | 5 | 1.58/5.0 |
| Tricia | 1 | $70,175 | 33 | 5.00/5.0 |
Additional analytics on vacation rental, real estate, short term rental data in Beausejour
AirROI also have other key metrics and comprehensive data for your vacation rental, real estate needs. Go explore the advanced metrics that can help you make informed decisions:
Room Type Distribution
Property Type Distribution
Key Insights
- Market dominated by entire home listings (93.8%), with apartment & condo and house properties comprising 93.0% of inventory
- Untapped potential in others, boutique & hotels, unique stays, outdoor & mobile segments (7.1% combined)
Room Capacity Distribution
Analysis of 129 properties in Beausejour shows that 2 bedrooms properties are most prevalent, making up 48.8% of the market. The market tends to favor smaller properties, with 2 bedrooms and 1 bedroom together representing 79.1% of all listings.
Key Insights
- Most common: 2 bedrooms (48.8%)
- Least common: 5+ bedrooms (1.6%)
- Market concentration: 79.1% in top 2 sizes
- Market skew: Favors smaller properties
Guest Capacity Distribution
Analysis of 129 properties in Beausejour reveals that 4 guests properties dominate the market, representing 36.4% of all listings. The average property accommodates 4.0 guests, with a clear trend towards larger guest capacities. Properties accommodating 4 guests and 2 guests make up 68.2% of the market.
Key Insights
- Most common capacity: 4 guests (36.4% of market)
- Least common capacity: 1 guest (0.8% of market)
- Average guest capacity: 4.0 guests per property
- Market concentration: 68.2% in top 2 capacity sizes
- Market segmentation: Predominantly larger guest capacities
Booking and Availability Patterns
Available Days Distribution
Booked Days Distribution
Among 129 properties in Beausejour, the most common availability pattern is 271-366 days (52.7% of properties). For actual bookings, properties most frequently secure bookings for 1-30 days (30.2% of properties).
Key Insights
- Most common availability window: 271-366 days (52.7%)
- Most common booking duration: 1-30 days (30.2%)
- Properties with high availability (180+ days): 75.2%
- Properties with long-term bookings (180+ days): 26.4%
Minimum Stay Distributions
1 Night
20 listings
16.4% of total
2 Nights
46 listings
37.7% of total
3 Nights
36 listings
29.5% of total
4-6 Nights
13 listings
10.7% of total
7-29 Nights
2 listings
1.6% of total
30+ Nights
5 listings
4.1% of total
Key Insights
- Short stays (1-2 nights) dominate the market at 54.1%
- Mid-length stays (4-6 nights) represent 10.7% of listings
- Monthly+ stays (4.1%) suggest a stable extended-stay market
- High market flexibility with 83.6% accepting 3 nights or less
Recommendations
- Set minimum stays between 2-3 nights to align with market standards
- Adjust minimum stays seasonally based on demand patterns
- Implement different minimum stays for weekends vs. weekdays
Cancellation Policy Distribution
Super Strict 30 Days
2 listings
2% of total
Flexible
31 listings
31% of total
Moderate
29 listings
29% of total
Firm
19 listings
19% of total
Strict
19 listings
19% of total
Key Insights
- Flexible is the preferred policy at 31.0% of listings
- The market shows a balanced distribution between guest-friendly (60.0%) and strict (38.0%) policies
- Strong market consensus around Flexible policies
- Super Strict 30 Days policies are least common at 2.0% of listings
Recommendations
- Market supports various policies - choose based on your property type and target guests
- Strong market preference for Flexible policies suggests this should be your baseline
- Consider generous cancellation terms as a competitive advantage
Booking Lead Time Trends
Key Insights
- Peak booking lead times occur in Jul, Jan, Jun, averaging 78 days
- Shortest booking windows are in Feb, Aug, Sep, averaging 42 days
- Summer shows the longest average booking window at 68 days, while Fall has the shortest at 49 days
Recommendations
- Implement dynamic pricing strategies for Summer bookings at least 68 days in advance
- Consider early bird discounts during Fall to encourage longer lead times
- Focus on last-minute booking promotions during Feb-Sep when lead times are shortest
Popular Airbnb Amenities in Beausejour
Every property in Beausejour comes standard with Wifi, and Kitchen. Below shows the distribution of other amenities:
Traveler Demographics
Key Insights
- Domestic travelers make up 0% of total guests, indicating a mostly international-driven market.
- Primary international markets: United Kingdom (20.6%) and Canada (18.8%)
- English is the top language at 62.3%, followed by French (19.2%)
- Notable demographic segment in <=1950s (Pre-1950s (Silent Gen)) at 5.4%
Recommendations
- Target marketing campaigns for New York and London markets
- Develop localized content for United Kingdom and Canada
- Prioritize English and French language support
- Tailor experiences for Pre-1950s (Silent Gen) while maintaining broad age appeal
- Implement seasonal promotions aligned with key market travel patterns
Nearby Markets
Explore short-term rental performance in markets surrounding Beausejour. These nearby markets offer diverse opportunities for property investors and hosts:
| Market | Properties | Monthly Revenue | Daily Rate | Occupancy |
|---|---|---|---|---|
| Clinketts | 14 | $4,567 | $388.78 | 50% |
| Prospect | 32 | $4,289 | $410.74 | 45% |
| Rock Dundo | 19 | $4,025 | $499.61 | 44% |
| Soufrière | 91 | $3,796 | $267.19 | 49% |
| Coolie Town | 86 | $3,662 | $407.03 | 45% |
| Gibbes | 17 | $3,579 | $439.79 | 48% |
| Belair | 25 | $3,531 | $376.26 | 37% |
| Paynes Bay Beach | 28 | $3,514 | $688.04 | 39% |
| Holders Hill | 10 | $3,506 | $481.60 | 35% |
| Mullins | 47 | $3,354 | $671.57 | 44% |
How is your STR performing?
Your vacation rental may be amazing, but is it better than your competition? Enjoy the best-in-class AI-powered analytics for free!
Discover Insights