Delkanda Airbnb Market Analysis 2025: Short Term Rental Data & Vacation Rental Statistics in Western Province, Sri Lanka
Is Airbnb profitable in Delkanda in 2025? Explore comprehensive Airbnb analytics for Delkanda, Western Province, Sri Lanka to uncover income potential. This 2025 STR market report for Delkanda, based on AirROI data from June 2024 to May 2025, reveals key trends in the niche market of 20 active listings.
Whether you're considering an Airbnb investment in Delkanda, optimizing your existing vacation rental, or exploring rental arbitrage opportunities, understanding the Delkanda Airbnb data is crucial. Leveraging the low regulation environment is key to maximizing your short term rental income potential. Let's dive into the specifics.
Key Delkanda Airbnb Performance Metrics Overview
Monthly Airbnb Revenue Variations & Income Potential in Delkanda (2025)
Understanding the monthly revenue variations for Airbnb listings in Delkanda is key to maximizing your short term rental income potential. Seasonality significantly impacts earnings. Our analysis, based on data from the past 12 months, shows that the peak revenue month for STRs in Delkanda is typically March, while May often presents the lowest earnings, highlighting opportunities for strategic pricing adjustments during shoulder and low seasons. Explore the typical Airbnb income in Delkanda across different performance tiers:
- Best-in-class properties (Top 10%) achieve $819+ monthly, often utilizing dynamic pricing and superior guest experiences.
- Strong performing properties (Top 25%) earn $579 or more, indicating effective management and desirable locations/amenities.
- Typical properties (Median) generate around $377 per month, representing the average market performance.
- Entry-level properties (Bottom 25%) see earnings around $180, often with potential for optimization.
Average Monthly Airbnb Earnings Trend in Delkanda
Delkanda Airbnb Occupancy Rate Trends (2025)
Maximize your bookings by understanding the Delkanda STR occupancy trends. Seasonal demand shifts significantly influence how often properties are booked. Typically, Marchsees the highest demand (peak season occupancy), while September experiences the lowest (low season). Effective strategies, like adjusting minimum stays or offering promotions, can boost occupancy during slower periods. Here's how different property tiers perform in Delkanda:
- Best-in-class properties (Top 10%) achieve 66%+ occupancy, indicating high desirability and potentially optimized availability.
- Strong performing properties (Top 25%) maintain 48% or higher occupancy, suggesting good market fit and guest satisfaction.
- Typical properties (Median) have an occupancy rate around 27%.
- Entry-level properties (Bottom 25%) average 14% occupancy, potentially facing higher vacancy.
Average Monthly Occupancy Rate Trend in Delkanda
Average Daily Rate (ADR) Airbnb Trends in Delkanda (2025)
Effective short term rental pricing strategy in Delkanda involves understanding monthly ADR fluctuations. The Average Daily Rate (ADR) for Airbnb in Delkanda typically peaks in May and dips lowest during June. Leveraging Airbnb dynamic pricing tools or strategies based on this seasonality can significantly boost revenue. Here's a look at the typical nightly rates achieved:
- Best-in-class properties (Top 10%) command rates of $68+ per night, often due to premium features or locations.
- Strong performing properties (Top 25%) achieve nightly rates of $49 or more.
- Typical properties (Median) charge around $37 per night.
- Entry-level properties (Bottom 25%) earn around $23 per night.
Average Daily Rate (ADR) Trend by Month in Delkanda
Get Live Delkanda Market Intelligence 👇

Explore Real-time Analytics
Airbnb Seasonality Analysis & Trends in Delkanda (2025)
Peak Season (March, July, August)
- Revenue averages $519 per month
- Occupancy rates average 40.4%
- Daily rates average $42
Shoulder Season
- Revenue averages $444 per month
- Occupancy maintains around 31.8%
- Daily rates hold near $42
Low Season (April, May, October)
- Revenue drops to average $381 per month
- Occupancy decreases to average 25.5%
- Daily rates adjust to average $45
Seasonality Insights for Delkanda
- The Airbnb seasonality in Delkanda shows moderate seasonality with distinct peak and low periods. While the sections above show seasonal averages, it's also insightful to look at the extremes:
- During the high season, the absolute peak month showcases Delkanda's highest earning potential, with monthly revenues capable of climbing to $575, occupancy reaching a high of 44.0%, and ADRs peaking at $47.
- Conversely, the slowest single month of the year, typically falling within the low season, marks the market's lowest point. In this month, revenue might dip to $363, occupancy could drop to 18.0%, and ADRs may adjust down to $40.
- Understanding both the seasonal averages and these monthly peaks and troughs in revenue, occupancy, and ADR is crucial for maximizing your Airbnb profit potential in Delkanda.
Seasonal Strategies for Maximizing Profit
- Peak Season: Maximize revenue through premium pricing and potentially longer minimum stays. Ensure high availability.
- Low Season: Offer competitive pricing, special promotions (e.g., extended stay discounts), and flexible cancellation policies. Target off-season travelers like remote workers or budget-conscious guests.
- Shoulder Seasons: Implement dynamic pricing that balances peak and low rates. Target weekend travelers or specific events. Offer slightly more flexible terms than peak season.
- Regularly analyze your own performance against these Delkanda seasonality benchmarks and adjust your pricing and availability strategy accordingly.
Best Areas for Airbnb Investment in Delkanda (2025)
Exploring the top neighborhoods for short-term rentals in Delkanda? This section highlights key areas, outlining why they are attractive for hosts and guests, along with notable local attractions. Consider these locations based on your target guest profile and investment strategy.
| Neighborhood / Area | Why Host Here? (Target Guests & Appeal) | Key Attractions & Landmarks |
|---|---|---|
| Delkanda Central | The bustling heart of Delkanda, known for its lively markets and accessibility. Ideal for tourists looking to immerse in local culture and enjoy authentic Sri Lankan cuisine. | Delkanda Market, Local restaurants, Cultural temples, Public parks |
| Piliyandala | A nearby suburb that offers a blend of suburban living and access to city amenities. Great for families and longer stays, with attractions suited for various demographics. | Piliyandala Railway Station, Local shopping centers, Cultural sites, Public transport links |
| Nawala | A rapidly developing area within easy reach of Colombo, perfect for those seeking a suburban feel with quick access to urban attractions. Popular among expatriates and long-term guests. | Nawala Shopping Complex, Local cafes, Nature parks, Religious sites |
| Kottawa | A peaceful suburb surrounded by greenery, providing a tranquil environment away from the hustle of the city. Attractive for those looking for a quiet retreat. | Kottawa Wetland, Nature trails, Local eateries, Cultural centers |
| Dehiwala | Famous for its beaches and wildlife parks, making it a hit with families and nature lovers. Hosts several tourist attractions and a vibrant nightlife. | Dehiwala Zoo, Beaches, Local seafood restaurants, Shopping areas |
| Boralesgamuwa | A mostly residential area with beautiful landscapes and parks, it attracts those looking for longer stays in a relaxed setting. | Boralesgamuwa Lake, Local parks, Community events, Shopping areas |
| Moratuwa | Known for its beautiful coastal views and maritime culture. Great for tourists looking to explore the beaches and local crafts. | Moratuwa Beach, Boat building yards, Local seafood, Cultural festivals |
| Mt. Lavinia | A popular beach destination close to Colombo, known for its historical significance and vibrant nightlife. Ideal for beach lovers and party-goers. | Mt. Lavinia Beach, Old colonial residences, Nightclubs, Fishing harbors |
Understanding Airbnb License Requirements & STR Laws in Delkanda (2025)
While Delkanda, Western Province, Sri Lanka currently shows low STR regulations, specific Airbnb license requirements might still exist or change. Always verify the latest short term rental regulations and Airbnb license requirements directly with local government authorities for Delkanda to ensure full compliance before hosting.
(Source: AirROI data, 2025, finding no licensed listings among those analyzed)
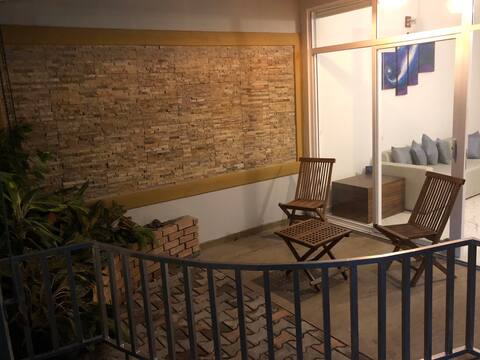
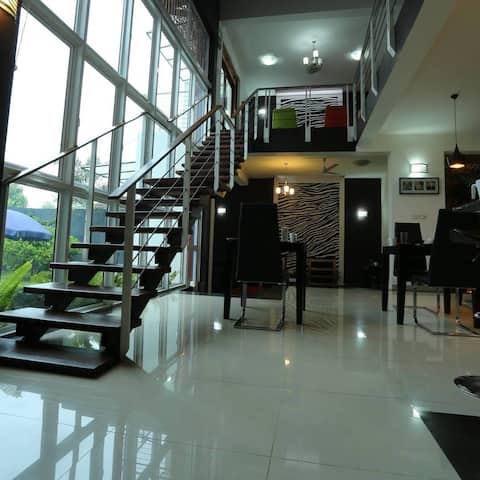
Top Performing Airbnb Properties in Delkanda (2025)
Benchmark your potential! Explore examples of top-performing Airbnb properties in Delkandabased on Trailing Twelve Month (TTM) revenue. Analyze their characteristics, revenue, occupancy rate, and ADR to understand what drives success in this market.

Home Base - Colombo
Entire Place • 3 bedrooms

Mango Tree Residence, Private apartment
Entire Place • 2 bedrooms

Dove Cottage - villa with pool
Entire Place • 2 bedrooms
The Tessallata
Entire Place • 2 bedrooms
Cozy Rooms in Colombo, Sri Lanka
Entire Place • 2 bedrooms

Teak Wood Terrace
Entire Place • 3 bedrooms
Note: Performance varies based on location, size, amenities, seasonality, and management quality. Data reflects the past 12 months.
Top Performing Airbnb Hosts in Delkanda (2025)
Learn from the best! This table showcases top-performing Airbnb hosts in Delkanda based on the number of properties managed and estimated total revenue over the past year. Analyze their scale and performance metrics.
| Host Name | Properties | Grossing Revenue | Stay Reviews | Avg Rating |
|---|---|---|---|---|
| Damith | 1 | $10,249 | 40 | 4.95/5.0 |
| Nenuka | 6 | $8,371 | 22 | 4.83/5.0 |
| Zulfica | 1 | $7,444 | 68 | 4.90/5.0 |
| Anouk | 1 | $6,401 | 115 | 4.75/5.0 |
| Sanjeev | 1 | $6,383 | 56 | 4.95/5.0 |
| Host #316034520 | 1 | $5,136 | 1 | N/A/5.0 |
| Sanjaya | 1 | $4,700 | 18 | 4.78/5.0 |
| Host #102717075 | 2 | $4,343 | 2 | N/A/5.0 |
| Host #423165478 | 1 | $3,434 | 1 | N/A/5.0 |
| Asoka | 1 | $2,976 | 5 | 5.00/5.0 |
Analyzing the strategies of top hosts, such as their property selection, pricing, and guest communication, can offer valuable lessons for optimizing your own Airbnb operations in Delkanda.
Dive Deeper: Advanced Delkanda STR Market Data (2025)
Ready to unlock more insights? AirROI provides access to advanced metrics and comprehensive Airbnb data for Delkanda. Explore detailed analytics beyond this report to refine your investment strategy, optimize pricing, and maximize your vacation rental profits.
Explore Advanced MetricsDelkanda Short-Term Rental Market Composition (2025): Property & Room Types
Room Type Distribution
Property Type Distribution
Market Composition Insights for Delkanda
- The Delkanda Airbnb market composition is heavily skewed towards Entire Home/Apt listings, which make up 95% of the 20 active rentals. This indicates strong guest preference for privacy and space.
- Looking at the property type distribution in Delkanda, Apartment/Condo properties are the most common (45%), reflecting the local real estate landscape.
- Houses represent a significant 40% portion, catering likely to families or larger groups.
- The presence of 10% Hotel/Boutique listings indicates integration with traditional hospitality.
Delkanda Airbnb Room Capacity Analysis (2025): Bedroom Distribution
Distribution of Listings by Number of Bedrooms
Room Capacity Insights for Delkanda
- The dominant room capacity in Delkanda is 2 bedrooms listings, making up 50% of the market. This suggests a strong demand for properties suitable for couples or solo travelers.
- Together, 2 bedrooms and 3 bedrooms properties represent 80.0% of the active Airbnb listings in Delkanda, indicating a high concentration in these sizes.
- A significant 30.0% of listings offer 3+ bedrooms, catering to larger groups and families seeking more space in Delkanda.
Delkanda Vacation Rental Guest Capacity Trends (2025)
Distribution of Listings by Guest Capacity
Guest Capacity Insights for Delkanda
- The most common guest capacity trend in Delkanda vacation rentals is listings accommodating 4 guests (50%). This suggests the primary traveler segment is likely small families or groups.
- Properties designed for 4 guests and 6 guests dominate the Delkanda STR market, accounting for 70.0% of listings.
- 20.0% of properties accommodate 6+ guests, serving the market segment for larger families or group travel in Delkanda.
- On average, properties in Delkanda are equipped to host 3.8 guests.
Delkanda Airbnb Booking Patterns (2025): Available vs. Booked Days
Available Days Distribution
Booked Days Distribution
Booking Pattern Insights for Delkanda
- The most common availability pattern in Delkanda falls within the 271-366 days range, representing 85% of listings. This suggests many properties have significant open periods on their calendars.
- Approximately 85.0% of listings show high availability (181+ days open annually), indicating potential for increased bookings or specific owner usage patterns.
- For booked days, the 31-90 days range is most frequent in Delkanda (50%), reflecting common guest stay durations or potential owner blocking patterns.
- A notable 15.0% of properties secure long booking periods (181+ days booked per year), highlighting successful long-term rental strategies or significant owner usage.
Delkanda Airbnb Minimum Stay Requirements Analysis
Distribution of Listings by Minimum Night Requirement
1 Night
7 listings
35% of total
2 Nights
7 listings
35% of total
3 Nights
2 listings
10% of total
4-6 Nights
3 listings
15% of total
30+ Nights
1 listings
5% of total
Key Insights
- The most prevalent minimum stay requirement in Delkanda is 1 Night, adopted by 35% of listings. This highlights the market's preference for shorter, flexible bookings.
- A strong majority (70.0%) of the Delkanda Airbnb data shows acceptance of very short stays (1-2 nights), indicating a dynamic, high-turnover market.
Recommendations
- Align with the market by considering a 1 Night minimum stay, as 35% of Delkanda hosts use this setting.
- Adjust minimum nights based on seasonality – potentially shorter during low season and longer during peak demand periods in Delkanda.
Delkanda Airbnb Cancellation Policy Trends Analysis (2025)
Flexible
5 listings
45.5% of total
Moderate
3 listings
27.3% of total
Firm
1 listings
9.1% of total
Strict
2 listings
18.2% of total
Cancellation Policy Insights for Delkanda
- The prevailing Airbnb cancellation policy trend in Delkanda is Flexible, used by 45.5% of listings.
- The market strongly favors guest-friendly terms, with 72.8% of listings offering Flexible or Moderate policies. This suggests guests in Delkanda may expect booking flexibility.
Recommendations for Hosts
- Consider adopting a Flexible policy to align with the 45.5% market standard in Delkanda.
- Regularly review your cancellation policy against competitors and market demand shifts in Delkanda.
Delkanda STR Booking Lead Time Analysis (2025)
Average Booking Lead Time by Month
Booking Lead Time Insights for Delkanda
- The overall average booking lead time for vacation rentals in Delkanda is 25 days.
- Guests book furthest in advance for stays during January (average 44 days), likely coinciding with peak travel demand or local events.
- The shortest booking windows occur for stays in July (average 17 days), indicating more last-minute travel plans during this time.
- Seasonally, Winter (41 days avg.) sees the longest lead times, while Summer (25 days avg.) has the shortest, reflecting typical travel planning cycles.
Recommendations for Hosts
- Use the overall average lead time (25 days) as a baseline for your pricing and availability strategy in Delkanda.
- For January stays, consider implementing length-of-stay discounts or slightly higher rates for bookings made less than 44 days out to capitalize on advance planning.
- Target marketing efforts for the Winter season well in advance (at least 41 days) to capture early planners.
- Monitor your own booking lead times against these Delkanda averages to identify opportunities for dynamic pricing adjustments.
Popular & Essential Airbnb Amenities in Delkanda (2025)
Amenity Prevalence
Amenity Insights for Delkanda
- Essential amenities in Delkanda that guests expect include: Washer, Air conditioning, Kitchen, Free parking on premises, Essentials, Hot water, Wifi. Lacking these (any) could significantly impact bookings.
- Popular amenities like TV, Refrigerator, Iron are common but not universal. Offering these can provide a competitive edge.
Recommendations for Hosts
- Ensure your listing includes all essential amenities for Delkanda: Washer, Air conditioning, Kitchen, Free parking on premises, Essentials, Hot water, Wifi.
- Prioritize adding missing essentials: Essentials, Hot water, Wifi.
- Consider adding popular differentiators like TV or Refrigerator to increase appeal.
- Highlight unique or less common amenities you offer (e.g., hot tub, dedicated workspace, EV charger) in your listing description and photos.
- Regularly check competitor amenities in Delkanda to stay competitive.
Delkanda Airbnb Guest Demographics & Profile Analysis (2025)
Guest Profile Summary for Delkanda
- The typical guest profile for Airbnb in Delkanda consists of predominantly international visitors (97%), with top international origins including Canada, typically belonging to the Post-2000s (Gen Z/Alpha) group (50%), primarily speaking English or French.
- Domestic travelers account for 2.9% of guests.
- Key international markets include Australia (23.5%) and Canada (17.6%).
- Top languages spoken are English (63%) followed by French (14.8%).
- A significant demographic segment is the Post-2000s (Gen Z/Alpha) group, representing 50% of guests.
Recommendations for Hosts
- Focus marketing internationally, particularly towards travelers from Canada.
- Tailor amenities and listing descriptions to appeal to the dominant Post-2000s (Gen Z/Alpha) demographic (e.g., highlight fast WiFi, smart home features, local guides).
- Highlight unique local experiences or amenities relevant to the primary guest profile.
- Consider seasonal promotions aligned with peak travel times for key origin markets.
Nearby Short-Term Rental Market Comparison
How does the Delkanda Airbnb market stack up against its neighbors? Compare key performance metrics like average monthly revenue, ADR, and occupancy rates in surrounding areas to understand the broader regional STR landscape.
| Market | Active Properties | Monthly Revenue | Daily Rate | Avg. Occupancy |
|---|---|---|---|---|
| Kamburugamuwa | 14 | $3,030 | $592.33 | 25% |
| Mawella | 11 | $2,427 | $250.41 | 39% |
| Maberiyatenna | 18 | $2,422 | $475.40 | 28% |
| Madampagama | 23 | $2,344 | $252.91 | 42% |
| Ranna | 11 | $2,208 | $248.15 | 35% |
| Walgama | 68 | $1,740 | $114.74 | 44% |
| Rajgama | 36 | $1,590 | $169.91 | 33% |
| Thiththagalla | 11 | $1,583 | $191.08 | 46% |
| Ginigala | 10 | $1,534 | $209.73 | 33% |
| Talpe | 121 | $1,501 | $236.78 | 31% |