Thissamaharama Airbnb Market Analysis 2025: Short Term Rental Data & Vacation Rental Statistics in Southern Province, Sri Lanka
Is Airbnb profitable in Thissamaharama in 2025? Explore comprehensive Airbnb analytics for Thissamaharama, Southern Province, Sri Lanka to uncover income potential. This 2025 STR market report for Thissamaharama, based on AirROI data from June 2024 to May 2025, reveals key trends in the niche market of 19 active listings.
Whether you're considering an Airbnb investment in Thissamaharama, optimizing your existing vacation rental, or exploring rental arbitrage opportunities, understanding the Thissamaharama Airbnb data is crucial. Leveraging the low regulation environment is key to maximizing your short term rental income potential. Let's dive into the specifics.
Key Thissamaharama Airbnb Performance Metrics Overview
Monthly Airbnb Revenue Variations & Income Potential in Thissamaharama (2025)
Understanding the monthly revenue variations for Airbnb listings in Thissamaharama is key to maximizing your short term rental income potential. Seasonality significantly impacts earnings. Our analysis, based on data from the past 12 months, shows that the peak revenue month for STRs in Thissamaharama is typically February, while August often presents the lowest earnings, highlighting opportunities for strategic pricing adjustments during shoulder and low seasons. Explore the typical Airbnb income in Thissamaharama across different performance tiers:
- Best-in-class properties (Top 10%) achieve $3,239+ monthly, often utilizing dynamic pricing and superior guest experiences.
- Strong performing properties (Top 25%) earn $1,008 or more, indicating effective management and desirable locations/amenities.
- Typical properties (Median) generate around $314 per month, representing the average market performance.
- Entry-level properties (Bottom 25%) see earnings around $136, often with potential for optimization.
Average Monthly Airbnb Earnings Trend in Thissamaharama
Thissamaharama Airbnb Occupancy Rate Trends (2025)
Maximize your bookings by understanding the Thissamaharama STR occupancy trends. Seasonal demand shifts significantly influence how often properties are booked. Typically, Februarysees the highest demand (peak season occupancy), while October experiences the lowest (low season). Effective strategies, like adjusting minimum stays or offering promotions, can boost occupancy during slower periods. Here's how different property tiers perform in Thissamaharama:
- Best-in-class properties (Top 10%) achieve 75%+ occupancy, indicating high desirability and potentially optimized availability.
- Strong performing properties (Top 25%) maintain 46% or higher occupancy, suggesting good market fit and guest satisfaction.
- Typical properties (Median) have an occupancy rate around 25%.
- Entry-level properties (Bottom 25%) average 14% occupancy, potentially facing higher vacancy.
Average Monthly Occupancy Rate Trend in Thissamaharama
Average Daily Rate (ADR) Airbnb Trends in Thissamaharama (2025)
Effective short term rental pricing strategy in Thissamaharama involves understanding monthly ADR fluctuations. The Average Daily Rate (ADR) for Airbnb in Thissamaharama typically peaks in January and dips lowest during December. Leveraging Airbnb dynamic pricing tools or strategies based on this seasonality can significantly boost revenue. Here's a look at the typical nightly rates achieved:
- Best-in-class properties (Top 10%) command rates of $134+ per night, often due to premium features or locations.
- Strong performing properties (Top 25%) achieve nightly rates of $80 or more.
- Typical properties (Median) charge around $38 per night.
- Entry-level properties (Bottom 25%) earn around $25 per night.
Average Daily Rate (ADR) Trend by Month in Thissamaharama
Get Live Thissamaharama Market Intelligence 👇

Explore Real-time Analytics
Airbnb Seasonality Analysis & Trends in Thissamaharama (2025)
Peak Season (February, January, June)
- Revenue averages $1,484 per month
- Occupancy rates average 43.0%
- Daily rates average $67
Shoulder Season
- Revenue averages $889 per month
- Occupancy maintains around 31.1%
- Daily rates hold near $64
Low Season (August, September, November)
- Revenue drops to average $647 per month
- Occupancy decreases to average 29.4%
- Daily rates adjust to average $59
Seasonality Insights for Thissamaharama
- The Airbnb seasonality in Thissamaharama shows highly seasonal trends requiring careful strategy. While the sections above show seasonal averages, it's also insightful to look at the extremes:
- During the high season, the absolute peak month showcases Thissamaharama's highest earning potential, with monthly revenues capable of climbing to $1,571, occupancy reaching a high of 48.1%, and ADRs peaking at $72.
- Conversely, the slowest single month of the year, typically falling within the low season, marks the market's lowest point. In this month, revenue might dip to $610, occupancy could drop to 24.0%, and ADRs may adjust down to $58.
- Understanding both the seasonal averages and these monthly peaks and troughs in revenue, occupancy, and ADR is crucial for maximizing your Airbnb profit potential in Thissamaharama.
Seasonal Strategies for Maximizing Profit
- Peak Season: Maximize revenue through premium pricing and potentially longer minimum stays. Ensure high availability.
- Low Season: Offer competitive pricing, special promotions (e.g., extended stay discounts), and flexible cancellation policies. Target off-season travelers like remote workers or budget-conscious guests.
- Shoulder Seasons: Implement dynamic pricing that balances peak and low rates. Target weekend travelers or specific events. Offer slightly more flexible terms than peak season.
- Regularly analyze your own performance against these Thissamaharama seasonality benchmarks and adjust your pricing and availability strategy accordingly.
Best Areas for Airbnb Investment in Thissamaharama (2025)
Exploring the top neighborhoods for short-term rentals in Thissamaharama? This section highlights key areas, outlining why they are attractive for hosts and guests, along with notable local attractions. Consider these locations based on your target guest profile and investment strategy.
| Neighborhood / Area | Why Host Here? (Target Guests & Appeal) | Key Attractions & Landmarks |
|---|---|---|
| Yala National Park | A major wildlife park in Sri Lanka known for its rich biodiversity and the chance to see leopards, elephants, and a variety of birds. Ideal for tourists seeking adventure and nature experiences. | Yala National Park safaris, Elephant watching, Bird watching, Kumana National Park, Scenic beaches nearby |
| Maha Oya | A serene and picturesque area perfect for nature lovers and those wanting a peaceful retreat. Close to the beautiful layered countryside and traditional farming. | Maha Oya river, Tea plantations, Traditional village tours, Stunning landscapes |
| Tissa Lake | A nearby lake that offers beautiful scenery and outdoor activities. Great for relaxing getaways and for those who love photography and nature. | Tissa Lake, Boating activities, Sunset views, Surrounding nature trails |
| Kirinda Beach | A quiet beach destination known for its tranquility and stunning ocean views. Popular with travelers looking to unwind and enjoy beach activities. | Kirinda Beach, Buddha Statues, Snorkeling opportunities |
| Productive Rice Farms | Offering a unique experience of rural Sri Lankan life, these farms attract guests who want an authentic local experience away from the typical tourist spots. | Rice paddies, Local agricultural practices, Cooking classes |
| Sithulpawwa Rock Monastery | An ancient monastery located in the forest, it combines history with breathtaking views and is appealing to those interested in history and spirituality. | Ancient ruins, Hiking trails, Cultural tours |
| Kumana National Park | A lesser-known wildlife sanctuary that provides an authentic experience with Sri Lanka’s flora and fauna. It’s ideal for eco-tourists. | Great bird watching, Wildlife photography, Nature trails |
| Buddha Temple in Tissamaharama | A spiritual site that attracts visitors interested in Buddhism and offers a peaceful atmosphere. Great for cultural tourism. | Historical temples, Cultural heritage, Monastic traditions |
Understanding Airbnb License Requirements & STR Laws in Thissamaharama (2025)
While Thissamaharama, Southern Province, Sri Lanka currently shows low STR regulations, specific Airbnb license requirements might still exist or change. Always verify the latest short term rental regulations and Airbnb license requirements directly with local government authorities for Thissamaharama to ensure full compliance before hosting.
(Source: AirROI data, 2025, finding no licensed listings among those analyzed)
Top Performing Airbnb Properties in Thissamaharama (2025)
Benchmark your potential! Explore examples of top-performing Airbnb properties in Thissamaharamabased on Trailing Twelve Month (TTM) revenue. Analyze their characteristics, revenue, occupancy rate, and ADR to understand what drives success in this market.

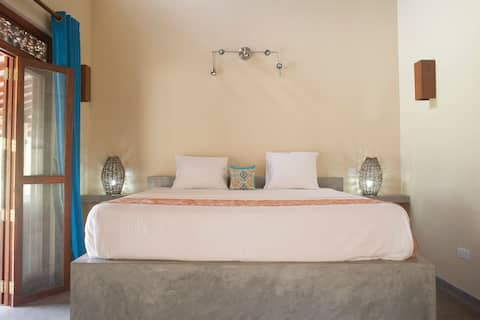
Stylish lakefront safari villa with pool near Yala
Entire Place • 3 bedrooms

Private lakefront villa near Yala and Bundala
Entire Place • 4 bedrooms
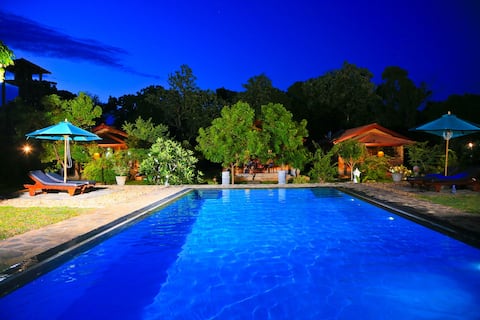
Lakefront Bungalow with pool near Yala
Entire Place • 1 bedroom
Shangri-Lanka Village bungalows, Tissamaharama
Entire Place • 3 bedrooms

Yala Ziziphus Tree Villas (Boutique hotel in Yala)
Private Room • 1 bedroom
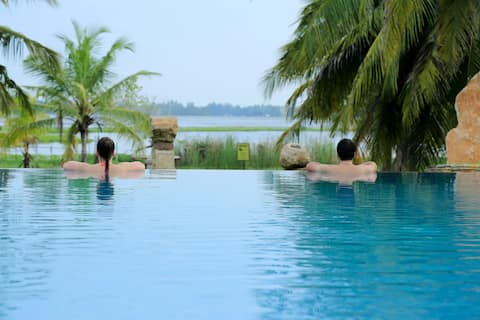
Room in a hotel by Beautiful Tissa Lake
Private Room • 1 bedroom
Note: Performance varies based on location, size, amenities, seasonality, and management quality. Data reflects the past 12 months.
Top Performing Airbnb Hosts in Thissamaharama (2025)
Learn from the best! This table showcases top-performing Airbnb hosts in Thissamaharama based on the number of properties managed and estimated total revenue over the past year. Analyze their scale and performance metrics.
| Host Name | Properties | Grossing Revenue | Stay Reviews | Avg Rating |
|---|---|---|---|---|
| Kristin And Maduranga | 3 | $111,558 | 204 | 4.98/5.0 |
| Ziziphus Tree Villas Tissamaha | 3 | $9,997 | 449 | 4.70/5.0 |
| Rohan | 2 | $9,403 | 17 | 4.80/5.0 |
| Tara | 2 | $6,500 | 95 | 4.64/5.0 |
| Rice Rice | 1 | $3,599 | 3 | 4.67/5.0 |
| Host #147463887 | 1 | $2,847 | 0 | N/A/5.0 |
| Ark | 1 | $1,728 | 3 | 4.67/5.0 |
| Nirmala | 1 | $1,298 | 11 | 4.36/5.0 |
| Chandani Amarasekara | 1 | $1,115 | 19 | 4.68/5.0 |
| Uchith | 1 | $641 | 4 | 5.00/5.0 |
Analyzing the strategies of top hosts, such as their property selection, pricing, and guest communication, can offer valuable lessons for optimizing your own Airbnb operations in Thissamaharama.
Dive Deeper: Advanced Thissamaharama STR Market Data (2025)
Ready to unlock more insights? AirROI provides access to advanced metrics and comprehensive Airbnb data for Thissamaharama. Explore detailed analytics beyond this report to refine your investment strategy, optimize pricing, and maximize your vacation rental profits.
Explore Advanced MetricsThissamaharama Short-Term Rental Market Composition (2025): Property & Room Types
Room Type Distribution
Property Type Distribution
Market Composition Insights for Thissamaharama
- The Thissamaharama Airbnb market composition is heavily skewed towards Private Room listings, which make up 68.4% of the 19 active rentals. This indicates strong guest preference for privacy and space.
- Looking at the property type distribution in Thissamaharama, Hotel/Boutique properties are the most common (52.6%), reflecting the local real estate landscape.
- Houses represent a significant 42.1% portion, catering likely to families or larger groups.
- The presence of 52.6% Hotel/Boutique listings indicates integration with traditional hospitality.
Thissamaharama Airbnb Room Capacity Analysis (2025): Bedroom Distribution
Distribution of Listings by Number of Bedrooms
Room Capacity Insights for Thissamaharama
- The dominant room capacity in Thissamaharama is 1 bedroom listings, making up 42.1% of the market. This suggests a strong demand for properties suitable for couples or solo travelers.
- Together, 1 bedroom and 3 bedrooms properties represent 73.7% of the active Airbnb listings in Thissamaharama, indicating a high concentration in these sizes.
- A significant 47.4% of listings offer 3+ bedrooms, catering to larger groups and families seeking more space in Thissamaharama.
Thissamaharama Vacation Rental Guest Capacity Trends (2025)
Distribution of Listings by Guest Capacity
Guest Capacity Insights for Thissamaharama
- The most common guest capacity trend in Thissamaharama vacation rentals is listings accommodating 2 guests (31.6%). This suggests the primary traveler segment is likely couples or solo travelers.
- Properties designed for 2 guests and 8+ guests dominate the Thissamaharama STR market, accounting for 57.9% of listings.
- 31.6% of properties accommodate 6+ guests, serving the market segment for larger families or group travel in Thissamaharama.
- On average, properties in Thissamaharama are equipped to host 3.8 guests.
Thissamaharama Airbnb Booking Patterns (2025): Available vs. Booked Days
Available Days Distribution
Booked Days Distribution
Booking Pattern Insights for Thissamaharama
- The most common availability pattern in Thissamaharama falls within the 271-366 days range, representing 63.2% of listings. This suggests many properties have significant open periods on their calendars.
- Approximately 84.3% of listings show high availability (181+ days open annually), indicating potential for increased bookings or specific owner usage patterns.
- For booked days, the 31-90 days range is most frequent in Thissamaharama (31.6%), reflecting common guest stay durations or potential owner blocking patterns.
- A notable 15.8% of properties secure long booking periods (181+ days booked per year), highlighting successful long-term rental strategies or significant owner usage.
Thissamaharama Airbnb Minimum Stay Requirements Analysis
Distribution of Listings by Minimum Night Requirement
1 Night
19 listings
100% of total
Key Insights
- The most prevalent minimum stay requirement in Thissamaharama is 1 Night, adopted by 100% of listings. This highlights the market's preference for shorter, flexible bookings.
- A strong majority (100.0%) of the Thissamaharama Airbnb data shows acceptance of very short stays (1-2 nights), indicating a dynamic, high-turnover market.
Recommendations
- Align with the market by considering a 1 Night minimum stay, as 100% of Thissamaharama hosts use this setting.
- Adjust minimum nights based on seasonality – potentially shorter during low season and longer during peak demand periods in Thissamaharama.
Thissamaharama Airbnb Cancellation Policy Trends Analysis (2025)
Flexible
10 listings
55.6% of total
Firm
8 listings
44.4% of total
Cancellation Policy Insights for Thissamaharama
- The prevailing Airbnb cancellation policy trend in Thissamaharama is Flexible, used by 55.6% of listings.
- There's a relatively balanced mix between guest-friendly (55.6%) and stricter (44.4%) policies, offering choices for different guest needs.
Recommendations for Hosts
- Consider adopting a Flexible policy to align with the 55.6% market standard in Thissamaharama.
- Given the high prevalence of Flexible policies (55.6%), offering this can enhance booking appeal, especially during shoulder seasons.
- Regularly review your cancellation policy against competitors and market demand shifts in Thissamaharama.
Thissamaharama STR Booking Lead Time Analysis (2025)
Average Booking Lead Time by Month
Booking Lead Time Insights for Thissamaharama
- The overall average booking lead time for vacation rentals in Thissamaharama is 51 days.
- Guests book furthest in advance for stays during June (average 75 days), likely coinciding with peak travel demand or local events.
- The shortest booking windows occur for stays in October (average 27 days), indicating more last-minute travel plans during this time.
- Seasonally, Summer (72 days avg.) sees the longest lead times, while Fall (36 days avg.) has the shortest, reflecting typical travel planning cycles.
Recommendations for Hosts
- Use the overall average lead time (51 days) as a baseline for your pricing and availability strategy in Thissamaharama.
- For June stays, consider implementing length-of-stay discounts or slightly higher rates for bookings made less than 75 days out to capitalize on advance planning.
- Target marketing efforts for the Summer season well in advance (at least 72 days) to capture early planners.
- Monitor your own booking lead times against these Thissamaharama averages to identify opportunities for dynamic pricing adjustments.
Popular & Essential Airbnb Amenities in Thissamaharama (2025)
Amenity Prevalence
Amenity Insights for Thissamaharama
- Essential amenities in Thissamaharama that guests expect include: Wifi, Free parking on premises. Lacking these (any) could significantly impact bookings.
- Popular amenities like Essentials, Air conditioning, Lock on bedroom door are common but not universal. Offering these can provide a competitive edge.
Recommendations for Hosts
- Ensure your listing includes all essential amenities for Thissamaharama: Wifi, Free parking on premises.
- Consider adding popular differentiators like Essentials or Air conditioning to increase appeal.
- Highlight unique or less common amenities you offer (e.g., hot tub, dedicated workspace, EV charger) in your listing description and photos.
- Regularly check competitor amenities in Thissamaharama to stay competitive.
Thissamaharama Airbnb Guest Demographics & Profile Analysis (2025)
Guest Profile Summary for Thissamaharama
- The typical guest profile for Airbnb in Thissamaharama consists of predominantly international visitors (99%), with top international origins including United Kingdom, typically belonging to the Post-2000s (Gen Z/Alpha) group (50%), primarily speaking English or German.
- Domestic travelers account for 0.6% of guests.
- Key international markets include Germany (22%) and United Kingdom (20.2%).
- Top languages spoken are English (41.6%) followed by German (16.7%).
- A significant demographic segment is the Post-2000s (Gen Z/Alpha) group, representing 50% of guests.
Recommendations for Hosts
- Focus marketing internationally, particularly towards travelers from United Kingdom.
- Tailor amenities and listing descriptions to appeal to the dominant Post-2000s (Gen Z/Alpha) demographic (e.g., highlight fast WiFi, smart home features, local guides).
- Highlight unique local experiences or amenities relevant to the primary guest profile.
- Consider seasonal promotions aligned with peak travel times for key origin markets.
Nearby Short-Term Rental Market Comparison
How does the Thissamaharama Airbnb market stack up against its neighbors? Compare key performance metrics like average monthly revenue, ADR, and occupancy rates in surrounding areas to understand the broader regional STR landscape.
| Market | Active Properties | Monthly Revenue | Daily Rate | Avg. Occupancy |
|---|---|---|---|---|
| Kamburugamuwa | 14 | $3,030 | $592.33 | 25% |
| Mawella | 11 | $2,427 | $250.41 | 39% |
| Maberiyatenna | 18 | $2,422 | $475.40 | 28% |
| Madampagama | 23 | $2,344 | $252.91 | 42% |
| Ranna | 11 | $2,208 | $248.15 | 35% |
| Walgama | 68 | $1,740 | $114.74 | 44% |
| Rajgama | 36 | $1,590 | $169.91 | 33% |
| Thiththagalla | 11 | $1,583 | $191.08 | 46% |
| Ginigala | 10 | $1,534 | $209.73 | 33% |
| Talpe | 121 | $1,501 | $236.78 | 31% |