Myeongdal-ri Airbnb Market Analysis 2025: Short Term Rental Data & Vacation Rental Statistics in Yangpyeong-gun, South Korea
Is Airbnb profitable in Myeongdal-ri in 2025? Explore comprehensive Airbnb analytics for Myeongdal-ri, Yangpyeong-gun, South Korea to uncover income potential. This 2025 STR market report for Myeongdal-ri, based on AirROI data from June 2024 to May 2025, reveals key trends in the niche market of 29 active listings.
Whether you're considering an Airbnb investment in Myeongdal-ri, optimizing your existing vacation rental, or exploring rental arbitrage opportunities, understanding the Myeongdal-ri Airbnb data is crucial. Understanding the local regulations is key to maximizing your short term rental income potential. Let's dive into the specifics.
Key Myeongdal-ri Airbnb Performance Metrics Overview
Monthly Airbnb Revenue Variations & Income Potential in Myeongdal-ri (2025)
Understanding the monthly revenue variations for Airbnb listings in Myeongdal-ri is key to maximizing your short term rental income potential. Seasonality significantly impacts earnings. Our analysis, based on data from the past 12 months, shows that the peak revenue month for STRs in Myeongdal-ri is typically July, while October often presents the lowest earnings, highlighting opportunities for strategic pricing adjustments during shoulder and low seasons. Explore the typical Airbnb income in Myeongdal-ri across different performance tiers:
- Best-in-class properties (Top 10%) achieve $1,653+ monthly, often utilizing dynamic pricing and superior guest experiences.
- Strong performing properties (Top 25%) earn $1,266 or more, indicating effective management and desirable locations/amenities.
- Typical properties (Median) generate around $855 per month, representing the average market performance.
- Entry-level properties (Bottom 25%) see earnings around $510, often with potential for optimization.
Average Monthly Airbnb Earnings Trend in Myeongdal-ri
Myeongdal-ri Airbnb Occupancy Rate Trends (2025)
Maximize your bookings by understanding the Myeongdal-ri STR occupancy trends. Seasonal demand shifts significantly influence how often properties are booked. Typically, Augustsees the highest demand (peak season occupancy), while October experiences the lowest (low season). Effective strategies, like adjusting minimum stays or offering promotions, can boost occupancy during slower periods. Here's how different property tiers perform in Myeongdal-ri:
- Best-in-class properties (Top 10%) achieve 39%+ occupancy, indicating high desirability and potentially optimized availability.
- Strong performing properties (Top 25%) maintain 30% or higher occupancy, suggesting good market fit and guest satisfaction.
- Typical properties (Median) have an occupancy rate around 21%.
- Entry-level properties (Bottom 25%) average 13% occupancy, potentially facing higher vacancy.
Average Monthly Occupancy Rate Trend in Myeongdal-ri
Average Daily Rate (ADR) Airbnb Trends in Myeongdal-ri (2025)
Effective short term rental pricing strategy in Myeongdal-ri involves understanding monthly ADR fluctuations. The Average Daily Rate (ADR) for Airbnb in Myeongdal-ri typically peaks in January and dips lowest during October. Leveraging Airbnb dynamic pricing tools or strategies based on this seasonality can significantly boost revenue. Here's a look at the typical nightly rates achieved:
- Best-in-class properties (Top 10%) command rates of $240+ per night, often due to premium features or locations.
- Strong performing properties (Top 25%) achieve nightly rates of $194 or more.
- Typical properties (Median) charge around $165 per night.
- Entry-level properties (Bottom 25%) earn around $128 per night.
Average Daily Rate (ADR) Trend by Month in Myeongdal-ri
Get Live Myeongdal-ri Market Intelligence 👇

Explore Real-time Analytics
Airbnb Seasonality Analysis & Trends in Myeongdal-ri (2025)
Peak Season (July, August, May)
- Revenue averages $1,526 per month
- Occupancy rates average 34.0%
- Daily rates average $165
Shoulder Season
- Revenue averages $881 per month
- Occupancy maintains around 22.6%
- Daily rates hold near $169
Low Season (February, October, November)
- Revenue drops to average $477 per month
- Occupancy decreases to average 13.9%
- Daily rates adjust to average $164
Seasonality Insights for Myeongdal-ri
- The Airbnb seasonality in Myeongdal-ri shows highly seasonal trends requiring careful strategy. While the sections above show seasonal averages, it's also insightful to look at the extremes:
- During the high season, the absolute peak month showcases Myeongdal-ri's highest earning potential, with monthly revenues capable of climbing to $1,791, occupancy reaching a high of 41.0%, and ADRs peaking at $189.
- Conversely, the slowest single month of the year, typically falling within the low season, marks the market's lowest point. In this month, revenue might dip to $438, occupancy could drop to 12.3%, and ADRs may adjust down to $155.
- Understanding both the seasonal averages and these monthly peaks and troughs in revenue, occupancy, and ADR is crucial for maximizing your Airbnb profit potential in Myeongdal-ri.
Seasonal Strategies for Maximizing Profit
- Peak Season: Maximize revenue through premium pricing and potentially longer minimum stays. Ensure high availability.
- Low Season: Offer competitive pricing, special promotions (e.g., extended stay discounts), and flexible cancellation policies. Target off-season travelers like remote workers or budget-conscious guests.
- Shoulder Seasons: Implement dynamic pricing that balances peak and low rates. Target weekend travelers or specific events. Offer slightly more flexible terms than peak season.
- Regularly analyze your own performance against these Myeongdal-ri seasonality benchmarks and adjust your pricing and availability strategy accordingly.
Best Areas for Airbnb Investment in Myeongdal-ri (2025)
Exploring the top neighborhoods for short-term rentals in Myeongdal-ri? This section highlights key areas, outlining why they are attractive for hosts and guests, along with notable local attractions. Consider these locations based on your target guest profile and investment strategy.
| Neighborhood / Area | Why Host Here? (Target Guests & Appeal) | Key Attractions & Landmarks |
|---|---|---|
| Myeongdal Beach | A popular destination for beach lovers with picturesque scenery and outdoor activities. It's ideal for visitors looking for a coastal getaway and family-friendly attractions. | Myeongdal Beach, Hiking Trails, Water Sports, Sunset Viewpoints |
| Yangpyeong River | Known for its serene riverside views and recreational activities. Perfect for tourists looking for relaxation and nature experiences along the river. | Yangpyeong River, Fishing Areas, Picnic Spots, Scenic Walking Paths |
| Yucheon Valley | An area surrounded by lush mountains and valleys, attracting eco-tourists and those seeking adventure sports. It's a great location for nature lovers and hikers. | Hiking Trails, Mountain Climbing, Camping Sites, Scenic Views |
| Dumbong | A tranquil area ideal for visitors seeking peace and quiet. It's great for hosting retreats or family gatherings away from urban noise. | Nature Parks, Quiet Walking Trails, Local Farms, Cultural Heritage Sites |
| Waryong Mountain | Renowned for its beautiful hiking paths and breathtaking vistas. Attracts outdoor enthusiasts looking for engaging activities in nature. | Waryong Mountain Peak, Scenic Viewpoints, Hiking Trails, Wildlife Watching |
| Yangpyeong Traditional Market | A cultural hotspot where tourists can experience local cuisine and crafts. Ideal for guests who want to immerse themselves in local life. | Local Food Specialties, Traditional Crafts, Cultural Events |
| Jangheung Rec Center | Becomes a hub for family-oriented activities and sports. Good for hosting an active crowd or families on vacation. | Sports Facilities, Family Activities, Outdoor Pools |
| Pine Tree Village | Known for its calming atmosphere and beautiful pine forests. Perfect for relaxation and retreats in the midst of nature. | Pine Forests, Nature Trails, Relaxation Areas |
Understanding Airbnb License Requirements & STR Laws in Myeongdal-ri (2025)
With 17% of listings showing registration in 2025, understanding potential Airbnb license requirements is crucial in Myeongdal-ri. Always verify the latest short term rental regulations and Airbnb license requirements directly with local government authorities for Myeongdal-ri to ensure full compliance before hosting.
(Source: AirROI data, 2025, based on 17% licensed listings)
Top Performing Airbnb Properties in Myeongdal-ri (2025)
Benchmark your potential! Explore examples of top-performing Airbnb properties in Myeongdal-ribased on Trailing Twelve Month (TTM) revenue. Analyze their characteristics, revenue, occupancy rate, and ADR to understand what drives success in this market.
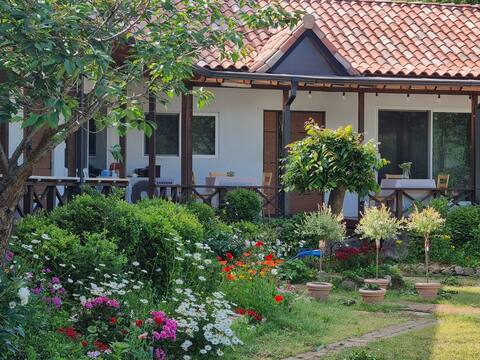
![200 pyeong private house Hanok stay, Yangpyeong Wolgotak [Moonlight beneath]](https://a0.muscache.com/im/pictures/hosting/Hosting-U3RheVN1cHBseUxpc3Rpbmc6MTE3ODE5NDExNDI2NTg4NDA1NA%3D%3D/original/19c96cb4-66bf-4868-9723-51ec87237c36.jpeg?im_w=480&im_format=avif)
200 pyeong private house Hanok stay, Yangpyeong Wolgotak [Moonlight beneath]
Entire Place • 2 bedrooms
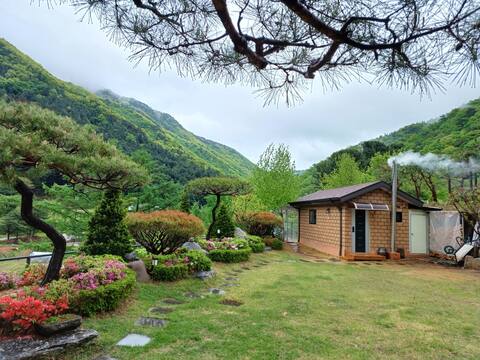
![Yangpyeong Hustay (one floor independent space [studio] + private deck) Just the sound of water, win](https://a0.muscache.com/im/pictures/miso/Hosting-1099941018642921416/original/4402d944-1e76-47d4-be30-3a046ce57397.jpeg?im_w=480&im_format=avif)
Yangpyeong Hustay (one floor independent space [studio] + private deck) Just the sound of water, win
Entire Place • 1 bedroom
Little Forest
Entire Place • 1 bedroom

Eonhyangchae (Pine tree)/A well-being Hanok with a spacious yard and a warm room made of natural loe
Entire Place • 1 bedroom
Yangpyeong Sanstay (Hwangto Bungalow + Private Sunroom Deck) Only water, wind, and birdsong
Entire Place • 1 bedroom

Eunhyangchae (pine)/Wellness hanok with a large courtyard and a warm old room built with natural red
Entire Place • 1 bedroom
Note: Performance varies based on location, size, amenities, seasonality, and management quality. Data reflects the past 12 months.
Top Performing Airbnb Hosts in Myeongdal-ri (2025)
Learn from the best! This table showcases top-performing Airbnb hosts in Myeongdal-ri based on the number of properties managed and estimated total revenue over the past year. Analyze their scale and performance metrics.
| Host Name | Properties | Grossing Revenue | Stay Reviews | Avg Rating |
|---|---|---|---|---|
| Host #457381818 | 13 | $41,791 | 0 | N/A/5.0 |
| Onda | 5 | $21,610 | 0 | N/A/5.0 |
| Raesan | 2 | $18,037 | 80 | 4.86/5.0 |
| Jae Bok | 2 | $16,104 | 284 | 4.83/5.0 |
| 정아 | 1 | $11,977 | 17 | 4.76/5.0 |
| 미숙 | 1 | $9,792 | 40 | 4.93/5.0 |
| 정민 | 1 | $4,963 | 47 | 4.43/5.0 |
| Host #29477503 | 1 | $2,711 | 0 | N/A/5.0 |
| 아그니 | 1 | $2,032 | 87 | 4.91/5.0 |
| 초시매 | 1 | $1,709 | 60 | 4.88/5.0 |
Analyzing the strategies of top hosts, such as their property selection, pricing, and guest communication, can offer valuable lessons for optimizing your own Airbnb operations in Myeongdal-ri.
Dive Deeper: Advanced Myeongdal-ri STR Market Data (2025)
Ready to unlock more insights? AirROI provides access to advanced metrics and comprehensive Airbnb data for Myeongdal-ri. Explore detailed analytics beyond this report to refine your investment strategy, optimize pricing, and maximize your vacation rental profits.
Explore Advanced MetricsMyeongdal-ri Short-Term Rental Market Composition (2025): Property & Room Types
Room Type Distribution
Property Type Distribution
Market Composition Insights for Myeongdal-ri
- The Myeongdal-ri Airbnb market composition is heavily skewed towards Entire Home/Apt listings, which make up 96.6% of the 29 active rentals. This indicates strong guest preference for privacy and space.
- Looking at the property type distribution in Myeongdal-ri, Hotel/Boutique properties are the most common (79.3%), reflecting the local real estate landscape.
- The presence of 79.3% Hotel/Boutique listings indicates integration with traditional hospitality.
- Smaller segments like others, outdoor/unique (combined 6.8%) offer potential for unique stay experiences.
Myeongdal-ri Airbnb Room Capacity Analysis (2025): Bedroom Distribution
Distribution of Listings by Number of Bedrooms
Room Capacity Insights for Myeongdal-ri
- The dominant room capacity in Myeongdal-ri is 1 bedroom listings, making up 93.1% of the market. This suggests a strong demand for properties suitable for couples or solo travelers.
- Together, 1 bedroom and 2 bedrooms properties represent 100.0% of the active Airbnb listings in Myeongdal-ri, indicating a high concentration in these sizes.
- With over half the market (93.1%) consisting of studios or 1-bedroom units, Myeongdal-ri is particularly well-suited for individuals or couples.
Myeongdal-ri Vacation Rental Guest Capacity Trends (2025)
Distribution of Listings by Guest Capacity
Guest Capacity Insights for Myeongdal-ri
- The most common guest capacity trend in Myeongdal-ri vacation rentals is listings accommodating 5 guests (44.8%). This suggests the primary traveler segment is likely larger groups.
- Properties designed for 5 guests and 6 guests dominate the Myeongdal-ri STR market, accounting for 72.4% of listings.
- 27.6% of properties accommodate 6+ guests, serving the market segment for larger families or group travel in Myeongdal-ri.
- On average, properties in Myeongdal-ri are equipped to host 4.9 guests.
Myeongdal-ri Airbnb Booking Patterns (2025): Available vs. Booked Days
Available Days Distribution
Booked Days Distribution
Booking Pattern Insights for Myeongdal-ri
- The most common availability pattern in Myeongdal-ri falls within the 271-366 days range, representing 96.6% of listings. This suggests many properties have significant open periods on their calendars.
- Approximately 100.0% of listings show high availability (181+ days open annually), indicating potential for increased bookings or specific owner usage patterns.
- For booked days, the 1-30 days range is most frequent in Myeongdal-ri (69%), reflecting common guest stay durations or potential owner blocking patterns.
Myeongdal-ri Airbnb Minimum Stay Requirements Analysis
Distribution of Listings by Minimum Night Requirement
1 Night
27 listings
93.1% of total
3 Nights
1 listings
3.4% of total
4-6 Nights
1 listings
3.4% of total
Key Insights
- The most prevalent minimum stay requirement in Myeongdal-ri is 1 Night, adopted by 93.1% of listings. This highlights the market's preference for shorter, flexible bookings.
- A strong majority (93.1%) of the Myeongdal-ri Airbnb data shows acceptance of very short stays (1-2 nights), indicating a dynamic, high-turnover market.
Recommendations
- Align with the market by considering a 1 Night minimum stay, as 93.1% of Myeongdal-ri hosts use this setting.
- Adjust minimum nights based on seasonality – potentially shorter during low season and longer during peak demand periods in Myeongdal-ri.
Myeongdal-ri Airbnb Cancellation Policy Trends Analysis (2025)
Flexible
1 listings
6.7% of total
Moderate
10 listings
66.7% of total
Firm
2 listings
13.3% of total
Strict
2 listings
13.3% of total
Cancellation Policy Insights for Myeongdal-ri
- The prevailing Airbnb cancellation policy trend in Myeongdal-ri is Moderate, used by 66.7% of listings.
- The market strongly favors guest-friendly terms, with 73.4% of listings offering Flexible or Moderate policies. This suggests guests in Myeongdal-ri may expect booking flexibility.
Recommendations for Hosts
- Consider adopting a Moderate policy to align with the 66.7% market standard in Myeongdal-ri.
- Using a Strict policy might deter some guests, as only 13.3% of listings use it. Evaluate if potential revenue protection outweighs possible lower booking rates.
- Regularly review your cancellation policy against competitors and market demand shifts in Myeongdal-ri.
Myeongdal-ri STR Booking Lead Time Analysis (2025)
Average Booking Lead Time by Month
Booking Lead Time Insights for Myeongdal-ri
- The overall average booking lead time for vacation rentals in Myeongdal-ri is 17 days.
- Guests book furthest in advance for stays during February (average 37 days), likely coinciding with peak travel demand or local events.
- The shortest booking windows occur for stays in June (average 0 days), indicating more last-minute travel plans during this time.
- Seasonally, Winter (29 days avg.) sees the longest lead times, while Summer (7 days avg.) has the shortest, reflecting typical travel planning cycles.
Recommendations for Hosts
- Use the overall average lead time (17 days) as a baseline for your pricing and availability strategy in Myeongdal-ri.
- For February stays, consider implementing length-of-stay discounts or slightly higher rates for bookings made less than 37 days out to capitalize on advance planning.
- During June, focus on last-minute booking availability and promotions, as guests book with very short notice (0 days avg.).
- Target marketing efforts for the Winter season well in advance (at least 29 days) to capture early planners.
- Monitor your own booking lead times against these Myeongdal-ri averages to identify opportunities for dynamic pricing adjustments.
Popular & Essential Airbnb Amenities in Myeongdal-ri (2025)
Amenity Prevalence
Amenity Insights for Myeongdal-ri
- Essential amenities in Myeongdal-ri that guests expect include: Hot water, Essentials, Free parking on premises, Kitchen, Heating, Wifi, Hair dryer, TV, Air conditioning. Lacking these (any) could significantly impact bookings.
- Popular amenities like Smoke alarm are common but not universal. Offering these can provide a competitive edge.
Recommendations for Hosts
- Ensure your listing includes all essential amenities for Myeongdal-ri: Hot water, Essentials, Free parking on premises, Kitchen, Heating, Wifi, Hair dryer, TV, Air conditioning.
- Prioritize adding missing essentials: TV, Air conditioning.
- Consider adding popular differentiators like Smoke alarm to increase appeal.
- Highlight unique or less common amenities you offer (e.g., hot tub, dedicated workspace, EV charger) in your listing description and photos.
- Regularly check competitor amenities in Myeongdal-ri to stay competitive.
Myeongdal-ri Airbnb Guest Demographics & Profile Analysis (2025)
Guest Profile Summary for Myeongdal-ri
- The typical guest profile for Airbnb in Myeongdal-ri consists of primarily domestic travelers (96%), often arriving from nearby Seoul, typically belonging to the Post-2000s (Gen Z/Alpha) group (50%), primarily speaking Korean or English.
- Domestic travelers account for 96.2% of guests.
- Key international markets include South Korea (96.2%) and Singapore (1.9%).
- Top languages spoken are Korean (57.6%) followed by English (24.2%).
- A significant demographic segment is the Post-2000s (Gen Z/Alpha) group, representing 50% of guests.
Recommendations for Hosts
- Target domestic marketing efforts towards travelers from Seoul and Incheon.
- Tailor amenities and listing descriptions to appeal to the dominant Post-2000s (Gen Z/Alpha) demographic (e.g., highlight fast WiFi, smart home features, local guides).
- Highlight unique local experiences or amenities relevant to the primary guest profile.
- Consider seasonal promotions aligned with peak travel times for key origin markets.
Nearby Short-Term Rental Market Comparison
How does the Myeongdal-ri Airbnb market stack up against its neighbors? Compare key performance metrics like average monthly revenue, ADR, and occupancy rates in surrounding areas to understand the broader regional STR landscape.
| Market | Active Properties | Monthly Revenue | Daily Rate | Avg. Occupancy |
|---|---|---|---|---|
| Wondeok-ri | 13 | $2,237 | $202.05 | 38% |
| Seorak-myeon | 11 | $1,842 | $185.73 | 34% |
| Homyeong-ri | 32 | $1,832 | $286.02 | 25% |
| Dojang-ri | 12 | $1,785 | $194.17 | 31% |
| Mugan-ri | 15 | $1,749 | $217.46 | 24% |
| Mitan-myeon | 15 | $1,713 | $232.93 | 27% |
| Seorak | 11 | $1,669 | $205.64 | 29% |
| Gapcheon-myeon | 11 | $1,548 | $145.79 | 37% |
| Yangpyeong-gun | 14 | $1,360 | $246.73 | 27% |
| Seojong | 19 | $1,350 | $193.83 | 25% |