Ulleung-eup Airbnb Market Analysis 2025: Short Term Rental Data & Vacation Rental Statistics in North Gyeongsang, South Korea
Is Airbnb profitable in Ulleung-eup in 2025? Explore comprehensive Airbnb analytics for Ulleung-eup, North Gyeongsang, South Korea to uncover income potential. This 2025 STR market report for Ulleung-eup, based on AirROI data from April 2024 to March 2025, reveals key trends in the niche market of 19 active listings.
Whether you're considering an Airbnb investment in Ulleung-eup, optimizing your existing vacation rental, or exploring rental arbitrage opportunities, understanding the Ulleung-eup Airbnb data is crucial. Understanding the local regulations is key to maximizing your short term rental income potential. Let's dive into the specifics.
Key Ulleung-eup Airbnb Performance Metrics Overview
Monthly Airbnb Revenue Variations & Income Potential in Ulleung-eup (2025)
Understanding the monthly revenue variations for Airbnb listings in Ulleung-eup is key to maximizing your short term rental income potential. Seasonality significantly impacts earnings. Our analysis, based on data from the past 12 months, shows that the peak revenue month for STRs in Ulleung-eup is typically August, while January often presents the lowest earnings, highlighting opportunities for strategic pricing adjustments during shoulder and low seasons. Explore the typical Airbnb income in Ulleung-eup across different performance tiers:
- Best-in-class properties (Top 10%) achieve $2,425+ monthly, often utilizing dynamic pricing and superior guest experiences.
- Strong performing properties (Top 25%) earn $1,669 or more, indicating effective management and desirable locations/amenities.
- Typical properties (Median) generate around $1,001 per month, representing the average market performance.
- Entry-level properties (Bottom 25%) see earnings around $607, often with potential for optimization.
Average Monthly Airbnb Earnings Trend in Ulleung-eup
Ulleung-eup Airbnb Occupancy Rate Trends (2025)
Maximize your bookings by understanding the Ulleung-eup STR occupancy trends. Seasonal demand shifts significantly influence how often properties are booked. Typically, Augustsees the highest demand (peak season occupancy), while January experiences the lowest (low season). Effective strategies, like adjusting minimum stays or offering promotions, can boost occupancy during slower periods. Here's how different property tiers perform in Ulleung-eup:
- Best-in-class properties (Top 10%) achieve 66%+ occupancy, indicating high desirability and potentially optimized availability.
- Strong performing properties (Top 25%) maintain 52% or higher occupancy, suggesting good market fit and guest satisfaction.
- Typical properties (Median) have an occupancy rate around 33%.
- Entry-level properties (Bottom 25%) average 18% occupancy, potentially facing higher vacancy.
Average Monthly Occupancy Rate Trend in Ulleung-eup
Average Daily Rate (ADR) Airbnb Trends in Ulleung-eup (2025)
Effective short term rental pricing strategy in Ulleung-eup involves understanding monthly ADR fluctuations. The Average Daily Rate (ADR) for Airbnb in Ulleung-eup typically peaks in July and dips lowest during February. Leveraging Airbnb dynamic pricing tools or strategies based on this seasonality can significantly boost revenue. Here's a look at the typical nightly rates achieved:
- Best-in-class properties (Top 10%) command rates of $233+ per night, often due to premium features or locations.
- Strong performing properties (Top 25%) achieve nightly rates of $204 or more.
- Typical properties (Median) charge around $103 per night.
- Entry-level properties (Bottom 25%) earn around $73 per night.
Average Daily Rate (ADR) Trend by Month in Ulleung-eup
Get Live Ulleung-eup Market Intelligence 👇

Explore Real-time Analytics
Airbnb Seasonality Analysis & Trends in Ulleung-eup (2025)
Peak Season (August, July, May)
- Revenue averages $1,761 per month
- Occupancy rates average 51.7%
- Daily rates average $145
Shoulder Season
- Revenue averages $1,425 per month
- Occupancy maintains around 38.7%
- Daily rates hold near $143
Low Season (January, February, March)
- Revenue drops to average $548 per month
- Occupancy decreases to average 14.7%
- Daily rates adjust to average $125
Seasonality Insights for Ulleung-eup
- The Airbnb seasonality in Ulleung-eup shows highly seasonal trends requiring careful strategy. While the sections above show seasonal averages, it's also insightful to look at the extremes:
- During the high season, the absolute peak month showcases Ulleung-eup's highest earning potential, with monthly revenues capable of climbing to $1,877, occupancy reaching a high of 65.7%, and ADRs peaking at $146.
- Conversely, the slowest single month of the year, typically falling within the low season, marks the market's lowest point. In this month, revenue might dip to $505, occupancy could drop to 12.9%, and ADRs may adjust down to $118.
- Understanding both the seasonal averages and these monthly peaks and troughs in revenue, occupancy, and ADR is crucial for maximizing your Airbnb profit potential in Ulleung-eup.
Seasonal Strategies for Maximizing Profit
- Peak Season: Maximize revenue through premium pricing and potentially longer minimum stays. Ensure high availability.
- Low Season: Offer competitive pricing, special promotions (e.g., extended stay discounts), and flexible cancellation policies. Target off-season travelers like remote workers or budget-conscious guests.
- Shoulder Seasons: Implement dynamic pricing that balances peak and low rates. Target weekend travelers or specific events. Offer slightly more flexible terms than peak season.
- Regularly analyze your own performance against these Ulleung-eup seasonality benchmarks and adjust your pricing and availability strategy accordingly.
Best Areas for Airbnb Investment in Ulleung-eup (2025)
Exploring the top neighborhoods for short-term rentals in Ulleung-eup? This section highlights key areas, outlining why they are attractive for hosts and guests, along with notable local attractions. Consider these locations based on your target guest profile and investment strategy.
| Neighborhood / Area | Why Host Here? (Target Guests & Appeal) | Key Attractions & Landmarks |
|---|---|---|
| Dodong Beach | A beautiful and popular beach area known for its crystal-clear waters and scenic views. Ideal for travelers looking to relax by the ocean and enjoy water activities. | Dodong Beach, Ulleungdo Museum, Seonginbong Peak, Hyangmok Port, Dodong Lighthouse |
| Seonginbong Peak | The highest peak on Ulleungdo, offering stunning views and hiking opportunities. Attracts nature enthusiasts and hikers seeking adventure. | Seonginbong Hiking Trail, Observation Deck, Seonginbong Peak Summit |
| Jeodong Harbor | A picturesque harbor area that provides easy access to ferry services and beautiful seaside views. Perfect for travelers looking to explore surrounding islands. | Jeodong Harbor, Ulleungdo Ferry Terminal, Nearby seafood restaurants, Seaside walking path |
| Hyangmok Port | A scenic port area known for its traditional fishing culture and fresh seafood. Great for visitors wanting to experience local lifestyles and maritime activities. | Hyangmok Port, Local fish markets, Seaside restaurants, Fishing boat tours |
| Nari Basin | A unique geographical area rich in biodiversity with beautiful landscapes. Ideal for eco-tourism and nature lovers. | Nari Basin Nature Reserve, Trekking paths, Bird watching opportunities |
| Ulleungdo Nature Park | A national park showcasing the island's stunning natural beauty and wildlife. Perfect for those who appreciate outdoor adventures and photography. | Ulleungdo Nature Park Trails, Flora and fauna diversity, Scenic viewpoints |
| Jukdo Island | A small, uninhabited island near Ulleungdo known for its natural beauty and tranquility. Ideal for day trips and nature exploration. | Jukdo Island Walking Trails, Secluded beaches, Bird watching |
| UlLungdo Lighthouse | An iconic lighthouse offering panoramic views of the surrounding waters and coastline. Popular for sunset views and photography. | Ulleungdo Lighthouse, Viewing platform, Scenic picnic areas |
Understanding Airbnb License Requirements & STR Laws in Ulleung-eup (2025)
With 11% of listings showing registration in 2025, understanding potential Airbnb license requirements is crucial in Ulleung-eup. Always verify the latest short term rental regulations and Airbnb license requirements directly with local government authorities for Ulleung-eup to ensure full compliance before hosting.
(Source: AirROI data, 2025, based on 11% licensed listings)
Top Performing Airbnb Properties in Ulleung-eup (2025)
Benchmark your potential! Explore examples of top-performing Airbnb properties in Ulleung-eupbased on Trailing Twelve Month (TTM) revenue. Analyze their characteristics, revenue, occupancy rate, and ADR to understand what drives success in this market.
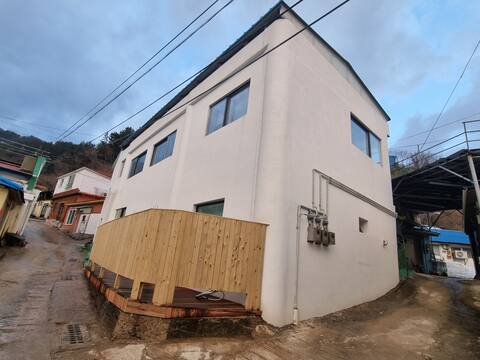
Soave, Jeodong, Family Accommodation, 2nd floor of a detached house, up to 8 people, emotional accom
Entire Place • 2 bedrooms
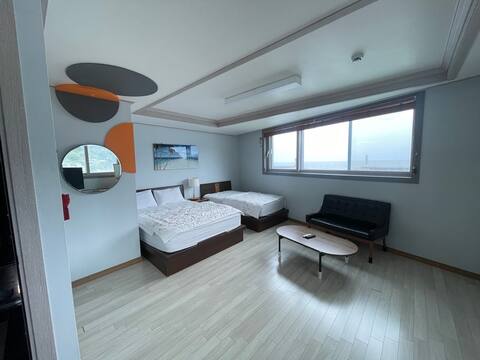
Clean and cozy accommodation in Ulleungdo Family Room Queen 1, Super Single 1
Private Room • N/A

Ulleung Jun Guest House
Entire Place • 4 bedrooms
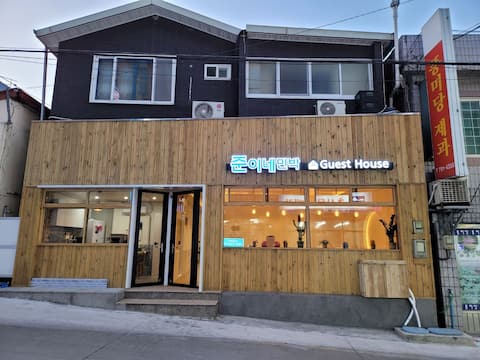
Room 103 Junine Bed & Breakfastguest house
Private Room • N/A
102호 준이네민박 guest house
Private Room • 1 bedroom
Room101 Junine Bed and Breakfast guest house
Private Room • N/A
Note: Performance varies based on location, size, amenities, seasonality, and management quality. Data reflects the past 12 months.
Top Performing Airbnb Hosts in Ulleung-eup (2025)
Learn from the best! This table showcases top-performing Airbnb hosts in Ulleung-eup based on the number of properties managed and estimated total revenue over the past year. Analyze their scale and performance metrics.
| Host Name | Properties | Grossing Revenue | Stay Reviews | Avg Rating |
|---|---|---|---|---|
| 하영 | 8 | $100,521 | 97 | 4.31/5.0 |
| Jitae | 1 | $31,266 | 64 | 4.97/5.0 |
| Onda | 3 | $23,338 | 3 | 1.67/5.0 |
| Onda | 1 | $19,596 | 5 | 4.80/5.0 |
| 영미 | 1 | $7,461 | 26 | 4.58/5.0 |
| 정애 | 1 | $6,948 | 5 | 4.80/5.0 |
| 정애 | 1 | $4,119 | 3 | 3.00/5.0 |
| Host #148746921 | 1 | $3,891 | 0 | 0.00/5.0 |
| Host #368208048 | 1 | $2,896 | 0 | 0.00/5.0 |
| Host #290484375 | 1 | $2,317 | 44 | 4.64/5.0 |
Analyzing the strategies of top hosts, such as their property selection, pricing, and guest communication, can offer valuable lessons for optimizing your own Airbnb operations in Ulleung-eup.
Dive Deeper: Advanced Ulleung-eup STR Market Data (2025)
Ready to unlock more insights? AirROI provides access to advanced metrics and comprehensive Airbnb data for Ulleung-eup. Explore detailed analytics beyond this report to refine your investment strategy, optimize pricing, and maximize your vacation rental profits.
Explore Advanced MetricsUlleung-eup Short-Term Rental Market Composition (2025): Property & Room Types
Room Type Distribution
Property Type Distribution
Market Composition Insights for Ulleung-eup
- The Ulleung-eup Airbnb market composition is heavily skewed towards Private Room listings, which make up 47.4% of the 19 active rentals. This indicates strong guest preference for privacy and space.
- Looking at the property type distribution in Ulleung-eup, House properties are the most common (73.7%), reflecting the local real estate landscape.
- Houses represent a significant 73.7% portion, catering likely to families or larger groups.
- The presence of 26.3% Hotel/Boutique listings indicates integration with traditional hospitality.
Ulleung-eup Airbnb Room Capacity Analysis (2025): Bedroom Distribution
Distribution of Listings by Number of Bedrooms
Room Capacity Insights for Ulleung-eup
- The dominant room capacity in Ulleung-eup is 1 bedroom listings, making up 31.6% of the market. This suggests a strong demand for properties suitable for couples or solo travelers.
- Together, 1 bedroom and 2 bedrooms properties represent 42.1% of the active Airbnb listings in Ulleung-eup, indicating a high concentration in these sizes.
Ulleung-eup Vacation Rental Guest Capacity Trends (2025)
Distribution of Listings by Guest Capacity
Guest Capacity Insights for Ulleung-eup
- The most common guest capacity trend in Ulleung-eup vacation rentals is listings accommodating 4 guests (26.3%). This suggests the primary traveler segment is likely small families or groups.
- Properties designed for 4 guests and 8+ guests dominate the Ulleung-eup STR market, accounting for 42.1% of listings.
- 26.3% of properties accommodate 6+ guests, serving the market segment for larger families or group travel in Ulleung-eup.
- On average, properties in Ulleung-eup are equipped to host 3.4 guests.
Ulleung-eup Airbnb Booking Patterns (2025): Available vs. Booked Days
Available Days Distribution
Booked Days Distribution
Booking Pattern Insights for Ulleung-eup
- The most common availability pattern in Ulleung-eup falls within the 271-366 days range, representing 52.6% of listings. This suggests many properties have significant open periods on their calendars.
- Approximately 84.2% of listings show high availability (181+ days open annually), indicating potential for increased bookings or specific owner usage patterns.
- For booked days, the 91-180 days range is most frequent in Ulleung-eup (31.6%), reflecting common guest stay durations or potential owner blocking patterns.
- A notable 21.1% of properties secure long booking periods (181+ days booked per year), highlighting successful long-term rental strategies or significant owner usage.
Ulleung-eup Airbnb Minimum Stay Requirements Analysis
Distribution of Listings by Minimum Night Requirement
1 Night
13 listings
72.2% of total
2 Nights
4 listings
22.2% of total
7-29 Nights
1 listings
5.6% of total
Key Insights
- The most prevalent minimum stay requirement in Ulleung-eup is 1 Night, adopted by 72.2% of listings. This highlights the market's preference for shorter, flexible bookings.
- A strong majority (94.4%) of the Ulleung-eup Airbnb data shows acceptance of very short stays (1-2 nights), indicating a dynamic, high-turnover market.
Recommendations
- Align with the market by considering a 1 Night minimum stay, as 72.2% of Ulleung-eup hosts use this setting.
- Adjust minimum nights based on seasonality – potentially shorter during low season and longer during peak demand periods in Ulleung-eup.
Ulleung-eup Airbnb Cancellation Policy Trends Analysis (2025)
Moderate
4 listings
28.6% of total
Firm
1 listings
7.1% of total
Strict
9 listings
64.3% of total
Cancellation Policy Insights for Ulleung-eup
- The prevailing Airbnb cancellation policy trend in Ulleung-eup is Strict, used by 64.3% of listings.
- A majority (71.4%) of hosts in Ulleung-eup utilize Firm or Strict policies, indicating a market where hosts prioritize booking security.
Recommendations for Hosts
- Consider adopting a Strict policy to align with the 64.3% market standard in Ulleung-eup.
- With 64.3% using Strict terms, this is a viable option in Ulleung-eup, particularly for high-value properties or during peak demand periods.
- Regularly review your cancellation policy against competitors and market demand shifts in Ulleung-eup.
Ulleung-eup STR Booking Lead Time Analysis (2025)
Average Booking Lead Time by Month
Booking Lead Time Insights for Ulleung-eup
- The overall average booking lead time for vacation rentals in Ulleung-eup is 22 days.
- Guests book furthest in advance for stays during July (average 52 days), likely coinciding with peak travel demand or local events.
- The shortest booking windows occur for stays in March (average 15 days), indicating more last-minute travel plans during this time.
- Seasonally, Summer (41 days avg.) sees the longest lead times, while Fall (20 days avg.) has the shortest, reflecting typical travel planning cycles.
Recommendations for Hosts
- Use the overall average lead time (22 days) as a baseline for your pricing and availability strategy in Ulleung-eup.
- For July stays, consider implementing length-of-stay discounts or slightly higher rates for bookings made less than 52 days out to capitalize on advance planning.
- Target marketing efforts for the Summer season well in advance (at least 41 days) to capture early planners.
- Monitor your own booking lead times against these Ulleung-eup averages to identify opportunities for dynamic pricing adjustments.
Popular & Essential Airbnb Amenities in Ulleung-eup (2025)
Amenity Prevalence
Amenity Insights for Ulleung-eup
- Essential amenities in Ulleung-eup that guests expect include: Fire extinguisher, Heating, TV, Wifi, Hot water, Air conditioning, Smoke alarm. Lacking these (any) could significantly impact bookings.
- Popular amenities like Essentials, Hair dryer, Shampoo are common but not universal. Offering these can provide a competitive edge.
Recommendations for Hosts
- Ensure your listing includes all essential amenities for Ulleung-eup: Fire extinguisher, Heating, TV, Wifi, Hot water, Air conditioning, Smoke alarm.
- Consider adding popular differentiators like Essentials or Hair dryer to increase appeal.
- Highlight unique or less common amenities you offer (e.g., hot tub, dedicated workspace, EV charger) in your listing description and photos.
- Regularly check competitor amenities in Ulleung-eup to stay competitive.
Ulleung-eup Airbnb Guest Demographics & Profile Analysis (2025)
Guest Profile Summary for Ulleung-eup
- The typical guest profile for Airbnb in Ulleung-eup consists of primarily domestic travelers (87%), often arriving from nearby Seoul, typically belonging to the Post-2000s (Gen Z/Alpha) group (50%), primarily speaking Korean or English.
- Domestic travelers account for 87.1% of guests.
- Key international markets include South Korea (87.1%) and United States (6.5%).
- Top languages spoken are Korean (66.7%) followed by English (28.6%).
- A significant demographic segment is the Post-2000s (Gen Z/Alpha) group, representing 50% of guests.
Recommendations for Hosts
- Target domestic marketing efforts towards travelers from Seoul and Daegu.
- Tailor amenities and listing descriptions to appeal to the dominant Post-2000s (Gen Z/Alpha) demographic (e.g., highlight fast WiFi, smart home features, local guides).
- Highlight unique local experiences or amenities relevant to the primary guest profile.
- Consider seasonal promotions aligned with peak travel times for key origin markets.
Nearby Short-Term Rental Market Comparison
How does the Ulleung-eup Airbnb market stack up against its neighbors? Compare key performance metrics like average monthly revenue, ADR, and occupancy rates in surrounding areas to understand the broader regional STR landscape.
| Market | Active Properties | Monthly Revenue | Daily Rate | Avg. Occupancy |
|---|---|---|---|---|
| Pyeonghae-eup | 13 | $1,214 | $180.17 | 25% |
| Yeongdeok-eup | 10 | $1,142 | $125.74 | 28% |
| Jeodong-ri | 10 | $870 | $143.25 | 25% |
| Pohang-si | 535 | $835 | $133.70 | 29% |
| Buk-myeon | 11 | $787 | $141.21 | 32% |
| Donghae-si | 208 | $775 | $127.78 | 29% |
| Yeonghae-myeon | 15 | $766 | $114.03 | 23% |
| Chuksan-myeon | 16 | $720 | $141.39 | 19% |
| Geunnam-myeon | 16 | $701 | $179.35 | 16% |
| Pacheon-myeon | 10 | $618 | $83.12 | 21% |