Sangju-si Airbnb Market Analysis 2025: Short Term Rental Data & Vacation Rental Statistics in North Gyeongsang, South Korea
Is Airbnb profitable in Sangju-si in 2025? Explore comprehensive Airbnb analytics for Sangju-si, North Gyeongsang, South Korea to uncover income potential. This 2025 STR market report for Sangju-si, based on AirROI data from June 2024 to May 2025, reveals key trends in the niche market of 35 active listings.
Whether you're considering an Airbnb investment in Sangju-si, optimizing your existing vacation rental, or exploring rental arbitrage opportunities, understanding the Sangju-si Airbnb data is crucial. Understanding the local regulations is key to maximizing your short term rental income potential. Let's dive into the specifics.
Key Sangju-si Airbnb Performance Metrics Overview
Monthly Airbnb Revenue Variations & Income Potential in Sangju-si (2025)
Understanding the monthly revenue variations for Airbnb listings in Sangju-si is key to maximizing your short term rental income potential. Seasonality significantly impacts earnings. Our analysis, based on data from the past 12 months, shows that the peak revenue month for STRs in Sangju-si is typically July, while June often presents the lowest earnings, highlighting opportunities for strategic pricing adjustments during shoulder and low seasons. Explore the typical Airbnb income in Sangju-si across different performance tiers:
- Best-in-class properties (Top 10%) achieve $2,312+ monthly, often utilizing dynamic pricing and superior guest experiences.
- Strong performing properties (Top 25%) earn $1,454 or more, indicating effective management and desirable locations/amenities.
- Typical properties (Median) generate around $580 per month, representing the average market performance.
- Entry-level properties (Bottom 25%) see earnings around $286, often with potential for optimization.
Average Monthly Airbnb Earnings Trend in Sangju-si
Sangju-si Airbnb Occupancy Rate Trends (2025)
Maximize your bookings by understanding the Sangju-si STR occupancy trends. Seasonal demand shifts significantly influence how often properties are booked. Typically, Augustsees the highest demand (peak season occupancy), while June experiences the lowest (low season). Effective strategies, like adjusting minimum stays or offering promotions, can boost occupancy during slower periods. Here's how different property tiers perform in Sangju-si:
- Best-in-class properties (Top 10%) achieve 37%+ occupancy, indicating high desirability and potentially optimized availability.
- Strong performing properties (Top 25%) maintain 22% or higher occupancy, suggesting good market fit and guest satisfaction.
- Typical properties (Median) have an occupancy rate around 13%.
- Entry-level properties (Bottom 25%) average 7% occupancy, potentially facing higher vacancy.
Average Monthly Occupancy Rate Trend in Sangju-si
Average Daily Rate (ADR) Airbnb Trends in Sangju-si (2025)
Effective short term rental pricing strategy in Sangju-si involves understanding monthly ADR fluctuations. The Average Daily Rate (ADR) for Airbnb in Sangju-si typically peaks in July and dips lowest during April. Leveraging Airbnb dynamic pricing tools or strategies based on this seasonality can significantly boost revenue. Here's a look at the typical nightly rates achieved:
- Best-in-class properties (Top 10%) command rates of $340+ per night, often due to premium features or locations.
- Strong performing properties (Top 25%) achieve nightly rates of $259 or more.
- Typical properties (Median) charge around $135 per night.
- Entry-level properties (Bottom 25%) earn around $90 per night.
Average Daily Rate (ADR) Trend by Month in Sangju-si
Get Live Sangju-si Market Intelligence 👇

Explore Real-time Analytics
Airbnb Seasonality Analysis & Trends in Sangju-si (2025)
Peak Season (July, August, March)
- Revenue averages $1,366 per month
- Occupancy rates average 20.1%
- Daily rates average $184
Shoulder Season
- Revenue averages $1,048 per month
- Occupancy maintains around 18.3%
- Daily rates hold near $173
Low Season (April, June, November)
- Revenue drops to average $732 per month
- Occupancy decreases to average 12.7%
- Daily rates adjust to average $176
Seasonality Insights for Sangju-si
- The Airbnb seasonality in Sangju-si shows highly seasonal trends requiring careful strategy. While the sections above show seasonal averages, it's also insightful to look at the extremes:
- During the high season, the absolute peak month showcases Sangju-si's highest earning potential, with monthly revenues capable of climbing to $1,487, occupancy reaching a high of 21.0%, and ADRs peaking at $197.
- Conversely, the slowest single month of the year, typically falling within the low season, marks the market's lowest point. In this month, revenue might dip to $654, occupancy could drop to 8.0%, and ADRs may adjust down to $155.
- Understanding both the seasonal averages and these monthly peaks and troughs in revenue, occupancy, and ADR is crucial for maximizing your Airbnb profit potential in Sangju-si.
Seasonal Strategies for Maximizing Profit
- Peak Season: Maximize revenue through premium pricing and potentially longer minimum stays. Ensure high availability.
- Low Season: Offer competitive pricing, special promotions (e.g., extended stay discounts), and flexible cancellation policies. Target off-season travelers like remote workers or budget-conscious guests.
- Shoulder Seasons: Implement dynamic pricing that balances peak and low rates. Target weekend travelers or specific events. Offer slightly more flexible terms than peak season.
- Regularly analyze your own performance against these Sangju-si seasonality benchmarks and adjust your pricing and availability strategy accordingly.
Best Areas for Airbnb Investment in Sangju-si (2025)
Exploring the top neighborhoods for short-term rentals in Sangju-si? This section highlights key areas, outlining why they are attractive for hosts and guests, along with notable local attractions. Consider these locations based on your target guest profile and investment strategy.
| Neighborhood / Area | Why Host Here? (Target Guests & Appeal) | Key Attractions & Landmarks |
|---|---|---|
| Sangju City Center | Main hub of Sangju-si, providing easy access to shops, restaurants, and public transportation. Ideal for travelers wanting to explore the city. | Sangju Traditional Market, Sangju Culture and Arts Center, Sangju Park, Sangju City Museum, Sangju Civic Center |
| Sangju Lake Park | A peaceful area surrounded by nature and recreational activities. Attracts families and nature lovers. | Sangju Lake, Bike trails, Picnic areas, Wildlife observation, Walking trails |
| Seongnae Waterfall | A beautiful natural attraction that draws visitors for hiking and sightseeing. Great for those who enjoy outdoor activities. | Seongnae Waterfall, Hiking trails, Natural scenery, Photography spots, Cultural sites nearby |
| Goryeong Daejeon Shrine | Historic site significant to Korean culture and history. Appeals to tourists interested in heritage and culture. | Goryeong Daejeon Shrine, Walking paths, Cultural festivals, Local history museums, Traditional performances |
| Hwaeomsa Temple | A serene Buddhist temple attracting visitors for meditation and cultural experiences. Ideal for spiritual and cultural tourism. | Hwaeomsa Temple, Buddhist ceremonies, Natural surroundings, Cultural workshops, Scenic views |
| Bonghwangdae Observatory | An excellent viewpoint for both locals and tourists to enjoy the vistas of Sangju. Great for photography and relaxation. | Bonghwangdae view, Scenic lookout trails, Educational information center, Rest areas, Picnic spots |
| Sangju Sports Park | A modern sports facility hosting various events and activities. Suitable for active tourists and sports enthusiasts. | Sports complexes, Event arenas, Walking paths, Green spaces, Community events |
| Cheongdo Wine Tunnel | Unique attraction offering a taste of local wine culture. Attracts wine enthusiasts and tourists looking for local experiences. | Wine tasting tours, Cultural exhibitions, Local wine production, Historical displays, Dining options |
Understanding Airbnb License Requirements & STR Laws in Sangju-si (2025)
With 20% of listings showing registration in 2025, understanding potential Airbnb license requirements is crucial in Sangju-si. Always verify the latest short term rental regulations and Airbnb license requirements directly with local government authorities for Sangju-si to ensure full compliance before hosting.
(Source: AirROI data, 2025, based on 20% licensed listings)
Top Performing Airbnb Properties in Sangju-si (2025)
Benchmark your potential! Explore examples of top-performing Airbnb properties in Sangju-sibased on Trailing Twelve Month (TTM) revenue. Analyze their characteristics, revenue, occupancy rate, and ADR to understand what drives success in this market.

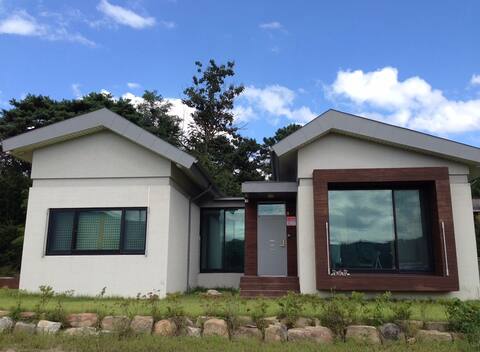
60 pyeong healing villa quiet relaxation of a private family, a different space of various groups
Entire Place • 4 bedrooms
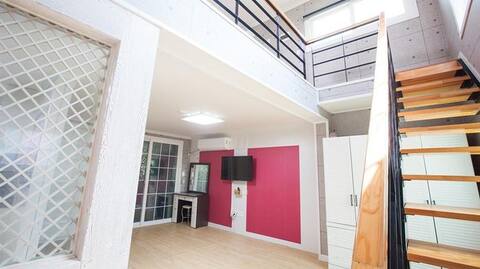
A pretty house in resident
Entire Place • 2 bedrooms
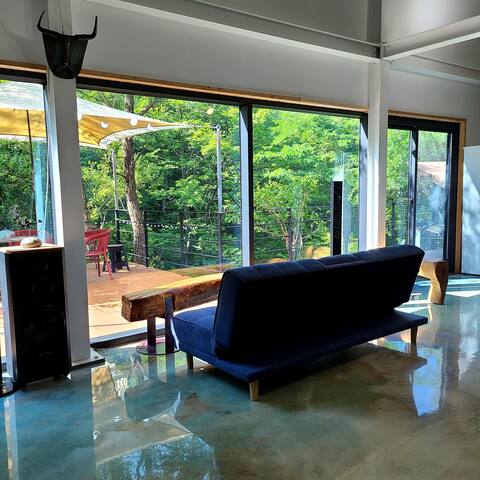
A small atelier in the valley
Entire Place • 2 bedrooms
Skyland Bed & Breakfast
Entire Place • 3 bedrooms
즐거운 하루를 보낼 수 있는 객실, 사랑향기
Entire Place • 1 bedroom

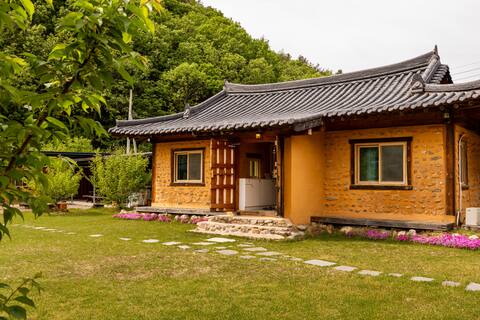
Cheongpungdang; Hanok Bed and Breakfast/Dog Friendly/Private House/Family Gathering
Entire Place • N/A
Note: Performance varies based on location, size, amenities, seasonality, and management quality. Data reflects the past 12 months.
Top Performing Airbnb Hosts in Sangju-si (2025)
Learn from the best! This table showcases top-performing Airbnb hosts in Sangju-si based on the number of properties managed and estimated total revenue over the past year. Analyze their scale and performance metrics.
| Host Name | Properties | Grossing Revenue | Stay Reviews | Avg Rating |
|---|---|---|---|---|
| Yongsoo | 1 | $56,420 | 132 | 4.92/5.0 |
| Ddnayo | 6 | $47,702 | 1 | N/A/5.0 |
| 상글 | 1 | $32,549 | 62 | 4.77/5.0 |
| 선향 | 1 | $29,915 | 55 | 5.00/5.0 |
| 경옥 | 1 | $19,789 | 158 | 4.92/5.0 |
| Host #389227771 | 4 | $18,868 | 0 | N/A/5.0 |
| Host #457382122 | 3 | $18,730 | 0 | N/A/5.0 |
| Ddnayo | 6 | $17,905 | 0 | N/A/5.0 |
| 민찬 | 1 | $16,699 | 64 | 4.92/5.0 |
| 은진 | 1 | $15,711 | 78 | 4.86/5.0 |
Analyzing the strategies of top hosts, such as their property selection, pricing, and guest communication, can offer valuable lessons for optimizing your own Airbnb operations in Sangju-si.
Dive Deeper: Advanced Sangju-si STR Market Data (2025)
Ready to unlock more insights? AirROI provides access to advanced metrics and comprehensive Airbnb data for Sangju-si. Explore detailed analytics beyond this report to refine your investment strategy, optimize pricing, and maximize your vacation rental profits.
Explore Advanced MetricsSangju-si Short-Term Rental Market Composition (2025): Property & Room Types
Room Type Distribution
Property Type Distribution
Market Composition Insights for Sangju-si
- The Sangju-si Airbnb market composition is heavily skewed towards Entire Home/Apt listings, which make up 74.3% of the 35 active rentals. This indicates strong guest preference for privacy and space.
- Looking at the property type distribution in Sangju-si, Hotel/Boutique properties are the most common (54.3%), reflecting the local real estate landscape.
- Houses represent a significant 42.9% portion, catering likely to families or larger groups.
- The presence of 54.3% Hotel/Boutique listings indicates integration with traditional hospitality.
- Smaller segments like unique stays (combined 2.9%) offer potential for unique stay experiences.
Sangju-si Airbnb Room Capacity Analysis (2025): Bedroom Distribution
Distribution of Listings by Number of Bedrooms
Room Capacity Insights for Sangju-si
- The dominant room capacity in Sangju-si is 1 bedroom listings, making up 48.6% of the market. This suggests a strong demand for properties suitable for couples or solo travelers.
- Together, 1 bedroom and 2 bedrooms properties represent 71.5% of the active Airbnb listings in Sangju-si, indicating a high concentration in these sizes.
- Listings with 3+ bedrooms (8.6%) represent a smaller niche, potentially indicating an underserved market for larger group accommodations in Sangju-si.
Sangju-si Vacation Rental Guest Capacity Trends (2025)
Distribution of Listings by Guest Capacity
Guest Capacity Insights for Sangju-si
- The most common guest capacity trend in Sangju-si vacation rentals is listings accommodating 8+ guests (40%). This suggests the primary traveler segment is likely larger groups.
- Properties designed for 8+ guests and 6 guests dominate the Sangju-si STR market, accounting for 57.1% of listings.
- 60.0% of properties accommodate 6+ guests, serving the market segment for larger families or group travel in Sangju-si.
- On average, properties in Sangju-si are equipped to host 5.5 guests.
Sangju-si Airbnb Booking Patterns (2025): Available vs. Booked Days
Available Days Distribution
Booked Days Distribution
Booking Pattern Insights for Sangju-si
- The most common availability pattern in Sangju-si falls within the 271-366 days range, representing 85.7% of listings. This suggests many properties have significant open periods on their calendars.
- Approximately 100.0% of listings show high availability (181+ days open annually), indicating potential for increased bookings or specific owner usage patterns.
- For booked days, the 1-30 days range is most frequent in Sangju-si (48.6%), reflecting common guest stay durations or potential owner blocking patterns.
Sangju-si Airbnb Minimum Stay Requirements Analysis
Distribution of Listings by Minimum Night Requirement
1 Night
33 listings
97.1% of total
2 Nights
1 listings
2.9% of total
Key Insights
- The most prevalent minimum stay requirement in Sangju-si is 1 Night, adopted by 97.1% of listings. This highlights the market's preference for shorter, flexible bookings.
- A strong majority (100.0%) of the Sangju-si Airbnb data shows acceptance of very short stays (1-2 nights), indicating a dynamic, high-turnover market.
Recommendations
- Align with the market by considering a 1 Night minimum stay, as 97.1% of Sangju-si hosts use this setting.
- Adjust minimum nights based on seasonality – potentially shorter during low season and longer during peak demand periods in Sangju-si.
Sangju-si Airbnb Cancellation Policy Trends Analysis (2025)
Flexible
2 listings
8.7% of total
Moderate
17 listings
73.9% of total
Firm
4 listings
17.4% of total
Cancellation Policy Insights for Sangju-si
- The prevailing Airbnb cancellation policy trend in Sangju-si is Moderate, used by 73.9% of listings.
- The market strongly favors guest-friendly terms, with 82.6% of listings offering Flexible or Moderate policies. This suggests guests in Sangju-si may expect booking flexibility.
Recommendations for Hosts
- Consider adopting a Moderate policy to align with the 73.9% market standard in Sangju-si.
- Regularly review your cancellation policy against competitors and market demand shifts in Sangju-si.
Sangju-si STR Booking Lead Time Analysis (2025)
Average Booking Lead Time by Month
Booking Lead Time Insights for Sangju-si
- The overall average booking lead time for vacation rentals in Sangju-si is 30 days.
- Guests book furthest in advance for stays during January (average 44 days), likely coinciding with peak travel demand or local events.
- The shortest booking windows occur for stays in June (average 19 days), indicating more last-minute travel plans during this time.
- Seasonally, Winter (36 days avg.) sees the longest lead times, while Summer (25 days avg.) has the shortest, reflecting typical travel planning cycles.
Recommendations for Hosts
- Use the overall average lead time (30 days) as a baseline for your pricing and availability strategy in Sangju-si.
- For January stays, consider implementing length-of-stay discounts or slightly higher rates for bookings made less than 44 days out to capitalize on advance planning.
- Target marketing efforts for the Winter season well in advance (at least 36 days) to capture early planners.
- Monitor your own booking lead times against these Sangju-si averages to identify opportunities for dynamic pricing adjustments.
Popular & Essential Airbnb Amenities in Sangju-si (2025)
Amenity Prevalence
Amenity Insights for Sangju-si
- Essential amenities in Sangju-si that guests expect include: Kitchen, Free parking on premises, Hot water, Air conditioning. Lacking these (any) could significantly impact bookings.
- Popular amenities like BBQ grill, Heating, Essentials are common but not universal. Offering these can provide a competitive edge.
- Warning: Wifi is not universally provided but is considered essential globally. Ensure reliable Wifi is offered.
Recommendations for Hosts
- Ensure your listing includes all essential amenities for Sangju-si: Kitchen, Free parking on premises, Hot water, Air conditioning.
- Consider adding popular differentiators like BBQ grill or Heating to increase appeal.
- Highlight unique or less common amenities you offer (e.g., hot tub, dedicated workspace, EV charger) in your listing description and photos.
- Regularly check competitor amenities in Sangju-si to stay competitive.
Sangju-si Airbnb Guest Demographics & Profile Analysis (2025)
Guest Profile Summary for Sangju-si
- The typical guest profile for Airbnb in Sangju-si consists of primarily domestic travelers (93%), often arriving from nearby Seoul, typically belonging to the Post-2000s (Gen Z/Alpha) group (50%), primarily speaking Korean or English.
- Domestic travelers account for 93.2% of guests.
- Key international markets include South Korea (93.2%) and Australia (1.7%).
- Top languages spoken are Korean (54.3%) followed by English (31.4%).
- A significant demographic segment is the Post-2000s (Gen Z/Alpha) group, representing 50% of guests.
Recommendations for Hosts
- Target domestic marketing efforts towards travelers from Seoul and Daegu.
- Tailor amenities and listing descriptions to appeal to the dominant Post-2000s (Gen Z/Alpha) demographic (e.g., highlight fast WiFi, smart home features, local guides).
- Highlight unique local experiences or amenities relevant to the primary guest profile.
- Consider seasonal promotions aligned with peak travel times for key origin markets.
Nearby Short-Term Rental Market Comparison
How does the Sangju-si Airbnb market stack up against its neighbors? Compare key performance metrics like average monthly revenue, ADR, and occupancy rates in surrounding areas to understand the broader regional STR landscape.
| Market | Active Properties | Monthly Revenue | Daily Rate | Avg. Occupancy |
|---|---|---|---|---|
| Wondeok-ri | 13 | $2,237 | $202.05 | 38% |
| Seorak-myeon | 11 | $1,842 | $185.73 | 34% |
| Homyeong-ri | 32 | $1,832 | $286.02 | 25% |
| Dojang-ri | 12 | $1,785 | $194.17 | 31% |
| Mugan-ri | 15 | $1,749 | $217.46 | 24% |
| Hakdong-ri | 48 | $1,733 | $245.31 | 27% |
| Mitan-myeon | 15 | $1,713 | $232.93 | 27% |
| Seorak | 11 | $1,669 | $205.64 | 29% |
| Gapcheon-myeon | 11 | $1,548 | $145.79 | 37% |
| Wonyul-ri | 22 | $1,537 | $205.90 | 27% |