Jojong Airbnb Market Analysis 2025: Short Term Rental Data & Vacation Rental Statistics in Gyeonggi, South Korea
Is Airbnb profitable in Jojong in 2025? Explore comprehensive Airbnb analytics for Jojong, Gyeonggi, South Korea to uncover income potential. This 2025 STR market report for Jojong, based on AirROI data from June 2024 to May 2025, reveals key trends in the niche market of 64 active listings.
Whether you're considering an Airbnb investment in Jojong, optimizing your existing vacation rental, or exploring rental arbitrage opportunities, understanding the Jojong Airbnb data is crucial. Leveraging the low regulation environment is key to maximizing your short term rental income potential. Let's dive into the specifics.
Key Jojong Airbnb Performance Metrics Overview
Monthly Airbnb Revenue Variations & Income Potential in Jojong (2025)
Understanding the monthly revenue variations for Airbnb listings in Jojong is key to maximizing your short term rental income potential. Seasonality significantly impacts earnings. Our analysis, based on data from the past 12 months, shows that the peak revenue month for STRs in Jojong is typically July, while April often presents the lowest earnings, highlighting opportunities for strategic pricing adjustments during shoulder and low seasons. Explore the typical Airbnb income in Jojong across different performance tiers:
- Best-in-class properties (Top 10%) achieve $2,522+ monthly, often utilizing dynamic pricing and superior guest experiences.
- Strong performing properties (Top 25%) earn $1,494 or more, indicating effective management and desirable locations/amenities.
- Typical properties (Median) generate around $672 per month, representing the average market performance.
- Entry-level properties (Bottom 25%) see earnings around $316, often with potential for optimization.
Average Monthly Airbnb Earnings Trend in Jojong
Jojong Airbnb Occupancy Rate Trends (2025)
Maximize your bookings by understanding the Jojong STR occupancy trends. Seasonal demand shifts significantly influence how often properties are booked. Typically, Januarysees the highest demand (peak season occupancy), while June experiences the lowest (low season). Effective strategies, like adjusting minimum stays or offering promotions, can boost occupancy during slower periods. Here's how different property tiers perform in Jojong:
- Best-in-class properties (Top 10%) achieve 34%+ occupancy, indicating high desirability and potentially optimized availability.
- Strong performing properties (Top 25%) maintain 26% or higher occupancy, suggesting good market fit and guest satisfaction.
- Typical properties (Median) have an occupancy rate around 16%.
- Entry-level properties (Bottom 25%) average 9% occupancy, potentially facing higher vacancy.
Average Monthly Occupancy Rate Trend in Jojong
Average Daily Rate (ADR) Airbnb Trends in Jojong (2025)
Effective short term rental pricing strategy in Jojong involves understanding monthly ADR fluctuations. The Average Daily Rate (ADR) for Airbnb in Jojong typically peaks in January and dips lowest during October. Leveraging Airbnb dynamic pricing tools or strategies based on this seasonality can significantly boost revenue. Here's a look at the typical nightly rates achieved:
- Best-in-class properties (Top 10%) command rates of $282+ per night, often due to premium features or locations.
- Strong performing properties (Top 25%) achieve nightly rates of $190 or more.
- Typical properties (Median) charge around $109 per night.
- Entry-level properties (Bottom 25%) earn around $88 per night.
Average Daily Rate (ADR) Trend by Month in Jojong
Get Live Jojong Market Intelligence 👇

Explore Real-time Analytics
Airbnb Seasonality Analysis & Trends in Jojong (2025)
Peak Season (July, August, January)
- Revenue averages $1,382 per month
- Occupancy rates average 23.3%
- Daily rates average $158
Shoulder Season
- Revenue averages $1,060 per month
- Occupancy maintains around 16.8%
- Daily rates hold near $149
Low Season (February, April, October)
- Revenue drops to average $857 per month
- Occupancy decreases to average 17.1%
- Daily rates adjust to average $151
Seasonality Insights for Jojong
- The Airbnb seasonality in Jojong shows moderate seasonality with distinct peak and low periods. While the sections above show seasonal averages, it's also insightful to look at the extremes:
- During the high season, the absolute peak month showcases Jojong's highest earning potential, with monthly revenues capable of climbing to $1,438, occupancy reaching a high of 26.1%, and ADRs peaking at $177.
- Conversely, the slowest single month of the year, typically falling within the low season, marks the market's lowest point. In this month, revenue might dip to $806, occupancy could drop to 12.3%, and ADRs may adjust down to $134.
- Understanding both the seasonal averages and these monthly peaks and troughs in revenue, occupancy, and ADR is crucial for maximizing your Airbnb profit potential in Jojong.
Seasonal Strategies for Maximizing Profit
- Peak Season: Maximize revenue through premium pricing and potentially longer minimum stays. Ensure high availability.
- Low Season: Offer competitive pricing, special promotions (e.g., extended stay discounts), and flexible cancellation policies. Target off-season travelers like remote workers or budget-conscious guests.
- Shoulder Seasons: Implement dynamic pricing that balances peak and low rates. Target weekend travelers or specific events. Offer slightly more flexible terms than peak season.
- Regularly analyze your own performance against these Jojong seasonality benchmarks and adjust your pricing and availability strategy accordingly.
Best Areas for Airbnb Investment in Jojong (2025)
Exploring the top neighborhoods for short-term rentals in Jojong? This section highlights key areas, outlining why they are attractive for hosts and guests, along with notable local attractions. Consider these locations based on your target guest profile and investment strategy.
| Neighborhood / Area | Why Host Here? (Target Guests & Appeal) | Key Attractions & Landmarks |
|---|---|---|
| Paju Book City | A famous cultural complex dedicated to publishing and literature, attracting creative individuals and tourists interested in books and culture. | Paju Book City Library, The Museum of Modern Literature, Paju English Village, Heyri Art Village, Book Street |
| Heyri Art Village | An artistic community blending residence, culture, and art, ideal for visitors interested in arts and crafts. | Art galleries, Cafés, Workshops, The Heyri Art Village Museum, Themed exhibitions |
| Gwangmyeong Cave | A unique tourist attraction that features an underground cave turned into a cultural space, drawing visitors for its beauty and cool climate. | Gwangmyeong Cave Museum, Light and Sound Show, Underground Lake, Wine Cave, Cave Lit Walkway |
| Korean Demilitarized Zone (DMZ) | An iconic historical location, this area attracts tourists seeking to understand the history and tensions of the Korean peninsula. | DMZ Tour, Third Infiltration Tunnel, Dora Observatory, Imjingak Park, The Unification Bridge |
| Seongnam’s Bundang Park | A beautiful urban park that attracts families and individuals, popular for picnics and outdoor activities. | Beautiful walking trails, Playgrounds, Seongnam Arts Center, Sports facilities |
| Namhansanseong | A UNESCO World Heritage Site with historical significance and scenic views, offering a mix of nature and history. | Namhansanseong Fortress, Hiking trails, Cultural programs, Historical buildings |
| Suwon Hwaseong Fortress | A stunning fortress that offers historical insight and scenic views, popular among both local and foreign tourists. | Hwaseong Haenggung Palace, Paldalmun Gate, Hwaseong Museum, Walking paths around the fortress |
| Yongin Everland | A large theme park that attracts families and thrill-seekers, making it a prime location for Airbnb investment due to high visitor numbers. | Everland Theme Park, Caribbean Bay Water Park, Safari World, Flower Garden |
Understanding Airbnb License Requirements & STR Laws in Jojong (2025)
While Jojong, Gyeonggi, South Korea currently shows low STR regulations, specific Airbnb license requirements might still exist or change. Always verify the latest short term rental regulations and Airbnb license requirements directly with local government authorities for Jojong to ensure full compliance before hosting.
(Source: AirROI data, 2025, based on 9% licensed listings)
Top Performing Airbnb Properties in Jojong (2025)
Benchmark your potential! Explore examples of top-performing Airbnb properties in Jojongbased on Trailing Twelve Month (TTM) revenue. Analyze their characteristics, revenue, occupancy rate, and ADR to understand what drives success in this market.

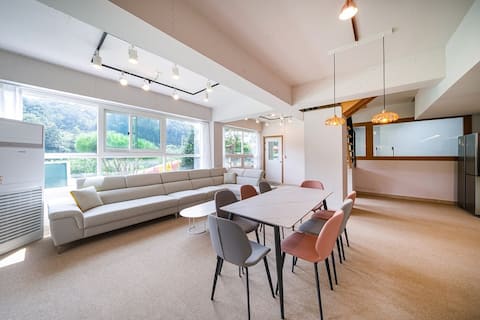
Villa-type private house Room A, a modern space with a touch of emotion
Entire Place • 5 bedrooms
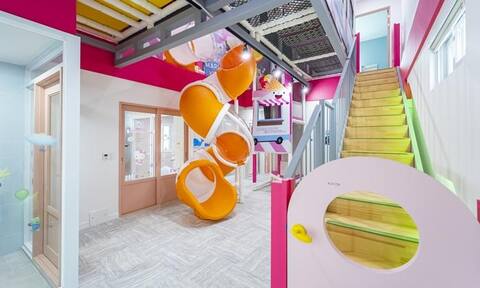
층간소음 문제 없는 프라이빗 객실, 독채 개별 키즈풀빌라 4호(투룸형,화장실2개)
Entire Place • 2 bedrooms
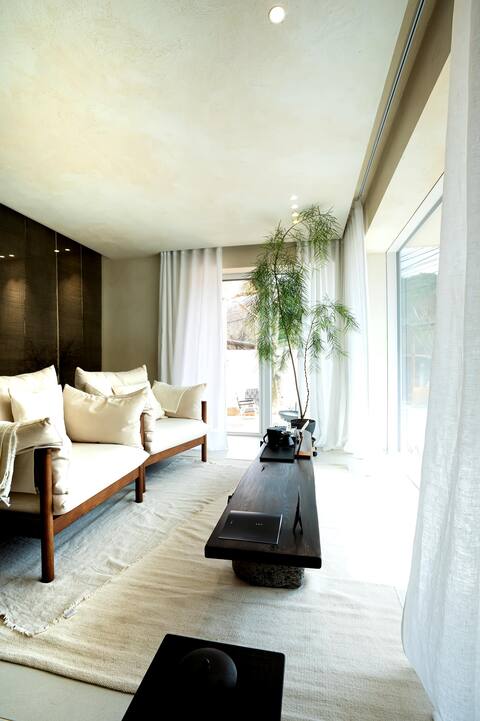
Time and space that has stopped in a busy daily life, ‘Thirty City’
Entire Place • 2 bedrooms
가평의 푸른 자연과 함께하며 쉴 수 있는 곳
Entire Place • 1 bedroom
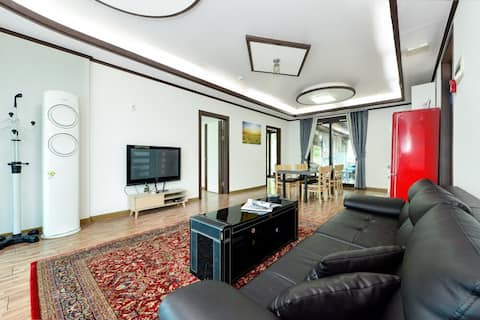
A group of accommodations where you can relax and heal in nature (all rooms in Building B)
Entire Place • 6 bedrooms

European-style home built with Unaksan as a bottle
Entire Place • 2 bedrooms
Note: Performance varies based on location, size, amenities, seasonality, and management quality. Data reflects the past 12 months.
Top Performing Airbnb Hosts in Jojong (2025)
Learn from the best! This table showcases top-performing Airbnb hosts in Jojong based on the number of properties managed and estimated total revenue over the past year. Analyze their scale and performance metrics.
| Host Name | Properties | Grossing Revenue | Stay Reviews | Avg Rating |
|---|---|---|---|---|
| Onda | 5 | $96,030 | 1 | N/A/5.0 |
| Onda | 4 | $75,208 | 4 | 4.75/5.0 |
| Host #331849838 | 15 | $68,148 | 0 | N/A/5.0 |
| Host #485114904 | 6 | $62,070 | 0 | N/A/5.0 |
| Host #458151519 | 4 | $60,279 | 1 | N/A/5.0 |
| 순옥 | 2 | $55,611 | 489 | 4.79/5.0 |
| Onda | 2 | $53,750 | 15 | 4.65/5.0 |
| Onda | 13 | $45,605 | 0 | N/A/5.0 |
| 캐빈 | 7 | $33,389 | 29 | 4.91/5.0 |
| Onda | 1 | $26,374 | 4 | 5.00/5.0 |
Analyzing the strategies of top hosts, such as their property selection, pricing, and guest communication, can offer valuable lessons for optimizing your own Airbnb operations in Jojong.
Dive Deeper: Advanced Jojong STR Market Data (2025)
Ready to unlock more insights? AirROI provides access to advanced metrics and comprehensive Airbnb data for Jojong. Explore detailed analytics beyond this report to refine your investment strategy, optimize pricing, and maximize your vacation rental profits.
Explore Advanced MetricsJojong Short-Term Rental Market Composition (2025): Property & Room Types
Room Type Distribution
Property Type Distribution
Market Composition Insights for Jojong
- The Jojong Airbnb market composition is heavily skewed towards Entire Home/Apt listings, which make up 100% of the 64 active rentals. This indicates strong guest preference for privacy and space.
- Looking at the property type distribution in Jojong, Hotel/Boutique properties are the most common (56.3%), reflecting the local real estate landscape.
- The presence of 56.3% Hotel/Boutique listings indicates integration with traditional hospitality.
Jojong Airbnb Room Capacity Analysis (2025): Bedroom Distribution
Distribution of Listings by Number of Bedrooms
Room Capacity Insights for Jojong
- The dominant room capacity in Jojong is 1 bedroom listings, making up 50% of the market. This suggests a strong demand for properties suitable for couples or solo travelers.
- Together, 1 bedroom and 2 bedrooms properties represent 76.6% of the active Airbnb listings in Jojong, indicating a high concentration in these sizes.
- Listings with 3+ bedrooms (4.7%) represent a smaller niche, potentially indicating an underserved market for larger group accommodations in Jojong.
Jojong Vacation Rental Guest Capacity Trends (2025)
Distribution of Listings by Guest Capacity
Guest Capacity Insights for Jojong
- The most common guest capacity trend in Jojong vacation rentals is listings accommodating 8+ guests (29.7%). This suggests the primary traveler segment is likely larger groups.
- Properties designed for 8+ guests and 4 guests dominate the Jojong STR market, accounting for 56.3% of listings.
- 37.5% of properties accommodate 6+ guests, serving the market segment for larger families or group travel in Jojong.
- On average, properties in Jojong are equipped to host 5.1 guests.
Jojong Airbnb Booking Patterns (2025): Available vs. Booked Days
Available Days Distribution
Booked Days Distribution
Booking Pattern Insights for Jojong
- The most common availability pattern in Jojong falls within the 271-366 days range, representing 93.8% of listings. This suggests many properties have significant open periods on their calendars.
- Approximately 100.1% of listings show high availability (181+ days open annually), indicating potential for increased bookings or specific owner usage patterns.
- For booked days, the 31-90 days range is most frequent in Jojong (57.8%), reflecting common guest stay durations or potential owner blocking patterns.
Jojong Airbnb Minimum Stay Requirements Analysis
Distribution of Listings by Minimum Night Requirement
1 Night
64 listings
100% of total
Key Insights
- The most prevalent minimum stay requirement in Jojong is 1 Night, adopted by 100% of listings. This highlights the market's preference for shorter, flexible bookings.
- A strong majority (100.0%) of the Jojong Airbnb data shows acceptance of very short stays (1-2 nights), indicating a dynamic, high-turnover market.
Recommendations
- Align with the market by considering a 1 Night minimum stay, as 100% of Jojong hosts use this setting.
- Adjust minimum nights based on seasonality – potentially shorter during low season and longer during peak demand periods in Jojong.
Jojong Airbnb Cancellation Policy Trends Analysis (2025)
Flexible
1 listings
3.3% of total
Moderate
13 listings
43.3% of total
Firm
16 listings
53.3% of total
Cancellation Policy Insights for Jojong
- The prevailing Airbnb cancellation policy trend in Jojong is Firm, used by 53.3% of listings.
- A majority (53.3%) of hosts in Jojong utilize Firm or Strict policies, indicating a market where hosts prioritize booking security.
Recommendations for Hosts
- Consider adopting a Firm policy to align with the 53.3% market standard in Jojong.
- Regularly review your cancellation policy against competitors and market demand shifts in Jojong.
Jojong STR Booking Lead Time Analysis (2025)
Average Booking Lead Time by Month
Booking Lead Time Insights for Jojong
- The overall average booking lead time for vacation rentals in Jojong is 13 days.
- Guests book furthest in advance for stays during October (average 42 days), likely coinciding with peak travel demand or local events.
- The shortest booking windows occur for stays in November (average 10 days), indicating more last-minute travel plans during this time.
- Seasonally, Fall (29 days avg.) sees the longest lead times, while Summer (15 days avg.) has the shortest, reflecting typical travel planning cycles.
Recommendations for Hosts
- Use the overall average lead time (13 days) as a baseline for your pricing and availability strategy in Jojong.
- For October stays, consider implementing length-of-stay discounts or slightly higher rates for bookings made less than 42 days out to capitalize on advance planning.
- Target marketing efforts for the Fall season well in advance (at least 29 days) to capture early planners.
- Monitor your own booking lead times against these Jojong averages to identify opportunities for dynamic pricing adjustments.
Popular & Essential Airbnb Amenities in Jojong (2025)
Amenity Prevalence
Amenity Insights for Jojong
- Essential amenities in Jojong that guests expect include: Wifi, TV, Kitchen, Air conditioning, Free parking on premises, BBQ grill, Essentials, Hot water, Heating. Lacking these (any) could significantly impact bookings.
- Popular amenities like Bed linens are common but not universal. Offering these can provide a competitive edge.
Recommendations for Hosts
- Ensure your listing includes all essential amenities for Jojong: Wifi, TV, Kitchen, Air conditioning, Free parking on premises, BBQ grill, Essentials, Hot water, Heating.
- Prioritize adding missing essentials: Essentials, Hot water, Heating.
- Consider adding popular differentiators like Bed linens to increase appeal.
- Highlight unique or less common amenities you offer (e.g., hot tub, dedicated workspace, EV charger) in your listing description and photos.
- Regularly check competitor amenities in Jojong to stay competitive.
Jojong Airbnb Guest Demographics & Profile Analysis (2025)
Guest Profile Summary for Jojong
- The typical guest profile for Airbnb in Jojong consists of primarily domestic travelers (90%), often arriving from nearby Seoul, typically belonging to the Post-2000s (Gen Z/Alpha) group (50%), primarily speaking Korean or English.
- Domestic travelers account for 89.8% of guests.
- Key international markets include South Korea (89.8%) and United States (4.1%).
- Top languages spoken are Korean (51.9%) followed by English (33.3%).
- A significant demographic segment is the Post-2000s (Gen Z/Alpha) group, representing 50% of guests.
Recommendations for Hosts
- Target domestic marketing efforts towards travelers from Seoul and Uijeongbu-si.
- Tailor amenities and listing descriptions to appeal to the dominant Post-2000s (Gen Z/Alpha) demographic (e.g., highlight fast WiFi, smart home features, local guides).
- Highlight unique local experiences or amenities relevant to the primary guest profile.
- Consider seasonal promotions aligned with peak travel times for key origin markets.
Nearby Short-Term Rental Market Comparison
How does the Jojong Airbnb market stack up against its neighbors? Compare key performance metrics like average monthly revenue, ADR, and occupancy rates in surrounding areas to understand the broader regional STR landscape.
| Market | Active Properties | Monthly Revenue | Daily Rate | Avg. Occupancy |
|---|---|---|---|---|
| Wondeok-ri | 13 | $2,237 | $202.05 | 38% |
| Seorak-myeon | 11 | $1,842 | $185.73 | 34% |
| Homyeong-ri | 32 | $1,832 | $286.02 | 25% |
| Dojang-ri | 12 | $1,785 | $194.17 | 31% |
| Mugan-ri | 15 | $1,749 | $217.46 | 24% |
| Mitan-myeon | 15 | $1,713 | $232.93 | 27% |
| Seorak | 11 | $1,669 | $205.64 | 29% |
| Gapcheon-myeon | 11 | $1,548 | $145.79 | 37% |
| Yangpyeong-gun | 14 | $1,360 | $246.73 | 27% |
| Seojong | 19 | $1,350 | $193.83 | 25% |