Mahikeng Local Municipality Airbnb Market Analysis 2025: Short Term Rental Data & Vacation Rental Statistics in North West, South Africa
Is Airbnb profitable in Mahikeng Local Municipality in 2025? Explore comprehensive Airbnb analytics for Mahikeng Local Municipality, North West, South Africa to uncover income potential. This 2025 STR market report for Mahikeng Local Municipality, based on AirROI data from April 2024 to March 2025, reveals key trends in the niche market of 19 active listings.
Whether you're considering an Airbnb investment in Mahikeng Local Municipality, optimizing your existing vacation rental, or exploring rental arbitrage opportunities, understanding the Mahikeng Local Municipality Airbnb data is crucial. Leveraging the low regulation environment is key to maximizing your short term rental income potential. Let's dive into the specifics.
Key Mahikeng Local Municipality Airbnb Performance Metrics Overview
Monthly Airbnb Revenue Variations & Income Potential in Mahikeng Local Municipality (2025)
Understanding the monthly revenue variations for Airbnb listings in Mahikeng Local Municipality is key to maximizing your short term rental income potential. Seasonality significantly impacts earnings. Our analysis, based on data from the past 12 months, shows that the peak revenue month for STRs in Mahikeng Local Municipality is typically April, while January often presents the lowest earnings, highlighting opportunities for strategic pricing adjustments during shoulder and low seasons. Explore the typical Airbnb income in Mahikeng Local Municipality across different performance tiers:
- Best-in-class properties (Top 10%) achieve $1,716+ monthly, often utilizing dynamic pricing and superior guest experiences.
- Strong performing properties (Top 25%) earn $824 or more, indicating effective management and desirable locations/amenities.
- Typical properties (Median) generate around $250 per month, representing the average market performance.
- Entry-level properties (Bottom 25%) see earnings around $152, often with potential for optimization.
Average Monthly Airbnb Earnings Trend in Mahikeng Local Municipality
Mahikeng Local Municipality Airbnb Occupancy Rate Trends (2025)
Maximize your bookings by understanding the Mahikeng Local Municipality STR occupancy trends. Seasonal demand shifts significantly influence how often properties are booked. Typically, Aprilsees the highest demand (peak season occupancy), while May experiences the lowest (low season). Effective strategies, like adjusting minimum stays or offering promotions, can boost occupancy during slower periods. Here's how different property tiers perform in Mahikeng Local Municipality:
- Best-in-class properties (Top 10%) achieve 35%+ occupancy, indicating high desirability and potentially optimized availability.
- Strong performing properties (Top 25%) maintain 21% or higher occupancy, suggesting good market fit and guest satisfaction.
- Typical properties (Median) have an occupancy rate around 13%.
- Entry-level properties (Bottom 25%) average 9% occupancy, potentially facing higher vacancy.
Average Monthly Occupancy Rate Trend in Mahikeng Local Municipality
Average Daily Rate (ADR) Airbnb Trends in Mahikeng Local Municipality (2025)
Effective short term rental pricing strategy in Mahikeng Local Municipality involves understanding monthly ADR fluctuations. The Average Daily Rate (ADR) for Airbnb in Mahikeng Local Municipality typically peaks in October and dips lowest during March. Leveraging Airbnb dynamic pricing tools or strategies based on this seasonality can significantly boost revenue. Here's a look at the typical nightly rates achieved:
- Best-in-class properties (Top 10%) command rates of $145+ per night, often due to premium features or locations.
- Strong performing properties (Top 25%) achieve nightly rates of $91 or more.
- Typical properties (Median) charge around $47 per night.
- Entry-level properties (Bottom 25%) earn around $27 per night.
Average Daily Rate (ADR) Trend by Month in Mahikeng Local Municipality
Get Live Mahikeng Local Municipality Market Intelligence 👇

Explore Real-time Analytics
Airbnb Seasonality Analysis & Trends in Mahikeng Local Municipality (2025)
Peak Season (April, May, June)
- Revenue averages $1,114 per month
- Occupancy rates average 19.9%
- Daily rates average $75
Shoulder Season
- Revenue averages $510 per month
- Occupancy maintains around 19.9%
- Daily rates hold near $65
Low Season (January, February, September)
- Revenue drops to average $246 per month
- Occupancy decreases to average 13.3%
- Daily rates adjust to average $61
Seasonality Insights for Mahikeng Local Municipality
- The Airbnb seasonality in Mahikeng Local Municipality shows highly seasonal trends requiring careful strategy. While the sections above show seasonal averages, it's also insightful to look at the extremes:
- During the high season, the absolute peak month showcases Mahikeng Local Municipality's highest earning potential, with monthly revenues capable of climbing to $1,397, occupancy reaching a high of 30.0%, and ADRs peaking at $77.
- Conversely, the slowest single month of the year, typically falling within the low season, marks the market's lowest point. In this month, revenue might dip to $191, occupancy could drop to 9.7%, and ADRs may adjust down to $53.
- Understanding both the seasonal averages and these monthly peaks and troughs in revenue, occupancy, and ADR is crucial for maximizing your Airbnb profit potential in Mahikeng Local Municipality.
Seasonal Strategies for Maximizing Profit
- Peak Season: Maximize revenue through premium pricing and potentially longer minimum stays. Ensure high availability.
- Low Season: Offer competitive pricing, special promotions (e.g., extended stay discounts), and flexible cancellation policies. Target off-season travelers like remote workers or budget-conscious guests.
- Shoulder Seasons: Implement dynamic pricing that balances peak and low rates. Target weekend travelers or specific events. Offer slightly more flexible terms than peak season.
- Regularly analyze your own performance against these Mahikeng Local Municipality seasonality benchmarks and adjust your pricing and availability strategy accordingly.
Best Areas for Airbnb Investment in Mahikeng Local Municipality (2025)
Exploring the top neighborhoods for short-term rentals in Mahikeng Local Municipality? This section highlights key areas, outlining why they are attractive for hosts and guests, along with notable local attractions. Consider these locations based on your target guest profile and investment strategy.
| Neighborhood / Area | Why Host Here? (Target Guests & Appeal) | Key Attractions & Landmarks |
|---|---|---|
| Central Mahikeng | The heart of the city with easy access to government offices, shopping centers, and local attractions. Ideal for both business travelers and tourists. | Mahikeng Game Reserve, Botswana Border Post, Mahikeng Museum, Montshioa Shopping Complex |
| Mmabatho | A vibrant township known for its rich culture and history. Popular among visitors looking to experience local traditions and events. | Banana City, Mmabatho Stadium, Local markets, Cultural Heritage Sites |
| Schoemansville | A peaceful suburb close to the nature reserves and attractions in the area. Opportunities for serene getaways and nature lovers. | Wonderboom Nature Reserve, Pietermaritzburg Botanical Gardens, Hiking trails, Camping grounds |
| Mafikeng Game Reserve | A natural reserve offering a unique safari experience. Attracts tourists interested in wildlife and outdoor activities. | Big Five Game Viewing, Bird Watching, Luxury Lodges, Photography Tours |
| Ramatlabama | A growing suburb with proximity to the South African border. Increasingly popular for short-term rentals due to cross-border travelers. | Border Post, Local eateries, Traditional craft markets |
| Molopo Nature Reserve | Known for its stunning landscapes and wildlife, perfect for eco-tourism and those seeking a retreat in nature. | Wildlife Viewing, Photography Opportunities, Nature Trails, Eco-lodges |
| Lichtenburg Road | Convenient access to the city and main transport routes. Suitable for business travelers needing quick access to South Africa's road networks. | Nearby shopping areas, Local eateries, Business centers |
| Dikgonnye Village | A rural area that offers a glimpse into traditional life in South Africa. Appeals to guests looking for authenticity and cultural immersion. | Cultural experiences, Traditional food offerings, Local festivals |
Understanding Airbnb License Requirements & STR Laws in Mahikeng Local Municipality (2025)
While Mahikeng Local Municipality, North West, South Africa currently shows low STR regulations, specific Airbnb license requirements might still exist or change. Always verify the latest short term rental regulations and Airbnb license requirements directly with local government authorities for Mahikeng Local Municipality to ensure full compliance before hosting.
(Source: AirROI data, 2025, finding no licensed listings among those analyzed)
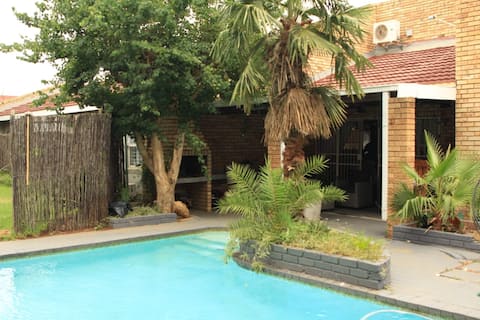
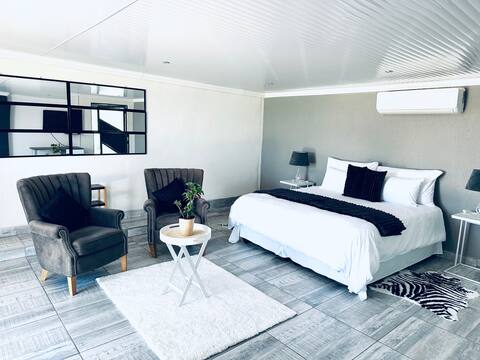
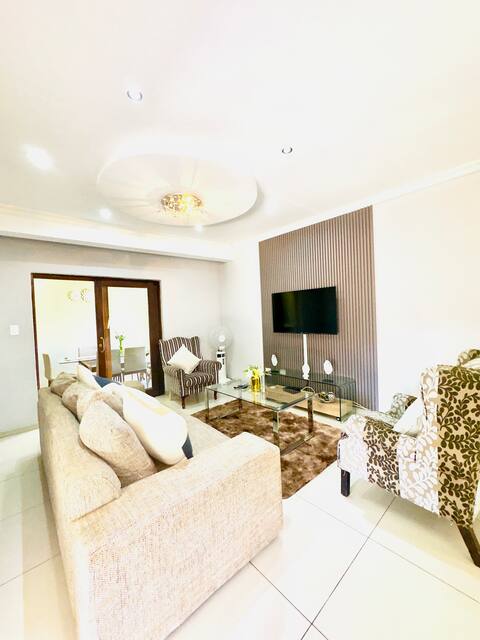
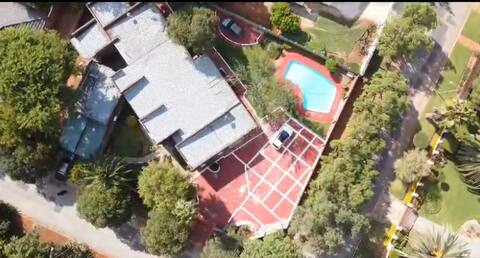
Top Performing Airbnb Properties in Mahikeng Local Municipality (2025)
Benchmark your potential! Explore examples of top-performing Airbnb properties in Mahikeng Local Municipalitybased on Trailing Twelve Month (TTM) revenue. Analyze their characteristics, revenue, occupancy rate, and ADR to understand what drives success in this market.
Cascas Groove home
Entire Place • 3 bedrooms
Diphateng Lifestyle Villa Resort
Entire Place • 1 bedroom
6526 Boiketlo Street, Golfview
Entire Place • 3 bedrooms
Thuba Segole Guest House
Private Room • 6 bedrooms

Diphateng Lifestyle Villa Resort
Private Room • 1 bedroom
Diphateng Lifestyle Villa Resort
Private Room • 1 bedroom
Note: Performance varies based on location, size, amenities, seasonality, and management quality. Data reflects the past 12 months.
Top Performing Airbnb Hosts in Mahikeng Local Municipality (2025)
Learn from the best! This table showcases top-performing Airbnb hosts in Mahikeng Local Municipality based on the number of properties managed and estimated total revenue over the past year. Analyze their scale and performance metrics.
| Host Name | Properties | Grossing Revenue | Stay Reviews | Avg Rating |
|---|---|---|---|---|
| Basetsana | 3 | $14,778 | 25 | 4.71/5.0 |
| Thandokazi | 1 | $12,925 | 6 | 4.17/5.0 |
| Puleng | 1 | $8,054 | 17 | 4.82/5.0 |
| Host #376009151 | 1 | $5,168 | 1 | 0.00/5.0 |
| Tsholanang Michelle Ruth | 2 | $3,400 | 3 | 1.00/5.0 |
| Thebe | 2 | $1,202 | 15 | 4.00/5.0 |
| Omphile | 2 | $1,144 | 34 | 4.39/5.0 |
| Host #251904522 | 1 | $945 | 0 | 0.00/5.0 |
| Senzeni | 2 | $484 | 50 | 3.89/5.0 |
| Tsholofelo | 3 | $447 | 109 | 4.70/5.0 |
Analyzing the strategies of top hosts, such as their property selection, pricing, and guest communication, can offer valuable lessons for optimizing your own Airbnb operations in Mahikeng Local Municipality.
Dive Deeper: Advanced Mahikeng Local Municipality STR Market Data (2025)
Ready to unlock more insights? AirROI provides access to advanced metrics and comprehensive Airbnb data for Mahikeng Local Municipality. Explore detailed analytics beyond this report to refine your investment strategy, optimize pricing, and maximize your vacation rental profits.
Explore Advanced MetricsMahikeng Local Municipality Short-Term Rental Market Composition (2025): Property & Room Types
Room Type Distribution
Property Type Distribution
Market Composition Insights for Mahikeng Local Municipality
- The Mahikeng Local Municipality Airbnb market composition is heavily skewed towards Private Room listings, which make up 63.2% of the 19 active rentals. This indicates strong guest preference for privacy and space.
- Looking at the property type distribution in Mahikeng Local Municipality, House properties are the most common (42.1%), reflecting the local real estate landscape.
- Houses represent a significant 42.1% portion, catering likely to families or larger groups.
Mahikeng Local Municipality Airbnb Room Capacity Analysis (2025): Bedroom Distribution
Distribution of Listings by Number of Bedrooms
Room Capacity Insights for Mahikeng Local Municipality
- The dominant room capacity in Mahikeng Local Municipality is 1 bedroom listings, making up 47.4% of the market. This suggests a strong demand for properties suitable for couples or solo travelers.
- Together, 1 bedroom and 3 bedrooms properties represent 63.2% of the active Airbnb listings in Mahikeng Local Municipality, indicating a high concentration in these sizes.
- A significant 21.1% of listings offer 3+ bedrooms, catering to larger groups and families seeking more space in Mahikeng Local Municipality.
Mahikeng Local Municipality Vacation Rental Guest Capacity Trends (2025)
Distribution of Listings by Guest Capacity
Guest Capacity Insights for Mahikeng Local Municipality
- The most common guest capacity trend in Mahikeng Local Municipality vacation rentals is listings accommodating 2 guests (52.6%). This suggests the primary traveler segment is likely couples or solo travelers.
- Properties designed for 2 guests and 6 guests dominate the Mahikeng Local Municipality STR market, accounting for 68.4% of listings.
- A significant 52.6% of listings cater specifically to 1-2 guests, highlighting strong demand from couples and solo travelers in Mahikeng Local Municipality.
- 15.8% of properties accommodate 6+ guests, serving the market segment for larger families or group travel in Mahikeng Local Municipality.
- On average, properties in Mahikeng Local Municipality are equipped to host 2.2 guests.
Mahikeng Local Municipality Airbnb Booking Patterns (2025): Available vs. Booked Days
Available Days Distribution
Booked Days Distribution
Booking Pattern Insights for Mahikeng Local Municipality
- The most common availability pattern in Mahikeng Local Municipality falls within the 271-366 days range, representing 84.2% of listings. This suggests many properties have significant open periods on their calendars.
- Approximately 100.0% of listings show high availability (181+ days open annually), indicating potential for increased bookings or specific owner usage patterns.
- For booked days, the 1-30 days range is most frequent in Mahikeng Local Municipality (63.2%), reflecting common guest stay durations or potential owner blocking patterns.
Mahikeng Local Municipality Airbnb Minimum Stay Requirements Analysis
Distribution of Listings by Minimum Night Requirement
1 Night
18 listings
94.7% of total
2 Nights
1 listings
5.3% of total
Key Insights
- The most prevalent minimum stay requirement in Mahikeng Local Municipality is 1 Night, adopted by 94.7% of listings. This highlights the market's preference for shorter, flexible bookings.
- A strong majority (100.0%) of the Mahikeng Local Municipality Airbnb data shows acceptance of very short stays (1-2 nights), indicating a dynamic, high-turnover market.
Recommendations
- Align with the market by considering a 1 Night minimum stay, as 94.7% of Mahikeng Local Municipality hosts use this setting.
- Adjust minimum nights based on seasonality – potentially shorter during low season and longer during peak demand periods in Mahikeng Local Municipality.
Mahikeng Local Municipality Airbnb Cancellation Policy Trends Analysis (2025)
Refundable
1 listings
6.3% of total
Non-refundable
1 listings
6.3% of total
Flexible
11 listings
68.8% of total
Moderate
2 listings
12.5% of total
Firm
1 listings
6.3% of total
Cancellation Policy Insights for Mahikeng Local Municipality
- The prevailing Airbnb cancellation policy trend in Mahikeng Local Municipality is Flexible, used by 68.8% of listings.
- The market strongly favors guest-friendly terms, with 81.3% of listings offering Flexible or Moderate policies. This suggests guests in Mahikeng Local Municipality may expect booking flexibility.
Recommendations for Hosts
- Consider adopting a Flexible policy to align with the 68.8% market standard in Mahikeng Local Municipality.
- Given the high prevalence of Flexible policies (68.8%), offering this can enhance booking appeal, especially during shoulder seasons.
- Regularly review your cancellation policy against competitors and market demand shifts in Mahikeng Local Municipality.
Mahikeng Local Municipality STR Booking Lead Time Analysis (2025)
Average Booking Lead Time by Month
Booking Lead Time Insights for Mahikeng Local Municipality
- The overall average booking lead time for vacation rentals in Mahikeng Local Municipality is 18 days.
- Guests book furthest in advance for stays during June (average 61 days), likely coinciding with peak travel demand or local events.
- The shortest booking windows occur for stays in May (average 0 days), indicating more last-minute travel plans during this time.
- Seasonally, Fall (27 days avg.) sees the longest lead times, while Spring (13 days avg.) has the shortest, reflecting typical travel planning cycles.
Recommendations for Hosts
- Use the overall average lead time (18 days) as a baseline for your pricing and availability strategy in Mahikeng Local Municipality.
- For June stays, consider implementing length-of-stay discounts or slightly higher rates for bookings made less than 61 days out to capitalize on advance planning.
- During May, focus on last-minute booking availability and promotions, as guests book with very short notice (0 days avg.).
- Target marketing efforts for the Fall season well in advance (at least 27 days) to capture early planners.
- Monitor your own booking lead times against these Mahikeng Local Municipality averages to identify opportunities for dynamic pricing adjustments.
Popular & Essential Airbnb Amenities in Mahikeng Local Municipality (2025)
Amenity Prevalence
Amenity Insights for Mahikeng Local Municipality
- Essential amenities in Mahikeng Local Municipality that guests expect include: Free parking on premises. Lacking these (this) could significantly impact bookings.
- Popular amenities like Iron, TV, BBQ grill are common but not universal. Offering these can provide a competitive edge.
- Warning: Wifi is not universally provided but is considered essential globally. Ensure reliable Wifi is offered.
Recommendations for Hosts
- Ensure your listing includes all essential amenities for Mahikeng Local Municipality: Free parking on premises.
- Consider adding popular differentiators like Iron or TV to increase appeal.
- Highlight unique or less common amenities you offer (e.g., hot tub, dedicated workspace, EV charger) in your listing description and photos.
- Regularly check competitor amenities in Mahikeng Local Municipality to stay competitive.
Mahikeng Local Municipality Airbnb Guest Demographics & Profile Analysis (2025)
Guest Profile Summary for Mahikeng Local Municipality
- The typical guest profile for Airbnb in Mahikeng Local Municipality consists of primarily domestic travelers (79%), often arriving from nearby Johannesburg, typically belonging to the Post-2000s (Gen Z/Alpha) group (50%), primarily speaking English or Afrikaans.
- Domestic travelers account for 78.6% of guests.
- Key international markets include South Africa (78.6%) and Botswana (7.1%).
- Top languages spoken are English (77.3%) followed by Afrikaans (13.6%).
- A significant demographic segment is the Post-2000s (Gen Z/Alpha) group, representing 50% of guests.
Recommendations for Hosts
- Target domestic marketing efforts towards travelers from Johannesburg and Johannesburg South.
- Tailor amenities and listing descriptions to appeal to the dominant Post-2000s (Gen Z/Alpha) demographic (e.g., highlight fast WiFi, smart home features, local guides).
- Highlight unique local experiences or amenities relevant to the primary guest profile.
- Consider seasonal promotions aligned with peak travel times for key origin markets.
Nearby Short-Term Rental Market Comparison
How does the Mahikeng Local Municipality Airbnb market stack up against its neighbors? Compare key performance metrics like average monthly revenue, ADR, and occupancy rates in surrounding areas to understand the broader regional STR landscape.
| Market | Active Properties | Monthly Revenue | Daily Rate | Avg. Occupancy |
|---|---|---|---|---|
| Tlokweng | 10 | $661 | $61.65 | 37% |
| Kgetleng River Local Municipality | 28 | $606 | $118.45 | 19% |
| Rustenburg Local Municipality | 150 | $517 | $88.58 | 25% |
| Gaborone | 138 | $449 | $87.96 | 30% |
| Naledi Local Municipality | 24 | $289 | $73.56 | 19% |
| Matlosana Local Municipality | 79 | $229 | $42.38 | 24% |
| Ditsobotla Local Municipality | 22 | $219 | $43.69 | 25% |