Blue Crane Route Local Municipality Airbnb Market Analysis 2025: Short Term Rental Data & Vacation Rental Statistics in Eastern Cape, South Africa
Is Airbnb profitable in Blue Crane Route Local Municipality in 2025? Explore comprehensive Airbnb analytics for Blue Crane Route Local Municipality, Eastern Cape, South Africa to uncover income potential. This 2025 STR market report for Blue Crane Route Local Municipality, based on AirROI data from April 2024 to March 2025, reveals key trends in the niche market of 18 active listings.
Whether you're considering an Airbnb investment in Blue Crane Route Local Municipality, optimizing your existing vacation rental, or exploring rental arbitrage opportunities, understanding the Blue Crane Route Local Municipality Airbnb data is crucial. Leveraging the low regulation environment is key to maximizing your short term rental income potential. Let's dive into the specifics.
Key Blue Crane Route Local Municipality Airbnb Performance Metrics Overview
Monthly Airbnb Revenue Variations & Income Potential in Blue Crane Route Local Municipality (2025)
Understanding the monthly revenue variations for Airbnb listings in Blue Crane Route Local Municipality is key to maximizing your short term rental income potential. Seasonality significantly impacts earnings. Our analysis, based on data from the past 12 months, shows that the peak revenue month for STRs in Blue Crane Route Local Municipality is typically September, while June often presents the lowest earnings, highlighting opportunities for strategic pricing adjustments during shoulder and low seasons. Explore the typical Airbnb income in Blue Crane Route Local Municipality across different performance tiers:
- Best-in-class properties (Top 10%) achieve $15,461+ monthly, often utilizing dynamic pricing and superior guest experiences.
- Strong performing properties (Top 25%) earn $5,616 or more, indicating effective management and desirable locations/amenities.
- Typical properties (Median) generate around $574 per month, representing the average market performance.
- Entry-level properties (Bottom 25%) see earnings around $203, often with potential for optimization.
Average Monthly Airbnb Earnings Trend in Blue Crane Route Local Municipality
Blue Crane Route Local Municipality Airbnb Occupancy Rate Trends (2025)
Maximize your bookings by understanding the Blue Crane Route Local Municipality STR occupancy trends. Seasonal demand shifts significantly influence how often properties are booked. Typically, Aprilsees the highest demand (peak season occupancy), while January experiences the lowest (low season). Effective strategies, like adjusting minimum stays or offering promotions, can boost occupancy during slower periods. Here's how different property tiers perform in Blue Crane Route Local Municipality:
- Best-in-class properties (Top 10%) achieve 53%+ occupancy, indicating high desirability and potentially optimized availability.
- Strong performing properties (Top 25%) maintain 32% or higher occupancy, suggesting good market fit and guest satisfaction.
- Typical properties (Median) have an occupancy rate around 21%.
- Entry-level properties (Bottom 25%) average 10% occupancy, potentially facing higher vacancy.
Average Monthly Occupancy Rate Trend in Blue Crane Route Local Municipality
Average Daily Rate (ADR) Airbnb Trends in Blue Crane Route Local Municipality (2025)
Effective short term rental pricing strategy in Blue Crane Route Local Municipality involves understanding monthly ADR fluctuations. The Average Daily Rate (ADR) for Airbnb in Blue Crane Route Local Municipality typically peaks in November and dips lowest during September. Leveraging Airbnb dynamic pricing tools or strategies based on this seasonality can significantly boost revenue. Here's a look at the typical nightly rates achieved:
- Best-in-class properties (Top 10%) command rates of $885+ per night, often due to premium features or locations.
- Strong performing properties (Top 25%) achieve nightly rates of $201 or more.
- Typical properties (Median) charge around $49 per night.
- Entry-level properties (Bottom 25%) earn around $38 per night.
Average Daily Rate (ADR) Trend by Month in Blue Crane Route Local Municipality
Get Live Blue Crane Route Local Municipality Market Intelligence 👇
Explore Real-time Analytics
Airbnb Seasonality Analysis & Trends in Blue Crane Route Local Municipality (2025)
Peak Season (September, August, March)
- Revenue averages $7,969 per month
- Occupancy rates average 28.8%
- Daily rates average $267
Shoulder Season
- Revenue averages $4,675 per month
- Occupancy maintains around 19.8%
- Daily rates hold near $329
Low Season (April, May, June)
- Revenue drops to average $422 per month
- Occupancy decreases to average 27.7%
- Daily rates adjust to average $214
Seasonality Insights for Blue Crane Route Local Municipality
- The Airbnb seasonality in Blue Crane Route Local Municipality shows highly seasonal trends requiring careful strategy. While the sections above show seasonal averages, it's also insightful to look at the extremes:
- During the high season, the absolute peak month showcases Blue Crane Route Local Municipality's highest earning potential, with monthly revenues capable of climbing to $8,518, occupancy reaching a high of 46.0%, and ADRs peaking at $390.
- Conversely, the slowest single month of the year, typically falling within the low season, marks the market's lowest point. In this month, revenue might dip to $318, occupancy could drop to 12.4%, and ADRs may adjust down to $211.
- Understanding both the seasonal averages and these monthly peaks and troughs in revenue, occupancy, and ADR is crucial for maximizing your Airbnb profit potential in Blue Crane Route Local Municipality.
Seasonal Strategies for Maximizing Profit
- Peak Season: Maximize revenue through premium pricing and potentially longer minimum stays. Ensure high availability.
- Low Season: Offer competitive pricing, special promotions (e.g., extended stay discounts), and flexible cancellation policies. Target off-season travelers like remote workers or budget-conscious guests.
- Shoulder Seasons: Implement dynamic pricing that balances peak and low rates. Target weekend travelers or specific events. Offer slightly more flexible terms than peak season.
- Regularly analyze your own performance against these Blue Crane Route Local Municipality seasonality benchmarks and adjust your pricing and availability strategy accordingly.
Best Areas for Airbnb Investment in Blue Crane Route Local Municipality (2025)
Exploring the top neighborhoods for short-term rentals in Blue Crane Route Local Municipality? This section highlights key areas, outlining why they are attractive for hosts and guests, along with notable local attractions. Consider these locations based on your target guest profile and investment strategy.
| Neighborhood / Area | Why Host Here? (Target Guests & Appeal) | Key Attractions & Landmarks |
|---|---|---|
| Jeffreys Bay | Famous for its surfing beaches and laid-back lifestyle, Jeffreys Bay attracts tourists from all over the world, making it a prime location for Airbnb investment. | Jeffreys Bay Main Beach, Supertubes Surf Spot, Jeffreys Bay Shell Museum, Dolphin Beach, Paradise Beach |
| St Francis Bay | Known for its beautiful canals and luxury homes, St Francis Bay is a tranquil escape for visitors seeking outdoor activities and relaxation. | St Francis Links Golf Course, Seal Point Lighthouse, Canals of St Francis, Village Square, St Francis Bay Beach |
| Patensie | Located near the Addo Elephant Park, Patensie caters to nature lovers and adventure seekers, ideal for eco-tourism and nature retreats. | Addo Elephant National Park, Canoeing on the Kouga River, Patensie Citrus Farm Tours, Hiking Trails, Bird Watching Spots |
| Humewood | A suburb of Port Elizabeth known for its beaches and proximity to the Boardwalk, making it perfect for beachgoers and entertainment seekers. | Humerail Beach, The Boardwalk, Humewood Golf Club, Thunderbolt Reef, King's Beach |
| Kouga | With its diverse landscapes and proximity to the ocean, Kouga offers outdoor enthusiasts activities such as hiking, surfing, and fishing. | Tsitsikamma National Park, Kouga River, Wilderness Nature Reserve, Fishing Spots, Surfing Beaches |
| Uitenhage | Rich in history and culture, Uitenhage offers a unique experience for visitors and is well-suited for traditional travelers looking for local charms. | Uitenhage Golf Club, Volkswagen Factory Tour, The Uitenhage Railway Station, Local Museums, Historic Buildings |
| Sundays River Valley | Famous for its river and proximity to Addo, ideal for citrus farming experiences and adventure tourism. | Sundays River Mouth, Addo River Rafting, Citrus Farms, Adventures with Elephants, Boat Trips on the Sundays River |
| Chadford | A small but scenic area offering an intimate feel for guests. Close to nature reserves, ideal for quiet retreats. | Nearby Nature Reserves, Chadford Wine Farms, Local Craft Markets, Bird Watching, Fishing in Nearby Streams |
Understanding Airbnb License Requirements & STR Laws in Blue Crane Route Local Municipality (2025)
While Blue Crane Route Local Municipality, Eastern Cape, South Africa currently shows low STR regulations, specific Airbnb license requirements might still exist or change. Always verify the latest short term rental regulations and Airbnb license requirements directly with local government authorities for Blue Crane Route Local Municipality to ensure full compliance before hosting.
(Source: AirROI data, 2025, finding no licensed listings among those analyzed)
Top Performing Airbnb Properties in Blue Crane Route Local Municipality (2025)
Benchmark your potential! Explore examples of top-performing Airbnb properties in Blue Crane Route Local Municipalitybased on Trailing Twelve Month (TTM) revenue. Analyze their characteristics, revenue, occupancy rate, and ADR to understand what drives success in this market.
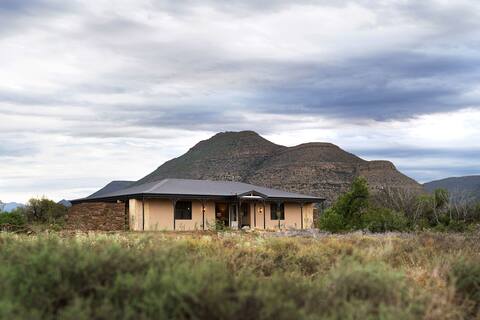
Karoo Lodge | Karoo Family Suite
Private Room • 2 bedrooms

Karoo Lodge | Karoo Suite
Private Room • 1 bedroom

The Manor | Manor Suite
Private Room • 1 bedroom

Plains Camp | Tented Suite
Private Room • 1 bedroom

Witmos oxwagon camp | Luxury tented camp
Private Room • 3 bedrooms

Future Safaris Lodge
Entire Place • 6 bedrooms
Note: Performance varies based on location, size, amenities, seasonality, and management quality. Data reflects the past 12 months.
Top Performing Airbnb Hosts in Blue Crane Route Local Municipality (2025)
Learn from the best! This table showcases top-performing Airbnb hosts in Blue Crane Route Local Municipality based on the number of properties managed and estimated total revenue over the past year. Analyze their scale and performance metrics.
| Host Name | Properties | Grossing Revenue | Stay Reviews | Avg Rating |
|---|---|---|---|---|
| Host #40666041 | 4 | $480,993 | 0 | 0.00/5.0 |
| Aimee | 2 | $6,839 | 87 | 4.72/5.0 |
| Katrina | 1 | $5,542 | 9 | 5.00/5.0 |
| Host #306556251 | 5 | $3,418 | 0 | 0.00/5.0 |
| Cheryl | 1 | $2,984 | 6 | 5.00/5.0 |
| Kayleigh | 1 | $2,111 | 3 | 4.33/5.0 |
| Host #424251530 | 1 | $1,195 | 1 | 0.00/5.0 |
| Luke | 1 | $1,136 | 20 | 4.60/5.0 |
| Host #416946974 | 1 | $175 | 0 | 0.00/5.0 |
| Robert Anthony | 1 | $163 | 27 | 5.00/5.0 |
Analyzing the strategies of top hosts, such as their property selection, pricing, and guest communication, can offer valuable lessons for optimizing your own Airbnb operations in Blue Crane Route Local Municipality.
Dive Deeper: Advanced Blue Crane Route Local Municipality STR Market Data (2025)
Ready to unlock more insights? AirROI provides access to advanced metrics and comprehensive Airbnb data for Blue Crane Route Local Municipality. Explore detailed analytics beyond this report to refine your investment strategy, optimize pricing, and maximize your vacation rental profits.
Explore Advanced MetricsBlue Crane Route Local Municipality Short-Term Rental Market Composition (2025): Property & Room Types
Room Type Distribution
Property Type Distribution
Market Composition Insights for Blue Crane Route Local Municipality
- The Blue Crane Route Local Municipality Airbnb market composition is heavily skewed towards Private Room listings, which make up 66.7% of the 18 active rentals. This indicates strong guest preference for privacy and space.
- Looking at the property type distribution in Blue Crane Route Local Municipality, Hotel/Boutique properties are the most common (44.4%), reflecting the local real estate landscape.
- The presence of 44.4% Hotel/Boutique listings indicates integration with traditional hospitality.
Blue Crane Route Local Municipality Airbnb Room Capacity Analysis (2025): Bedroom Distribution
Distribution of Listings by Number of Bedrooms
Room Capacity Insights for Blue Crane Route Local Municipality
- The dominant room capacity in Blue Crane Route Local Municipality is 1 bedroom listings, making up 55.6% of the market. This suggests a strong demand for properties suitable for couples or solo travelers.
- Together, 1 bedroom and 3 bedrooms properties represent 72.3% of the active Airbnb listings in Blue Crane Route Local Municipality, indicating a high concentration in these sizes.
- With over half the market (55.6%) consisting of studios or 1-bedroom units, Blue Crane Route Local Municipality is particularly well-suited for individuals or couples.
- A significant 33.4% of listings offer 3+ bedrooms, catering to larger groups and families seeking more space in Blue Crane Route Local Municipality.
Blue Crane Route Local Municipality Vacation Rental Guest Capacity Trends (2025)
Distribution of Listings by Guest Capacity
Guest Capacity Insights for Blue Crane Route Local Municipality
- The most common guest capacity trend in Blue Crane Route Local Municipality vacation rentals is listings accommodating 2 guests (50%). This suggests the primary traveler segment is likely couples or solo travelers.
- Properties designed for 2 guests and 8+ guests dominate the Blue Crane Route Local Municipality STR market, accounting for 72.2% of listings.
- A significant 61.1% of listings cater specifically to 1-2 guests, highlighting strong demand from couples and solo travelers in Blue Crane Route Local Municipality.
- 22.2% of properties accommodate 6+ guests, serving the market segment for larger families or group travel in Blue Crane Route Local Municipality.
- On average, properties in Blue Crane Route Local Municipality are equipped to host 3.3 guests.
Blue Crane Route Local Municipality Airbnb Booking Patterns (2025): Available vs. Booked Days
Available Days Distribution
Booked Days Distribution
Booking Pattern Insights for Blue Crane Route Local Municipality
- The most common availability pattern in Blue Crane Route Local Municipality falls within the 271-366 days range, representing 100% of listings. This suggests many properties have significant open periods on their calendars.
- Approximately 100.0% of listings show high availability (181+ days open annually), indicating potential for increased bookings or specific owner usage patterns.
- For booked days, the 31-90 days range is most frequent in Blue Crane Route Local Municipality (55.6%), reflecting common guest stay durations or potential owner blocking patterns.
Blue Crane Route Local Municipality Airbnb Minimum Stay Requirements Analysis
Distribution of Listings by Minimum Night Requirement
1 Night
15 listings
83.3% of total
2 Nights
3 listings
16.7% of total
Key Insights
- The most prevalent minimum stay requirement in Blue Crane Route Local Municipality is 1 Night, adopted by 83.3% of listings. This highlights the market's preference for shorter, flexible bookings.
- A strong majority (100.0%) of the Blue Crane Route Local Municipality Airbnb data shows acceptance of very short stays (1-2 nights), indicating a dynamic, high-turnover market.
Recommendations
- Align with the market by considering a 1 Night minimum stay, as 83.3% of Blue Crane Route Local Municipality hosts use this setting.
- Adjust minimum nights based on seasonality – potentially shorter during low season and longer during peak demand periods in Blue Crane Route Local Municipality.
Blue Crane Route Local Municipality Airbnb Cancellation Policy Trends Analysis (2025)
Non-refundable
1 listings
14.3% of total
Flexible
1 listings
14.3% of total
Moderate
4 listings
57.1% of total
Strict
1 listings
14.3% of total
Cancellation Policy Insights for Blue Crane Route Local Municipality
- The prevailing Airbnb cancellation policy trend in Blue Crane Route Local Municipality is Moderate, used by 57.1% of listings.
- The market strongly favors guest-friendly terms, with 71.4% of listings offering Flexible or Moderate policies. This suggests guests in Blue Crane Route Local Municipality may expect booking flexibility.
Recommendations for Hosts
- Consider adopting a Moderate policy to align with the 57.1% market standard in Blue Crane Route Local Municipality.
- Using a Strict policy might deter some guests, as only 14.3% of listings use it. Evaluate if potential revenue protection outweighs possible lower booking rates.
- Regularly review your cancellation policy against competitors and market demand shifts in Blue Crane Route Local Municipality.
Blue Crane Route Local Municipality STR Booking Lead Time Analysis (2025)
Average Booking Lead Time by Month
Booking Lead Time Insights for Blue Crane Route Local Municipality
- The overall average booking lead time for vacation rentals in Blue Crane Route Local Municipality is 35 days.
- Guests book furthest in advance for stays during October (average 103 days), likely coinciding with peak travel demand or local events.
- The shortest booking windows occur for stays in July (average 14 days), indicating more last-minute travel plans during this time.
- Seasonally, Fall (73 days avg.) sees the longest lead times, while Winter (20 days avg.) has the shortest, reflecting typical travel planning cycles.
Recommendations for Hosts
- Use the overall average lead time (35 days) as a baseline for your pricing and availability strategy in Blue Crane Route Local Municipality.
- For October stays, consider implementing length-of-stay discounts or slightly higher rates for bookings made less than 103 days out to capitalize on advance planning.
- During July, focus on last-minute booking availability and promotions, as guests book with very short notice (14 days avg.).
- Target marketing efforts for the Fall season well in advance (at least 73 days) to capture early planners.
- Monitor your own booking lead times against these Blue Crane Route Local Municipality averages to identify opportunities for dynamic pricing adjustments.
Popular & Essential Airbnb Amenities in Blue Crane Route Local Municipality (2025)
Amenity Prevalence
Amenity Insights for Blue Crane Route Local Municipality
- Essential amenities in Blue Crane Route Local Municipality that guests expect include: Kitchen. Lacking these (this) could significantly impact bookings.
- Popular amenities like Essentials, Hot water, Free parking on premises are common but not universal. Offering these can provide a competitive edge.
- Warning: Wifi is not universally provided but is considered essential globally. Ensure reliable Wifi is offered.
Recommendations for Hosts
- Ensure your listing includes all essential amenities for Blue Crane Route Local Municipality: Kitchen.
- Consider adding popular differentiators like Essentials or Hot water to increase appeal.
- Highlight unique or less common amenities you offer (e.g., hot tub, dedicated workspace, EV charger) in your listing description and photos.
- Regularly check competitor amenities in Blue Crane Route Local Municipality to stay competitive.
Blue Crane Route Local Municipality Airbnb Guest Demographics & Profile Analysis (2025)
Guest Profile Summary for Blue Crane Route Local Municipality
- The typical guest profile for Airbnb in Blue Crane Route Local Municipality consists of primarily domestic travelers (81%), often arriving from nearby Port Elizabeth, typically belonging to the Post-2000s (Gen Z/Alpha) group (50%), primarily speaking English or Afrikaans.
- Domestic travelers account for 81.3% of guests.
- Key international markets include South Africa (81.3%) and Germany (12.5%).
- Top languages spoken are English (56.3%) followed by Afrikaans (37.5%).
- A significant demographic segment is the Post-2000s (Gen Z/Alpha) group, representing 50% of guests.
Recommendations for Hosts
- Target domestic marketing efforts towards travelers from Port Elizabeth and Gqeberha.
- Tailor amenities and listing descriptions to appeal to the dominant Post-2000s (Gen Z/Alpha) demographic (e.g., highlight fast WiFi, smart home features, local guides).
- Highlight unique local experiences or amenities relevant to the primary guest profile.
- Consider seasonal promotions aligned with peak travel times for key origin markets.
Nearby Short-Term Rental Market Comparison
How does the Blue Crane Route Local Municipality Airbnb market stack up against its neighbors? Compare key performance metrics like average monthly revenue, ADR, and occupancy rates in surrounding areas to understand the broader regional STR landscape.
| Market | Active Properties | Monthly Revenue | Daily Rate | Avg. Occupancy |
|---|---|---|---|---|
| Kou-Kamma Local Municipality | 92 | $724 | $99.29 | 30% |
| Ndlambe Local Municipality | 345 | $679 | $114.48 | 28% |
| Sundays River Valley Local Municipality | 73 | $660 | $86.70 | 30% |
| Gqeberha | 856 | $537 | $68.38 | 34% |
| Makana Local Municipality | 107 | $475 | $67.08 | 30% |
| Colchester | 30 | $448 | $81.57 | 23% |
| Nkonkobe Local Municipality | 85 | $447 | $71.69 | 24% |
| Camdeboo Local Municipality | 175 | $441 | $66.00 | 27% |
| Port Elizabeth | 40 | $395 | $68.80 | 25% |
| Tsolwana Local Municipality | 10 | $363 | $91.56 | 19% |