Hauge Airbnb Market Analysis 2025: Short Term Rental Data & Vacation Rental Statistics in Viken, Norway
Is Airbnb profitable in Hauge in 2025? Explore comprehensive Airbnb analytics for Hauge, Viken, Norway to uncover income potential. This 2025 STR market report for Hauge, based on AirROI data from April 2024 to March 2025, reveals key trends in the niche market of 18 active listings.
Whether you're considering an Airbnb investment in Hauge, optimizing your existing vacation rental, or exploring rental arbitrage opportunities, understanding the Hauge Airbnb data is crucial. Leveraging the low regulation environment is key to maximizing your short term rental income potential. Let's dive into the specifics.
Key Hauge Airbnb Performance Metrics Overview
Monthly Airbnb Revenue Variations & Income Potential in Hauge (2025)
Understanding the monthly revenue variations for Airbnb listings in Hauge is key to maximizing your short term rental income potential. Seasonality significantly impacts earnings. Our analysis, based on data from the past 12 months, shows that the peak revenue month for STRs in Hauge is typically July, while February often presents the lowest earnings, highlighting opportunities for strategic pricing adjustments during shoulder and low seasons. Explore the typical Airbnb income in Hauge across different performance tiers:
- Best-in-class properties (Top 10%) achieve $3,624+ monthly, often utilizing dynamic pricing and superior guest experiences.
- Strong performing properties (Top 25%) earn $2,191 or more, indicating effective management and desirable locations/amenities.
- Typical properties (Median) generate around $1,207 per month, representing the average market performance.
- Entry-level properties (Bottom 25%) see earnings around $574, often with potential for optimization.
Average Monthly Airbnb Earnings Trend in Hauge
Hauge Airbnb Occupancy Rate Trends (2025)
Maximize your bookings by understanding the Hauge STR occupancy trends. Seasonal demand shifts significantly influence how often properties are booked. Typically, Julysees the highest demand (peak season occupancy), while February experiences the lowest (low season). Effective strategies, like adjusting minimum stays or offering promotions, can boost occupancy during slower periods. Here's how different property tiers perform in Hauge:
- Best-in-class properties (Top 10%) achieve 49%+ occupancy, indicating high desirability and potentially optimized availability.
- Strong performing properties (Top 25%) maintain 42% or higher occupancy, suggesting good market fit and guest satisfaction.
- Typical properties (Median) have an occupancy rate around 24%.
- Entry-level properties (Bottom 25%) average 13% occupancy, potentially facing higher vacancy.
Average Monthly Occupancy Rate Trend in Hauge
Average Daily Rate (ADR) Airbnb Trends in Hauge (2025)
Effective short term rental pricing strategy in Hauge involves understanding monthly ADR fluctuations. The Average Daily Rate (ADR) for Airbnb in Hauge typically peaks in July and dips lowest during November. Leveraging Airbnb dynamic pricing tools or strategies based on this seasonality can significantly boost revenue. Here's a look at the typical nightly rates achieved:
- Best-in-class properties (Top 10%) command rates of $270+ per night, often due to premium features or locations.
- Strong performing properties (Top 25%) achieve nightly rates of $206 or more.
- Typical properties (Median) charge around $151 per night.
- Entry-level properties (Bottom 25%) earn around $91 per night.
Average Daily Rate (ADR) Trend by Month in Hauge
Get Live Hauge Market Intelligence 👇

Explore Real-time Analytics
Airbnb Seasonality Analysis & Trends in Hauge (2025)
Peak Season (July, June, May)
- Revenue averages $3,222 per month
- Occupancy rates average 52.0%
- Daily rates average $171
Shoulder Season
- Revenue averages $1,320 per month
- Occupancy maintains around 25.2%
- Daily rates hold near $166
Low Season (January, February, November)
- Revenue drops to average $445 per month
- Occupancy decreases to average 9.6%
- Daily rates adjust to average $166
Seasonality Insights for Hauge
- The Airbnb seasonality in Hauge shows highly seasonal trends requiring careful strategy. While the sections above show seasonal averages, it's also insightful to look at the extremes:
- During the high season, the absolute peak month showcases Hauge's highest earning potential, with monthly revenues capable of climbing to $3,798, occupancy reaching a high of 71.4%, and ADRs peaking at $172.
- Conversely, the slowest single month of the year, typically falling within the low season, marks the market's lowest point. In this month, revenue might dip to $123, occupancy could drop to 3.6%, and ADRs may adjust down to $164.
- Understanding both the seasonal averages and these monthly peaks and troughs in revenue, occupancy, and ADR is crucial for maximizing your Airbnb profit potential in Hauge.
Seasonal Strategies for Maximizing Profit
- Peak Season: Maximize revenue through premium pricing and potentially longer minimum stays. Ensure high availability.
- Low Season: Offer competitive pricing, special promotions (e.g., extended stay discounts), and flexible cancellation policies. Target off-season travelers like remote workers or budget-conscious guests.
- Shoulder Seasons: Implement dynamic pricing that balances peak and low rates. Target weekend travelers or specific events. Offer slightly more flexible terms than peak season.
- Regularly analyze your own performance against these Hauge seasonality benchmarks and adjust your pricing and availability strategy accordingly.
Best Areas for Airbnb Investment in Hauge (2025)
Exploring the top neighborhoods for short-term rentals in Hauge? This section highlights key areas, outlining why they are attractive for hosts and guests, along with notable local attractions. Consider these locations based on your target guest profile and investment strategy.
| Neighborhood / Area | Why Host Here? (Target Guests & Appeal) | Key Attractions & Landmarks |
|---|---|---|
| City Center | The vibrant urban heart of The Hague, featuring a mix of culture, shopping, and business. It's frequented by tourists due to its accessibility to key attractions and the lovely atmosphere. | Mauritshuis, Binnenhof, Parks, Shopping streets such as Spuistraat, D schitterende lokatie van Den Haag festival |
| Scheveningen | A popular seaside resort area known for its beach, pier, and cultural events. Attracts both summer tourists and those looking for a beach getaway, making it ideal for Airbnb hosts. | Scheveningen Beach, Kongsi Theater, Skyview Pier, Sea Life Scheveningen, The Pier |
| Delft | A picturesque town nearby known for its historic architecture and famous Delftware pottery. It offers a quaint experience and is ideal for tourists exploring the cultural heritage of the Netherlands. | Delft Market Square, New Church, Old Church, Delftware factories, Royal Delft |
| Kijkduin | A quieter alternative to Scheveningen, this area offers a relaxed beach atmosphere with stunning natural landscapes. Perfect for families and those seeking a calm beach escape. | Kijkduin beach, Kijkduin Shopping Centre, Nature reserve De Peijsepolder, Kijkduin Pier, Restaurants along the coast |
| Wassenaar | An upscale suburb known for its luxury homes and greenery. Popular among tourists looking for a more tranquil stay while still being close to The Hague's attractions. | Museum Voorlinden, Wassenaar beach, Bicycle routes, Huis ter Meer, Historical sites |
| Leidschendam | A lovely area featuring canals and parks. It’s suitable for families and those who enjoy nature while being just a short distance from The Hague and its vibrant atmosphere. | Vlietland, Huygens' Hofwijck, Leidschendam shopping centers, Parks and nature trails |
| Ypenburg | A growing residential area that offers a blend of modern living and accessibility to The Hague. Attractive for short-term stays for business travelers. | Ypenburg Park, Nearby sports facilities, Modern architecture, Easy access to public transport |
| Oude Centrum | The historic old town is filled with charm, restaurants, and sites. Great for tourists wanting to step back in time while enjoying modern comforts. | Old Town Hall, Historical churches, Charming streets, Local cafes and shops, Canals |
Understanding Airbnb License Requirements & STR Laws in Hauge (2025)
While Hauge, Viken, Norway currently shows low STR regulations, specific Airbnb license requirements might still exist or change. Always verify the latest short term rental regulations and Airbnb license requirements directly with local government authorities for Hauge to ensure full compliance before hosting.
(Source: AirROI data, 2025, finding no licensed listings among those analyzed)
Top Performing Airbnb Properties in Hauge (2025)
Benchmark your potential! Explore examples of top-performing Airbnb properties in Haugebased on Trailing Twelve Month (TTM) revenue. Analyze their characteristics, revenue, occupancy rate, and ADR to understand what drives success in this market.
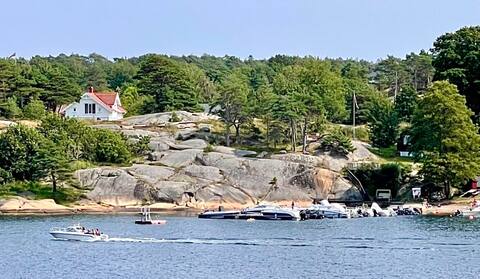
Idyllic pearl with long shoreline
Entire Place • 7 bedrooms
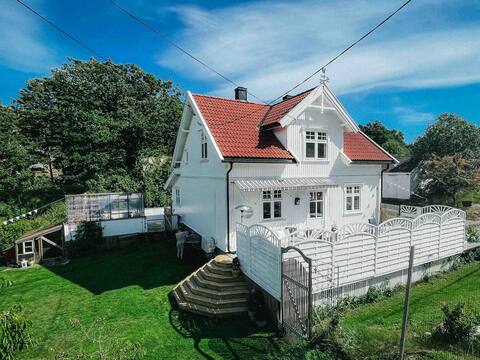
Unique skipper house with hens in the garden
Entire Place • 2 bedrooms

"Bua" in maritime surroundings!
Entire Place • N/A
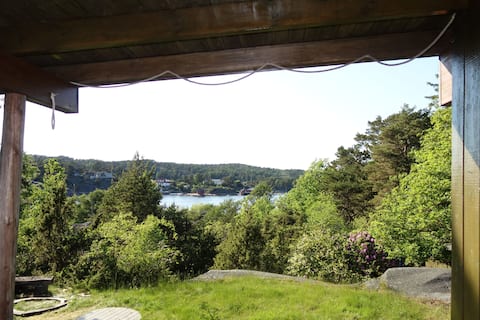
Unobstructed seaside summer cottage
Entire Place • 3 bedrooms

Rustic small nature reserve cottage
Entire Place • 1 bedroom
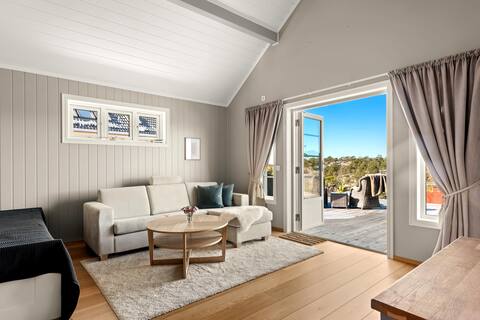
Apartment with seaview
Entire Place • 1 bedroom
Note: Performance varies based on location, size, amenities, seasonality, and management quality. Data reflects the past 12 months.
Top Performing Airbnb Hosts in Hauge (2025)
Learn from the best! This table showcases top-performing Airbnb hosts in Hauge based on the number of properties managed and estimated total revenue over the past year. Analyze their scale and performance metrics.
| Host Name | Properties | Grossing Revenue | Stay Reviews | Avg Rating |
|---|---|---|---|---|
| Annette | 1 | $43,112 | 4 | 4.25/5.0 |
| Liv Irene | 2 | $41,419 | 79 | 4.93/5.0 |
| Fredrik René | 1 | $21,050 | 51 | 4.84/5.0 |
| Jorge | 2 | $20,911 | 16 | 4.91/5.0 |
| Sølvi | 2 | $19,083 | 76 | 4.95/5.0 |
| Knut | 1 | $17,180 | 6 | 4.67/5.0 |
| Helge | 1 | $10,402 | 20 | 4.95/5.0 |
| Kirsti | 1 | $9,247 | 3 | 5.00/5.0 |
| Werner | 1 | $8,836 | 10 | 4.90/5.0 |
| Host #49456258 | 1 | $8,399 | 0 | 0.00/5.0 |
Analyzing the strategies of top hosts, such as their property selection, pricing, and guest communication, can offer valuable lessons for optimizing your own Airbnb operations in Hauge.
Dive Deeper: Advanced Hauge STR Market Data (2025)
Ready to unlock more insights? AirROI provides access to advanced metrics and comprehensive Airbnb data for Hauge. Explore detailed analytics beyond this report to refine your investment strategy, optimize pricing, and maximize your vacation rental profits.
Explore Advanced MetricsHauge Short-Term Rental Market Composition (2025): Property & Room Types
Room Type Distribution
Property Type Distribution
Market Composition Insights for Hauge
- The Hauge Airbnb market composition is heavily skewed towards Entire Home/Apt listings, which make up 100% of the 18 active rentals. This indicates strong guest preference for privacy and space.
- Looking at the property type distribution in Hauge, Outdoor/Unique properties are the most common (44.4%), reflecting the local real estate landscape.
- Houses represent a significant 33.3% portion, catering likely to families or larger groups.
Hauge Airbnb Room Capacity Analysis (2025): Bedroom Distribution
Distribution of Listings by Number of Bedrooms
Room Capacity Insights for Hauge
- The dominant room capacity in Hauge is 3 bedrooms listings, making up 27.8% of the market. This suggests a strong demand for properties suitable for families or small groups.
- Together, 3 bedrooms and 2 bedrooms properties represent 55.6% of the active Airbnb listings in Hauge, indicating a high concentration in these sizes.
- A significant 44.5% of listings offer 3+ bedrooms, catering to larger groups and families seeking more space in Hauge.
Hauge Vacation Rental Guest Capacity Trends (2025)
Distribution of Listings by Guest Capacity
Guest Capacity Insights for Hauge
- The most common guest capacity trend in Hauge vacation rentals is listings accommodating 8+ guests (22.2%). This suggests the primary traveler segment is likely larger groups.
- Properties designed for 8+ guests and 4 guests dominate the Hauge STR market, accounting for 44.4% of listings.
- 50.0% of properties accommodate 6+ guests, serving the market segment for larger families or group travel in Hauge.
- On average, properties in Hauge are equipped to host 5.5 guests.
Hauge Airbnb Booking Patterns (2025): Available vs. Booked Days
Available Days Distribution
Booked Days Distribution
Booking Pattern Insights for Hauge
- The most common availability pattern in Hauge falls within the 271-366 days range, representing 55.6% of listings. This suggests many properties have significant open periods on their calendars.
- Approximately 100.0% of listings show high availability (181+ days open annually), indicating potential for increased bookings or specific owner usage patterns.
- For booked days, the 91-180 days range is most frequent in Hauge (44.4%), reflecting common guest stay durations or potential owner blocking patterns.
Hauge Airbnb Minimum Stay Requirements Analysis
Distribution of Listings by Minimum Night Requirement
1 Night
6 listings
35.3% of total
2 Nights
8 listings
47.1% of total
3 Nights
1 listings
5.9% of total
4-6 Nights
2 listings
11.8% of total
Key Insights
- The most prevalent minimum stay requirement in Hauge is 2 Nights, adopted by 47.1% of listings. This highlights the market's preference for shorter, flexible bookings.
- A strong majority (82.4%) of the Hauge Airbnb data shows acceptance of very short stays (1-2 nights), indicating a dynamic, high-turnover market.
Recommendations
- Align with the market by considering a 2 Nights minimum stay, as 47.1% of Hauge hosts use this setting.
- Adjust minimum nights based on seasonality – potentially shorter during low season and longer during peak demand periods in Hauge.
Hauge Airbnb Cancellation Policy Trends Analysis (2025)
Flexible
5 listings
31.3% of total
Moderate
3 listings
18.8% of total
Firm
2 listings
12.5% of total
Strict
6 listings
37.5% of total
Cancellation Policy Insights for Hauge
- The prevailing Airbnb cancellation policy trend in Hauge is Strict, used by 37.5% of listings.
- There's a relatively balanced mix between guest-friendly (50.1%) and stricter (50.0%) policies, offering choices for different guest needs.
Recommendations for Hosts
- Consider adopting a Strict policy to align with the 37.5% market standard in Hauge.
- With 37.5% using Strict terms, this is a viable option in Hauge, particularly for high-value properties or during peak demand periods.
- Regularly review your cancellation policy against competitors and market demand shifts in Hauge.
Hauge STR Booking Lead Time Analysis (2025)
Average Booking Lead Time by Month
Booking Lead Time Insights for Hauge
- The overall average booking lead time for vacation rentals in Hauge is 49 days.
- Guests book furthest in advance for stays during July (average 91 days), likely coinciding with peak travel demand or local events.
- The shortest booking windows occur for stays in November (average 0 days), indicating more last-minute travel plans during this time.
- Seasonally, Summer (70 days avg.) sees the longest lead times, while Winter (3 days avg.) has the shortest, reflecting typical travel planning cycles.
Recommendations for Hosts
- Use the overall average lead time (49 days) as a baseline for your pricing and availability strategy in Hauge.
- For July stays, consider implementing length-of-stay discounts or slightly higher rates for bookings made less than 91 days out to capitalize on advance planning.
- During November, focus on last-minute booking availability and promotions, as guests book with very short notice (0 days avg.).
- Target marketing efforts for the Summer season well in advance (at least 70 days) to capture early planners.
- Monitor your own booking lead times against these Hauge averages to identify opportunities for dynamic pricing adjustments.
Popular & Essential Airbnb Amenities in Hauge (2025)
Amenity Prevalence
Amenity Insights for Hauge
- Essential amenities in Hauge that guests expect include: Heating, Kitchen. Lacking these (any) could significantly impact bookings.
- Popular amenities like Smoke alarm, Refrigerator, TV are common but not universal. Offering these can provide a competitive edge.
- Warning: Wifi is not universally provided but is considered essential globally. Ensure reliable Wifi is offered.
Recommendations for Hosts
- Ensure your listing includes all essential amenities for Hauge: Heating, Kitchen.
- Consider adding popular differentiators like Smoke alarm or Refrigerator to increase appeal.
- Highlight unique or less common amenities you offer (e.g., hot tub, dedicated workspace, EV charger) in your listing description and photos.
- Regularly check competitor amenities in Hauge to stay competitive.
Hauge Airbnb Guest Demographics & Profile Analysis (2025)
Guest Profile Summary for Hauge
- The typical guest profile for Airbnb in Hauge consists of a mix of domestic (63%) and international guests, often arriving from nearby Oslo, typically belonging to the Post-2000s (Gen Z/Alpha) group (50%), primarily speaking English or Norwegian.
- Domestic travelers account for 62.8% of guests.
- Key international markets include Norway (62.8%) and Denmark (7.4%).
- Top languages spoken are English (33.3%) followed by Norwegian (23.2%).
- A significant demographic segment is the Post-2000s (Gen Z/Alpha) group, representing 50% of guests.
Recommendations for Hosts
- Target domestic marketing efforts towards travelers from Oslo and Jessheim.
- Tailor amenities and listing descriptions to appeal to the dominant Post-2000s (Gen Z/Alpha) demographic (e.g., highlight fast WiFi, smart home features, local guides).
- Highlight unique local experiences or amenities relevant to the primary guest profile.
- Consider seasonal promotions aligned with peak travel times for key origin markets.
Nearby Short-Term Rental Market Comparison
How does the Hauge Airbnb market stack up against its neighbors? Compare key performance metrics like average monthly revenue, ADR, and occupancy rates in surrounding areas to understand the broader regional STR landscape.
| Market | Active Properties | Monthly Revenue | Daily Rate | Avg. Occupancy |
|---|---|---|---|---|
| Stange | 54 | $2,554 | $231.99 | 40% |
| Krødsherad | 81 | $1,872 | $219.31 | 40% |
| Fenstad | 12 | $1,843 | $171.18 | 38% |
| Flå | 88 | $1,812 | $212.63 | 37% |
| Starrkärr och Näs | 11 | $1,795 | $249.46 | 22% |
| Enebakk | 34 | $1,759 | $129.57 | 48% |
| Lier | 13 | $1,654 | $283.01 | 37% |
| Budor | 52 | $1,593 | $211.02 | 33% |
| Melsomvik | 15 | $1,550 | $135.11 | 41% |
| Lunner | 23 | $1,525 | $154.92 | 38% |