Hvasser Airbnb Market Analysis 2025: Short Term Rental Data & Vacation Rental Statistics in Vestfold og Telemark, Norway
Is Airbnb profitable in Hvasser in 2025? Explore comprehensive Airbnb analytics for Hvasser, Vestfold og Telemark, Norway to uncover income potential. This 2025 STR market report for Hvasser, based on AirROI data from April 2024 to March 2025, reveals key trends in the niche market of 17 active listings.
Whether you're considering an Airbnb investment in Hvasser, optimizing your existing vacation rental, or exploring rental arbitrage opportunities, understanding the Hvasser Airbnb data is crucial. Leveraging the low regulation environment is key to maximizing your short term rental income potential. Let's dive into the specifics.
Key Hvasser Airbnb Performance Metrics Overview
Monthly Airbnb Revenue Variations & Income Potential in Hvasser (2025)
Understanding the monthly revenue variations for Airbnb listings in Hvasser is key to maximizing your short term rental income potential. Seasonality significantly impacts earnings. Our analysis, based on data from the past 12 months, shows that the peak revenue month for STRs in Hvasser is typically April, while January often presents the lowest earnings, highlighting opportunities for strategic pricing adjustments during shoulder and low seasons. Explore the typical Airbnb income in Hvasser across different performance tiers:
- Best-in-class properties (Top 10%) achieve $4,466+ monthly, often utilizing dynamic pricing and superior guest experiences.
- Strong performing properties (Top 25%) earn $3,857 or more, indicating effective management and desirable locations/amenities.
- Typical properties (Median) generate around $1,996 per month, representing the average market performance.
- Entry-level properties (Bottom 25%) see earnings around $1,396, often with potential for optimization.
Average Monthly Airbnb Earnings Trend in Hvasser
Hvasser Airbnb Occupancy Rate Trends (2025)
Maximize your bookings by understanding the Hvasser STR occupancy trends. Seasonal demand shifts significantly influence how often properties are booked. Typically, Julysees the highest demand (peak season occupancy), while January experiences the lowest (low season). Effective strategies, like adjusting minimum stays or offering promotions, can boost occupancy during slower periods. Here's how different property tiers perform in Hvasser:
- Best-in-class properties (Top 10%) achieve 57%+ occupancy, indicating high desirability and potentially optimized availability.
- Strong performing properties (Top 25%) maintain 52% or higher occupancy, suggesting good market fit and guest satisfaction.
- Typical properties (Median) have an occupancy rate around 32%.
- Entry-level properties (Bottom 25%) average 20% occupancy, potentially facing higher vacancy.
Average Monthly Occupancy Rate Trend in Hvasser
Average Daily Rate (ADR) Airbnb Trends in Hvasser (2025)
Effective short term rental pricing strategy in Hvasser involves understanding monthly ADR fluctuations. The Average Daily Rate (ADR) for Airbnb in Hvasser typically peaks in November and dips lowest during April. Leveraging Airbnb dynamic pricing tools or strategies based on this seasonality can significantly boost revenue. Here's a look at the typical nightly rates achieved:
- Best-in-class properties (Top 10%) command rates of $378+ per night, often due to premium features or locations.
- Strong performing properties (Top 25%) achieve nightly rates of $215 or more.
- Typical properties (Median) charge around $163 per night.
- Entry-level properties (Bottom 25%) earn around $109 per night.
Average Daily Rate (ADR) Trend by Month in Hvasser
Get Live Hvasser Market Intelligence 👇

Explore Real-time Analytics
Airbnb Seasonality Analysis & Trends in Hvasser (2025)
Peak Season (April, July, August)
- Revenue averages $4,590 per month
- Occupancy rates average 34.3%
- Daily rates average $177
Shoulder Season
- Revenue averages $2,133 per month
- Occupancy maintains around 35.3%
- Daily rates hold near $180
Low Season (January, February, March)
- Revenue drops to average $790 per month
- Occupancy decreases to average 13.2%
- Daily rates adjust to average $185
Seasonality Insights for Hvasser
- The Airbnb seasonality in Hvasser shows highly seasonal trends requiring careful strategy. While the sections above show seasonal averages, it's also insightful to look at the extremes:
- During the high season, the absolute peak month showcases Hvasser's highest earning potential, with monthly revenues capable of climbing to $5,874, occupancy reaching a high of 59.4%, and ADRs peaking at $189.
- Conversely, the slowest single month of the year, typically falling within the low season, marks the market's lowest point. In this month, revenue might dip to $0, occupancy could drop to 0.0%, and ADRs may adjust down to $169.
- Understanding both the seasonal averages and these monthly peaks and troughs in revenue, occupancy, and ADR is crucial for maximizing your Airbnb profit potential in Hvasser.
Seasonal Strategies for Maximizing Profit
- Peak Season: Maximize revenue through premium pricing and potentially longer minimum stays. Ensure high availability.
- Low Season: Offer competitive pricing, special promotions (e.g., extended stay discounts), and flexible cancellation policies. Target off-season travelers like remote workers or budget-conscious guests.
- Shoulder Seasons: Implement dynamic pricing that balances peak and low rates. Target weekend travelers or specific events. Offer slightly more flexible terms than peak season.
- Regularly analyze your own performance against these Hvasser seasonality benchmarks and adjust your pricing and availability strategy accordingly.
Best Areas for Airbnb Investment in Hvasser (2025)
Exploring the top neighborhoods for short-term rentals in Hvasser? This section highlights key areas, outlining why they are attractive for hosts and guests, along with notable local attractions. Consider these locations based on your target guest profile and investment strategy.
| Neighborhood / Area | Why Host Here? (Target Guests & Appeal) | Key Attractions & Landmarks |
|---|---|---|
| Hvasser Beach | Beautiful beach area known for its stunning coastal views and outdoor activities. A great location for vacationers wanting to enjoy sunbathing, swimming, and water sports. | Hvasser Beach, The Coastal Path, Water Sports Equipment Rentals, Local Seafood Restaurants |
| Tjøme Island | A scenic area with charming fishing villages and nature trails. Attracts tourists looking for a peaceful getaway surrounded by nature and beautiful landscapes. | Tjøme Lighthouse, Tjøme Marina, Nature Trails, Local Art Galleries |
| Sandefjord | Nearby coastal town with rich history and cultural attractions. Offers a mix of urban amenities and seaside charm, appealing to both tourists and business travelers. | Whaling Museum, Sandefjord Marina, The Old Town, Viking Ship Museum |
| Bottle Beach at Nøtterøy | Known for its clear waters and family-friendly atmosphere, perfect for those looking for a relaxing beach holiday. | Bottle Beach, Nøtterøy's Coastal Walks, Local Cafés |
| Færder National Park | A national park that features beautiful landscapes, hiking trails, and rich biodiversity. Ideal for nature lovers and adventure seekers. | Hiking Trails, Wildlife Observation, Scenic Views |
| Vestby | A vibrant town with a mix of culture, shopping, and access to nature, appealing to visitors looking for a variety of experiences. | Vestby Shopping Centre, Historical Sites, Parks and Recreation Areas |
| Larvik | A historic town with beautiful architecture and access to cultural events, great for tourists interested in Norwegian history and culture. | Larvik Museum, Herregård Theatre, Beach Parks |
| Tønsberg | Norway's oldest town with a rich history and a charming waterfront. A perfect location for those interested in historical sightseeing and coastal experiences. | Slottsfjellet, Tønsberg Cathedral, Old Town, Local Restaurants |
Understanding Airbnb License Requirements & STR Laws in Hvasser (2025)
While Hvasser, Vestfold og Telemark, Norway currently shows low STR regulations, specific Airbnb license requirements might still exist or change. Always verify the latest short term rental regulations and Airbnb license requirements directly with local government authorities for Hvasser to ensure full compliance before hosting.
(Source: AirROI data, 2025, finding no licensed listings among those analyzed)
Top Performing Airbnb Properties in Hvasser (2025)
Benchmark your potential! Explore examples of top-performing Airbnb properties in Hvasserbased on Trailing Twelve Month (TTM) revenue. Analyze their characteristics, revenue, occupancy rate, and ADR to understand what drives success in this market.
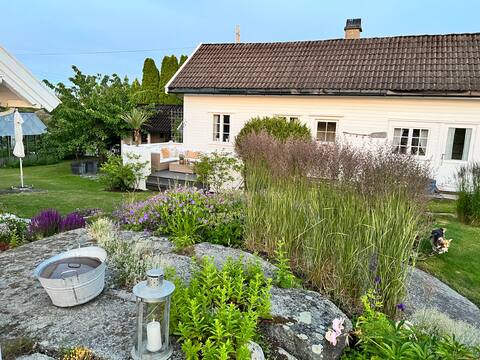
Idyllic brewery house on Hvasser
Entire Place • 2 bedrooms
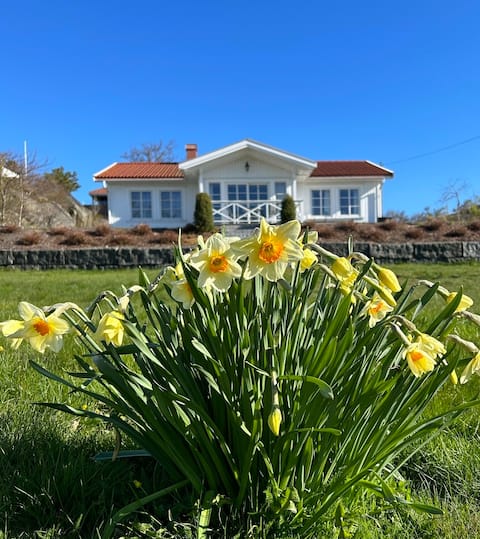
Unikt sommersted sentralt på Hvasser
Entire Place • 7 bedrooms
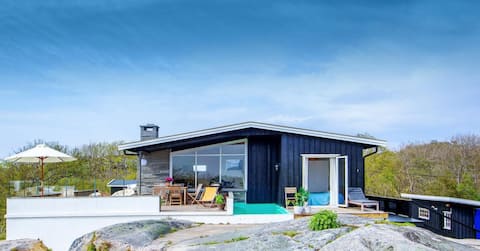
Summerdream Hvasser, Tjøme
Entire Place • 4 bedrooms

Gudem Seacation - en suite on the water
Entire Place • 2 bedrooms
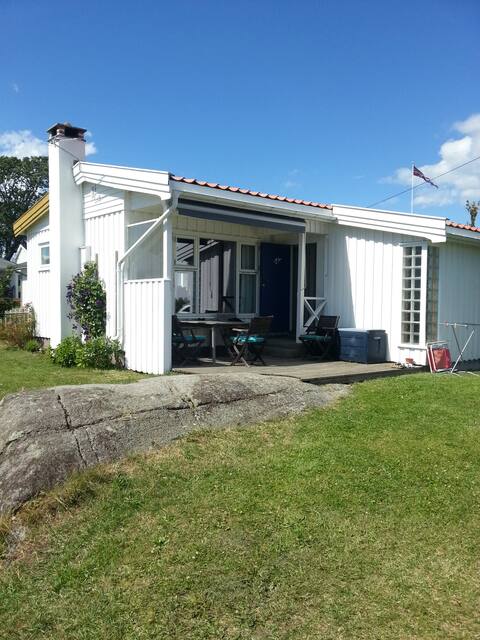
Hytte ved stranden på idylliske Hvasser.
Entire Place • 2 bedrooms

Paradiset
Entire Place • 3 bedrooms
Note: Performance varies based on location, size, amenities, seasonality, and management quality. Data reflects the past 12 months.
Top Performing Airbnb Hosts in Hvasser (2025)
Learn from the best! This table showcases top-performing Airbnb hosts in Hvasser based on the number of properties managed and estimated total revenue over the past year. Analyze their scale and performance metrics.
| Host Name | Properties | Grossing Revenue | Stay Reviews | Avg Rating |
|---|---|---|---|---|
| Anette | 1 | $31,072 | 10 | 4.90/5.0 |
| Host #457441385 | 1 | $29,570 | 1 | 0.00/5.0 |
| Host #8877413 | 1 | $27,013 | 0 | 0.00/5.0 |
| Marianne B. | 2 | $23,005 | 49 | 4.99/5.0 |
| Host #276784044 | 1 | $20,370 | 33 | 4.73/5.0 |
| Cecilie Marie | 1 | $17,232 | 46 | 4.96/5.0 |
| Mons | 1 | $9,388 | 69 | 4.96/5.0 |
| Host #88971982 | 2 | $8,401 | 2 | 0.00/5.0 |
| Host #42967342 | 1 | $8,012 | 2 | 0.00/5.0 |
| Anita | 1 | $6,609 | 52 | 4.87/5.0 |
Analyzing the strategies of top hosts, such as their property selection, pricing, and guest communication, can offer valuable lessons for optimizing your own Airbnb operations in Hvasser.
Dive Deeper: Advanced Hvasser STR Market Data (2025)
Ready to unlock more insights? AirROI provides access to advanced metrics and comprehensive Airbnb data for Hvasser. Explore detailed analytics beyond this report to refine your investment strategy, optimize pricing, and maximize your vacation rental profits.
Explore Advanced MetricsHvasser Short-Term Rental Market Composition (2025): Property & Room Types
Room Type Distribution
Property Type Distribution
Market Composition Insights for Hvasser
- The Hvasser Airbnb market composition is heavily skewed towards Entire Home/Apt listings, which make up 100% of the 17 active rentals. This indicates strong guest preference for privacy and space.
- Looking at the property type distribution in Hvasser, House properties are the most common (35.3%), reflecting the local real estate landscape.
- Houses represent a significant 35.3% portion, catering likely to families or larger groups.
- The presence of 5.9% Hotel/Boutique listings indicates integration with traditional hospitality.
Hvasser Airbnb Room Capacity Analysis (2025): Bedroom Distribution
Distribution of Listings by Number of Bedrooms
Room Capacity Insights for Hvasser
- The dominant room capacity in Hvasser is 2 bedrooms listings, making up 52.9% of the market. This suggests a strong demand for properties suitable for couples or solo travelers.
- Together, 2 bedrooms and 4 bedrooms properties represent 76.4% of the active Airbnb listings in Hvasser, indicating a high concentration in these sizes.
- A significant 41.2% of listings offer 3+ bedrooms, catering to larger groups and families seeking more space in Hvasser.
Hvasser Vacation Rental Guest Capacity Trends (2025)
Distribution of Listings by Guest Capacity
Guest Capacity Insights for Hvasser
- The most common guest capacity trend in Hvasser vacation rentals is listings accommodating 8+ guests (29.4%). This suggests the primary traveler segment is likely larger groups.
- Properties designed for 8+ guests and 4 guests dominate the Hvasser STR market, accounting for 47.0% of listings.
- 58.8% of properties accommodate 6+ guests, serving the market segment for larger families or group travel in Hvasser.
- On average, properties in Hvasser are equipped to host 5.9 guests.
Hvasser Airbnb Booking Patterns (2025): Available vs. Booked Days
Available Days Distribution
Booked Days Distribution
Booking Pattern Insights for Hvasser
- The most common availability pattern in Hvasser falls within the 271-366 days range, representing 76.5% of listings. This suggests many properties have significant open periods on their calendars.
- Approximately 100.0% of listings show high availability (181+ days open annually), indicating potential for increased bookings or specific owner usage patterns.
- For booked days, the 31-90 days range is most frequent in Hvasser (47.1%), reflecting common guest stay durations or potential owner blocking patterns.
Hvasser Airbnb Minimum Stay Requirements Analysis
Distribution of Listings by Minimum Night Requirement
1 Night
1 listings
6.7% of total
2 Nights
5 listings
33.3% of total
3 Nights
4 listings
26.7% of total
4-6 Nights
3 listings
20% of total
7-29 Nights
2 listings
13.3% of total
Key Insights
- The most prevalent minimum stay requirement in Hvasser is 2 Nights, adopted by 33.3% of listings. This highlights the market's preference for shorter, flexible bookings.
Recommendations
- Align with the market by considering a 2 Nights minimum stay, as 33.3% of Hvasser hosts use this setting.
- If feasible, allowing 1-night stays, especially midweek or during low season, could capture last-minute bookings, as only 6.7% currently do.
- A 2-night minimum appears standard (33.3%). Consider this for weekends or peak periods.
- Adjust minimum nights based on seasonality – potentially shorter during low season and longer during peak demand periods in Hvasser.
Hvasser Airbnb Cancellation Policy Trends Analysis (2025)
Flexible
2 listings
20% of total
Moderate
2 listings
20% of total
Firm
2 listings
20% of total
Strict
4 listings
40% of total
Cancellation Policy Insights for Hvasser
- The prevailing Airbnb cancellation policy trend in Hvasser is Strict, used by 40% of listings.
- A majority (60.0%) of hosts in Hvasser utilize Firm or Strict policies, indicating a market where hosts prioritize booking security.
Recommendations for Hosts
- Consider adopting a Strict policy to align with the 40% market standard in Hvasser.
- With 40% using Strict terms, this is a viable option in Hvasser, particularly for high-value properties or during peak demand periods.
- Regularly review your cancellation policy against competitors and market demand shifts in Hvasser.
Hvasser STR Booking Lead Time Analysis (2025)
Average Booking Lead Time by Month
Booking Lead Time Insights for Hvasser
- The overall average booking lead time for vacation rentals in Hvasser is 82 days.
- Guests book furthest in advance for stays during April (average 132 days), likely coinciding with peak travel demand or local events.
- The shortest booking windows occur for stays in December (average 0 days), indicating more last-minute travel plans during this time.
- Seasonally, Summer (112 days avg.) sees the longest lead times, while Winter (0 days avg.) has the shortest, reflecting typical travel planning cycles.
Recommendations for Hosts
- Use the overall average lead time (82 days) as a baseline for your pricing and availability strategy in Hvasser.
- For April stays, consider implementing length-of-stay discounts or slightly higher rates for bookings made less than 132 days out to capitalize on advance planning.
- During December, focus on last-minute booking availability and promotions, as guests book with very short notice (0 days avg.).
- Target marketing efforts for the Summer season well in advance (at least 112 days) to capture early planners.
- Monitor your own booking lead times against these Hvasser averages to identify opportunities for dynamic pricing adjustments.
Popular & Essential Airbnb Amenities in Hvasser (2025)
Amenity Prevalence
Amenity Insights for Hvasser
- Essential amenities in Hvasser that guests expect include: Kitchen, Smoke alarm, Hot water, Heating, Fire extinguisher. Lacking these (any) could significantly impact bookings.
- Popular amenities like Essentials, Free parking on premises, TV are common but not universal. Offering these can provide a competitive edge.
Recommendations for Hosts
- Ensure your listing includes all essential amenities for Hvasser: Kitchen, Smoke alarm, Hot water, Heating, Fire extinguisher.
- Consider adding popular differentiators like Essentials or Free parking on premises to increase appeal.
- Highlight unique or less common amenities you offer (e.g., hot tub, dedicated workspace, EV charger) in your listing description and photos.
- Regularly check competitor amenities in Hvasser to stay competitive.
Hvasser Airbnb Guest Demographics & Profile Analysis (2025)
Guest Profile Summary for Hvasser
- The typical guest profile for Airbnb in Hvasser consists of primarily domestic travelers (80%), often arriving from nearby Oslo, typically belonging to the Post-2000s (Gen Z/Alpha) group (50%), primarily speaking English or Norwegian.
- Domestic travelers account for 80.0% of guests.
- Key international markets include Norway (80%) and Spain (2.5%).
- Top languages spoken are English (42.1%) followed by Norwegian (36.8%).
- A significant demographic segment is the Post-2000s (Gen Z/Alpha) group, representing 50% of guests.
Recommendations for Hosts
- Target domestic marketing efforts towards travelers from Oslo and Tønsberg.
- Tailor amenities and listing descriptions to appeal to the dominant Post-2000s (Gen Z/Alpha) demographic (e.g., highlight fast WiFi, smart home features, local guides).
- Highlight unique local experiences or amenities relevant to the primary guest profile.
- Consider seasonal promotions aligned with peak travel times for key origin markets.
Nearby Short-Term Rental Market Comparison
How does the Hvasser Airbnb market stack up against its neighbors? Compare key performance metrics like average monthly revenue, ADR, and occupancy rates in surrounding areas to understand the broader regional STR landscape.
| Market | Active Properties | Monthly Revenue | Daily Rate | Avg. Occupancy |
|---|---|---|---|---|
| Stange | 54 | $2,554 | $231.99 | 40% |
| Krødsherad | 81 | $1,872 | $219.31 | 40% |
| Fenstad | 12 | $1,843 | $171.18 | 38% |
| Flå | 88 | $1,812 | $212.63 | 37% |
| Starrkärr och Näs | 11 | $1,795 | $249.46 | 22% |
| Enebakk | 34 | $1,759 | $129.57 | 48% |
| Lier | 13 | $1,654 | $283.01 | 37% |
| Budor | 52 | $1,593 | $211.02 | 33% |
| Melsomvik | 15 | $1,550 | $135.11 | 41% |
| Lunner | 23 | $1,525 | $154.92 | 38% |