Sally Peachie Airbnb Market Analysis 2025: Short Term Rental Data & Vacation Rental Statistics in South Caribbean Coast, Nicaragua
Is Airbnb profitable in Sally Peachie in 2025? Explore comprehensive Airbnb analytics for Sally Peachie, South Caribbean Coast, Nicaragua to uncover income potential. This 2025 STR market report for Sally Peachie, based on AirROI data from April 2024 to March 2025, reveals key trends in the niche market of 19 active listings.
Whether you're considering an Airbnb investment in Sally Peachie, optimizing your existing vacation rental, or exploring rental arbitrage opportunities, understanding the Sally Peachie Airbnb data is crucial. Leveraging the low regulation environment is key to maximizing your short term rental income potential. Let's dive into the specifics.
Key Sally Peachie Airbnb Performance Metrics Overview
Monthly Airbnb Revenue Variations & Income Potential in Sally Peachie (2025)
Understanding the monthly revenue variations for Airbnb listings in Sally Peachie is key to maximizing your short term rental income potential. Seasonality significantly impacts earnings. Our analysis, based on data from the past 12 months, shows that the peak revenue month for STRs in Sally Peachie is typically June, while November often presents the lowest earnings, highlighting opportunities for strategic pricing adjustments during shoulder and low seasons. Explore the typical Airbnb income in Sally Peachie across different performance tiers:
- Best-in-class properties (Top 10%) achieve $1,258+ monthly, often utilizing dynamic pricing and superior guest experiences.
- Strong performing properties (Top 25%) earn $867 or more, indicating effective management and desirable locations/amenities.
- Typical properties (Median) generate around $482 per month, representing the average market performance.
- Entry-level properties (Bottom 25%) see earnings around $289, often with potential for optimization.
Average Monthly Airbnb Earnings Trend in Sally Peachie
Sally Peachie Airbnb Occupancy Rate Trends (2025)
Maximize your bookings by understanding the Sally Peachie STR occupancy trends. Seasonal demand shifts significantly influence how often properties are booked. Typically, Februarysees the highest demand (peak season occupancy), while November experiences the lowest (low season). Effective strategies, like adjusting minimum stays or offering promotions, can boost occupancy during slower periods. Here's how different property tiers perform in Sally Peachie:
- Best-in-class properties (Top 10%) achieve 73%+ occupancy, indicating high desirability and potentially optimized availability.
- Strong performing properties (Top 25%) maintain 55% or higher occupancy, suggesting good market fit and guest satisfaction.
- Typical properties (Median) have an occupancy rate around 28%.
- Entry-level properties (Bottom 25%) average 16% occupancy, potentially facing higher vacancy.
Average Monthly Occupancy Rate Trend in Sally Peachie
Average Daily Rate (ADR) Airbnb Trends in Sally Peachie (2025)
Effective short term rental pricing strategy in Sally Peachie involves understanding monthly ADR fluctuations. The Average Daily Rate (ADR) for Airbnb in Sally Peachie typically peaks in July and dips lowest during December. Leveraging Airbnb dynamic pricing tools or strategies based on this seasonality can significantly boost revenue. Here's a look at the typical nightly rates achieved:
- Best-in-class properties (Top 10%) command rates of $80+ per night, often due to premium features or locations.
- Strong performing properties (Top 25%) achieve nightly rates of $69 or more.
- Typical properties (Median) charge around $48 per night.
- Entry-level properties (Bottom 25%) earn around $31 per night.
Average Daily Rate (ADR) Trend by Month in Sally Peachie
Get Live Sally Peachie Market Intelligence 👇

Explore Real-time Analytics
Airbnb Seasonality Analysis & Trends in Sally Peachie (2025)
Peak Season (June, April, May)
- Revenue averages $1,004 per month
- Occupancy rates average 40.4%
- Daily rates average $58
Shoulder Season
- Revenue averages $549 per month
- Occupancy maintains around 36.1%
- Daily rates hold near $56
Low Season (September, October, November)
- Revenue drops to average $397 per month
- Occupancy decreases to average 29.8%
- Daily rates adjust to average $57
Seasonality Insights for Sally Peachie
- The Airbnb seasonality in Sally Peachie shows highly seasonal trends requiring careful strategy. While the sections above show seasonal averages, it's also insightful to look at the extremes:
- During the high season, the absolute peak month showcases Sally Peachie's highest earning potential, with monthly revenues capable of climbing to $1,160, occupancy reaching a high of 49.7%, and ADRs peaking at $59.
- Conversely, the slowest single month of the year, typically falling within the low season, marks the market's lowest point. In this month, revenue might dip to $348, occupancy could drop to 27.0%, and ADRs may adjust down to $54.
- Understanding both the seasonal averages and these monthly peaks and troughs in revenue, occupancy, and ADR is crucial for maximizing your Airbnb profit potential in Sally Peachie.
Seasonal Strategies for Maximizing Profit
- Peak Season: Maximize revenue through premium pricing and potentially longer minimum stays. Ensure high availability.
- Low Season: Offer competitive pricing, special promotions (e.g., extended stay discounts), and flexible cancellation policies. Target off-season travelers like remote workers or budget-conscious guests.
- Shoulder Seasons: Implement dynamic pricing that balances peak and low rates. Target weekend travelers or specific events. Offer slightly more flexible terms than peak season.
- Regularly analyze your own performance against these Sally Peachie seasonality benchmarks and adjust your pricing and availability strategy accordingly.
Best Areas for Airbnb Investment in Sally Peachie (2025)
Exploring the top neighborhoods for short-term rentals in Sally Peachie? This section highlights key areas, outlining why they are attractive for hosts and guests, along with notable local attractions. Consider these locations based on your target guest profile and investment strategy.
| Neighborhood / Area | Why Host Here? (Target Guests & Appeal) | Key Attractions & Landmarks |
|---|---|---|
| San Juan del Sur | A popular surf town known for its laid-back vibe and vibrant nightlife. Ideal for beach lovers and surfers seeking community and adventure. | San Juan del Sur beach, Maderas Beach, Christ of the Mercy statue, Surfing schools, Local seafood restaurants |
| Granada | A charming colonial city with beautiful architecture and a rich history. Attracts tourists looking for culture, history, and scenic views by Lake Nicaragua. | Lake Nicaragua, Catedral de Granada, Islets of Granada, Mombacho Volcano, Granada market |
| Tola | Known for its stunning beaches and proximity to surf spots, Tola attracts surfers and beachgoers looking for a more tranquil environment. | Playa Santana, Colorado Beach, Popoyo Beach, Panga Drops Surf Spot, Pelican Eyes Resort |
| Masaya | Famous for its artisan markets and the Masaya Volcano, it attracts tourists interested in local culture and nature. | Masaya Volcano National Park, Masaya Artisan Market, Cerro Nindirí, Coyotepe Fortress, Local handicrafts |
| Little Corn Island | A remote paradise with stunning crystal-clear waters, perfect for relaxation, diving, and snorkeling. Attracts backpackers and eco-tourists. | Farallon Beach, Blowing Rock, Snorkeling and Diving spots, Creole culture, Local beach bars |
| Ometepe Island | A unique island formed by two volcanoes, Ometepe offers natural beauty, hiking, and wildlife experiences for nature lovers. | Maderas Volcano, Conception Volcano, Ometepe Biological Reserve, Laguna de Charco Verde, Local farms |
| Rivas | A gateway to the southern Pacific coast, with access to beautiful beaches and lakes. Convenient for tourist activities and explorations. | Lake Cocibolca, Rivas market, Tiscapa Lagoon, Nearby beaches, Local eateries |
| Popoyo | A surf destination known for its consistent waves and surf schools. Popular among surfers and those seeking a relaxed beach atmosphere. | Popoyo Beach, Surfing lessons, Local surf cafes, Natural beauty, Beachside chill spots |
Understanding Airbnb License Requirements & STR Laws in Sally Peachie (2025)
While Sally Peachie, South Caribbean Coast, Nicaragua currently shows low STR regulations, specific Airbnb license requirements might still exist or change. Always verify the latest short term rental regulations and Airbnb license requirements directly with local government authorities for Sally Peachie to ensure full compliance before hosting.
(Source: AirROI data, 2025, finding no licensed listings among those analyzed)
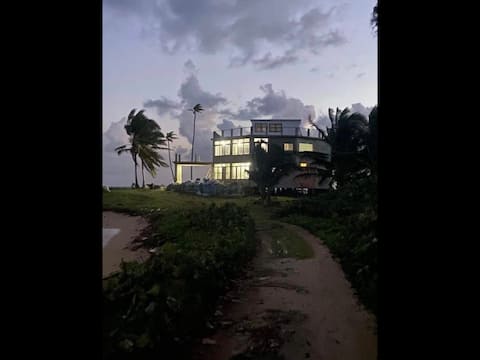
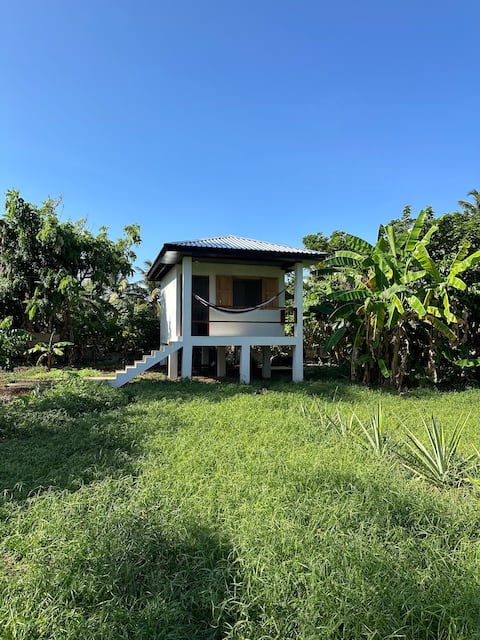
Top Performing Airbnb Properties in Sally Peachie (2025)
Benchmark your potential! Explore examples of top-performing Airbnb properties in Sally Peachiebased on Trailing Twelve Month (TTM) revenue. Analyze their characteristics, revenue, occupancy rate, and ADR to understand what drives success in this market.

Beachfront Hotel-Barracuda Room at Mama Lola’s
Private Room • 1 bedroom

Beachfront Hotel- Breezy Room at Mama Lola’s
Private Room • N/A
Beachfront Hotel, Seaside Room at Mama Lola’s
Private Room • 1 bedroom

Casa Slim-Silversand AB
Private Room • 2 bedrooms

Ocean View Apartment 1 of 2
Entire Place • 2 bedrooms
Silversands Retreat
Private Room • N/A
Note: Performance varies based on location, size, amenities, seasonality, and management quality. Data reflects the past 12 months.
Top Performing Airbnb Hosts in Sally Peachie (2025)
Learn from the best! This table showcases top-performing Airbnb hosts in Sally Peachie based on the number of properties managed and estimated total revenue over the past year. Analyze their scale and performance metrics.
| Host Name | Properties | Grossing Revenue | Stay Reviews | Avg Rating |
|---|---|---|---|---|
| Patricia | 4 | $38,813 | 25 | 5.00/5.0 |
| Slim | 3 | $16,248 | 53 | 4.97/5.0 |
| Jonathan | 2 | $9,930 | 17 | 4.75/5.0 |
| Dane Raydell | 2 | $5,741 | 8 | 4.63/5.0 |
| Beverley | 1 | $5,565 | 5 | 5.00/5.0 |
| Host #292891392 | 1 | $3,905 | 1 | 0.00/5.0 |
| Host #124654190 | 2 | $1,552 | 2 | 0.00/5.0 |
| Pansie | 3 | $797 | 98 | 4.58/5.0 |
| Aura Elena | 1 | $441 | 64 | 4.84/5.0 |
Analyzing the strategies of top hosts, such as their property selection, pricing, and guest communication, can offer valuable lessons for optimizing your own Airbnb operations in Sally Peachie.
Dive Deeper: Advanced Sally Peachie STR Market Data (2025)
Ready to unlock more insights? AirROI provides access to advanced metrics and comprehensive Airbnb data for Sally Peachie. Explore detailed analytics beyond this report to refine your investment strategy, optimize pricing, and maximize your vacation rental profits.
Explore Advanced MetricsSally Peachie Short-Term Rental Market Composition (2025): Property & Room Types
Room Type Distribution
Property Type Distribution
Market Composition Insights for Sally Peachie
- The Sally Peachie Airbnb market composition is heavily skewed towards Private Room listings, which make up 73.7% of the 19 active rentals. This indicates strong guest preference for privacy and space.
- Looking at the property type distribution in Sally Peachie, Hotel/Boutique properties are the most common (63.2%), reflecting the local real estate landscape.
- Houses represent a significant 15.8% portion, catering likely to families or larger groups.
- The presence of 63.2% Hotel/Boutique listings indicates integration with traditional hospitality.
Sally Peachie Airbnb Room Capacity Analysis (2025): Bedroom Distribution
Distribution of Listings by Number of Bedrooms
Room Capacity Insights for Sally Peachie
- The dominant room capacity in Sally Peachie is 1 bedroom listings, making up 36.8% of the market. This suggests a strong demand for properties suitable for couples or solo travelers.
- Together, 1 bedroom and 2 bedrooms properties represent 68.4% of the active Airbnb listings in Sally Peachie, indicating a high concentration in these sizes.
- Listings with 3+ bedrooms (5.3%) represent a smaller niche, potentially indicating an underserved market for larger group accommodations in Sally Peachie.
Sally Peachie Vacation Rental Guest Capacity Trends (2025)
Distribution of Listings by Guest Capacity
Guest Capacity Insights for Sally Peachie
- The most common guest capacity trend in Sally Peachie vacation rentals is listings accommodating 2 guests (21.1%). This suggests the primary traveler segment is likely couples or solo travelers.
- Properties designed for 2 guests and 4 guests dominate the Sally Peachie STR market, accounting for 36.9% of listings.
- On average, properties in Sally Peachie are equipped to host 1.9 guests.
Sally Peachie Airbnb Booking Patterns (2025): Available vs. Booked Days
Available Days Distribution
Booked Days Distribution
Booking Pattern Insights for Sally Peachie
- The most common availability pattern in Sally Peachie falls within the 271-366 days range, representing 63.2% of listings. This suggests many properties have significant open periods on their calendars.
- Approximately 79.0% of listings show high availability (181+ days open annually), indicating potential for increased bookings or specific owner usage patterns.
- For booked days, the 31-90 days range is most frequent in Sally Peachie (31.6%), reflecting common guest stay durations or potential owner blocking patterns.
- A notable 21.1% of properties secure long booking periods (181+ days booked per year), highlighting successful long-term rental strategies or significant owner usage.
Sally Peachie Airbnb Minimum Stay Requirements Analysis
Distribution of Listings by Minimum Night Requirement
1 Night
11 listings
61.1% of total
2 Nights
5 listings
27.8% of total
4-6 Nights
1 listings
5.6% of total
30+ Nights
1 listings
5.6% of total
Key Insights
- The most prevalent minimum stay requirement in Sally Peachie is 1 Night, adopted by 61.1% of listings. This highlights the market's preference for shorter, flexible bookings.
- A strong majority (88.9%) of the Sally Peachie Airbnb data shows acceptance of very short stays (1-2 nights), indicating a dynamic, high-turnover market.
Recommendations
- Align with the market by considering a 1 Night minimum stay, as 61.1% of Sally Peachie hosts use this setting.
- Explore offering discounts for stays of 30+ nights to attract the 5.6% of the market seeking extended stays.
- Adjust minimum nights based on seasonality – potentially shorter during low season and longer during peak demand periods in Sally Peachie.
Sally Peachie Airbnb Cancellation Policy Trends Analysis (2025)
Flexible
6 listings
37.5% of total
Moderate
4 listings
25% of total
Firm
4 listings
25% of total
Strict
2 listings
12.5% of total
Cancellation Policy Insights for Sally Peachie
- The prevailing Airbnb cancellation policy trend in Sally Peachie is Flexible, used by 37.5% of listings.
- There's a relatively balanced mix between guest-friendly (62.5%) and stricter (37.5%) policies, offering choices for different guest needs.
Recommendations for Hosts
- Consider adopting a Flexible policy to align with the 37.5% market standard in Sally Peachie.
- Using a Strict policy might deter some guests, as only 12.5% of listings use it. Evaluate if potential revenue protection outweighs possible lower booking rates.
- Regularly review your cancellation policy against competitors and market demand shifts in Sally Peachie.
Sally Peachie STR Booking Lead Time Analysis (2025)
Average Booking Lead Time by Month
Booking Lead Time Insights for Sally Peachie
- The overall average booking lead time for vacation rentals in Sally Peachie is 23 days.
- Guests book furthest in advance for stays during February (average 41 days), likely coinciding with peak travel demand or local events.
- The shortest booking windows occur for stays in July (average 2 days), indicating more last-minute travel plans during this time.
- Seasonally, Winter (29 days avg.) sees the longest lead times, while Summer (3 days avg.) has the shortest, reflecting typical travel planning cycles.
Recommendations for Hosts
- Use the overall average lead time (23 days) as a baseline for your pricing and availability strategy in Sally Peachie.
- For February stays, consider implementing length-of-stay discounts or slightly higher rates for bookings made less than 41 days out to capitalize on advance planning.
- During July, focus on last-minute booking availability and promotions, as guests book with very short notice (2 days avg.).
- Target marketing efforts for the Winter season well in advance (at least 29 days) to capture early planners.
- Monitor your own booking lead times against these Sally Peachie averages to identify opportunities for dynamic pricing adjustments.
Popular & Essential Airbnb Amenities in Sally Peachie (2025)
Amenity Prevalence
Amenity Insights for Sally Peachie
- Popular amenities like Wifi, Kitchen, Free parking on premises are common but not universal. Offering these can provide a competitive edge.
- Warning: Wifi is not universally provided but is considered essential globally. Ensure reliable Wifi is offered.
Recommendations for Hosts
- Consider adding popular differentiators like Wifi or Kitchen to increase appeal.
- Highlight unique or less common amenities you offer (e.g., hot tub, dedicated workspace, EV charger) in your listing description and photos.
- Regularly check competitor amenities in Sally Peachie to stay competitive.
Sally Peachie Airbnb Guest Demographics & Profile Analysis (2025)
Guest Profile Summary for Sally Peachie
- The typical guest profile for Airbnb in Sally Peachie consists of predominantly international visitors (97%), with top international origins including Canada, typically belonging to the Post-2000s (Gen Z/Alpha) group (50%), primarily speaking English or Spanish.
- Domestic travelers account for 3.1% of guests.
- Key international markets include Germany (26.2%) and Canada (15.4%).
- Top languages spoken are English (38.9%) followed by Spanish (21.1%).
- A significant demographic segment is the Post-2000s (Gen Z/Alpha) group, representing 50% of guests.
Recommendations for Hosts
- Focus marketing internationally, particularly towards travelers from Canada.
- Tailor amenities and listing descriptions to appeal to the dominant Post-2000s (Gen Z/Alpha) demographic (e.g., highlight fast WiFi, smart home features, local guides).
- Highlight unique local experiences or amenities relevant to the primary guest profile.
- Consider seasonal promotions aligned with peak travel times for key origin markets.
Nearby Short-Term Rental Market Comparison
How does the Sally Peachie Airbnb market stack up against its neighbors? Compare key performance metrics like average monthly revenue, ADR, and occupancy rates in surrounding areas to understand the broader regional STR landscape.
| Market | Active Properties | Monthly Revenue | Daily Rate | Avg. Occupancy |
|---|---|---|---|---|
| Corn Island (Municipio) | 37 | $511 | $76.71 | 31% |
| Brig Bay | 23 | $417 | $58.16 | 27% |
| South End | 11 | $344 | $52.51 | 32% |