Aley Airbnb Market Analysis 2025: Short Term Rental Data & Vacation Rental Statistics in Mount Lebanon Governorate, Lebanon
Is Airbnb profitable in Aley in 2025? Explore comprehensive Airbnb analytics for Aley, Mount Lebanon Governorate, Lebanon to uncover income potential. This 2025 STR market report for Aley, based on AirROI data from June 2024 to May 2025, reveals key trends in the niche market of 19 active listings.
Whether you're considering an Airbnb investment in Aley, optimizing your existing vacation rental, or exploring rental arbitrage opportunities, understanding the Aley Airbnb data is crucial. Navigating the high regulation landscape is key to maximizing your short term rental income potential. Let's dive into the specifics.
Key Aley Airbnb Performance Metrics Overview
Monthly Airbnb Revenue Variations & Income Potential in Aley (2025)
Understanding the monthly revenue variations for Airbnb listings in Aley is key to maximizing your short term rental income potential. Seasonality significantly impacts earnings. Our analysis, based on data from the past 12 months, shows that the peak revenue month for STRs in Aley is typically October, while December often presents the lowest earnings, highlighting opportunities for strategic pricing adjustments during shoulder and low seasons. Explore the typical Airbnb income in Aley across different performance tiers:
- Best-in-class properties (Top 10%) achieve $1,639+ monthly, often utilizing dynamic pricing and superior guest experiences.
- Strong performing properties (Top 25%) earn $1,003 or more, indicating effective management and desirable locations/amenities.
- Typical properties (Median) generate around $401 per month, representing the average market performance.
- Entry-level properties (Bottom 25%) see earnings around $265, often with potential for optimization.
Average Monthly Airbnb Earnings Trend in Aley
Aley Airbnb Occupancy Rate Trends (2025)
Maximize your bookings by understanding the Aley STR occupancy trends. Seasonal demand shifts significantly influence how often properties are booked. Typically, Marchsees the highest demand (peak season occupancy), while December experiences the lowest (low season). Effective strategies, like adjusting minimum stays or offering promotions, can boost occupancy during slower periods. Here's how different property tiers perform in Aley:
- Best-in-class properties (Top 10%) achieve 51%+ occupancy, indicating high desirability and potentially optimized availability.
- Strong performing properties (Top 25%) maintain 31% or higher occupancy, suggesting good market fit and guest satisfaction.
- Typical properties (Median) have an occupancy rate around 18%.
- Entry-level properties (Bottom 25%) average 14% occupancy, potentially facing higher vacancy.
Average Monthly Occupancy Rate Trend in Aley
Average Daily Rate (ADR) Airbnb Trends in Aley (2025)
Effective short term rental pricing strategy in Aley involves understanding monthly ADR fluctuations. The Average Daily Rate (ADR) for Airbnb in Aley typically peaks in August and dips lowest during April. Leveraging Airbnb dynamic pricing tools or strategies based on this seasonality can significantly boost revenue. Here's a look at the typical nightly rates achieved:
- Best-in-class properties (Top 10%) command rates of $158+ per night, often due to premium features or locations.
- Strong performing properties (Top 25%) achieve nightly rates of $103 or more.
- Typical properties (Median) charge around $71 per night.
- Entry-level properties (Bottom 25%) earn around $53 per night.
Average Daily Rate (ADR) Trend by Month in Aley
Get Live Aley Market Intelligence 👇

Explore Real-time Analytics
Airbnb Seasonality Analysis & Trends in Aley (2025)
Peak Season (October, August, June)
- Revenue averages $1,188 per month
- Occupancy rates average 27.5%
- Daily rates average $105
Shoulder Season
- Revenue averages $621 per month
- Occupancy maintains around 25.3%
- Daily rates hold near $92
Low Season (January, September, December)
- Revenue drops to average $404 per month
- Occupancy decreases to average 17.8%
- Daily rates adjust to average $100
Seasonality Insights for Aley
- The Airbnb seasonality in Aley shows highly seasonal trends requiring careful strategy. While the sections above show seasonal averages, it's also insightful to look at the extremes:
- During the high season, the absolute peak month showcases Aley's highest earning potential, with monthly revenues capable of climbing to $1,614, occupancy reaching a high of 38.7%, and ADRs peaking at $106.
- Conversely, the slowest single month of the year, typically falling within the low season, marks the market's lowest point. In this month, revenue might dip to $347, occupancy could drop to 14.5%, and ADRs may adjust down to $85.
- Understanding both the seasonal averages and these monthly peaks and troughs in revenue, occupancy, and ADR is crucial for maximizing your Airbnb profit potential in Aley.
Seasonal Strategies for Maximizing Profit
- Peak Season: Maximize revenue through premium pricing and potentially longer minimum stays. Ensure high availability.
- Low Season: Offer competitive pricing, special promotions (e.g., extended stay discounts), and flexible cancellation policies. Target off-season travelers like remote workers or budget-conscious guests.
- Shoulder Seasons: Implement dynamic pricing that balances peak and low rates. Target weekend travelers or specific events. Offer slightly more flexible terms than peak season.
- Regularly analyze your own performance against these Aley seasonality benchmarks and adjust your pricing and availability strategy accordingly.
Best Areas for Airbnb Investment in Aley (2025)
Exploring the top neighborhoods for short-term rentals in Aley? This section highlights key areas, outlining why they are attractive for hosts and guests, along with notable local attractions. Consider these locations based on your target guest profile and investment strategy.
| Neighborhood / Area | Why Host Here? (Target Guests & Appeal) | Key Attractions & Landmarks |
|---|---|---|
| Aley Center | The bustling center of Aley, known for its shops, restaurants, and cafes. Ideal for tourists looking for a vibrant urban experience with easy access to local amenities. | Aley Souks, Municipal Garden, Old Aley, Aley Viewpoint, Cafes and Restaurants |
| Deir el Qamar | A historical village near Aley known for its charming stone architecture and rich history. Appeals to tourists interested in cultural experiences and beautiful landscapes. | Deir el Qamar Palace, Cedar Forests, Saint George Church, Local handicraft shops, Hiking trails |
| Bhamdoun | A popular resort town located near Aley, known for its cool climate and scenic views. Great for travelers seeking relaxation and nature. | Bhamdoun Palace, Hiking paths, Local restaurants, Scenic viewpoints, Historical sites |
| Moukhales | A quiet village offering stunning views of the surrounding mountains. A perfect getaway for those looking to escape the hustle and bustle of city life. | Nature trails, Stunning vistas, Local cuisine, Traditional Lebanese houses, Outdoor activities |
| Kfarmatta | Famous for its agricultural landscapes and quaint rural charm. This area attracts visitors wanting an authentic countryside experience | Local farms, Agritourism, Scenic countryside, Fresh produce markets, Village festivals |
| Khalde | An area that borders the coast, combining mountain and seaside attractions. Ideal for guests wanting both beach and hill experiences. | Khalde Beach, Historical sites, Walking trails, Seafood restaurants, Cafes with views |
| Lebanon Mountain Trail | A long-distance hiking trail that passes through beautiful landscapes. Draws nature enthusiasts and adventure seekers. | Hiking routes, Scenic viewpoints, Wildlife, Local flora, Cultural sites |
| Chouf Mountains | A region known for its impressive mountain scenery and traditional villages. Popular with tourists looking for adventure and scenic beauty. | Qadisha Valley, Chouf Biosphere Reserve, Historic villages, Outdoor sports, Local festivals |
Understanding Airbnb License Requirements & STR Laws in Aley (2025)
Yes, Aley, Mount Lebanon Governorate, Lebanon enforces high STR regulations. Obtaining a license and ensuring compliance is almost certainly required according to current 2025 STR laws. Always verify the latest short term rental regulations and Airbnb license requirements directly with local government authorities for Aley to ensure full compliance before hosting.
(Source: AirROI data, 2025, based on 32% licensed listings)
Top Performing Airbnb Properties in Aley (2025)
Benchmark your potential! Explore examples of top-performing Airbnb properties in Aleybased on Trailing Twelve Month (TTM) revenue. Analyze their characteristics, revenue, occupancy rate, and ADR to understand what drives success in this market.

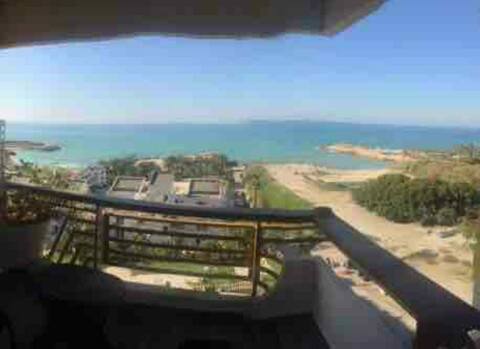
Veil 3-Bedroom Apartment in Aley
Entire Place • 3 bedrooms

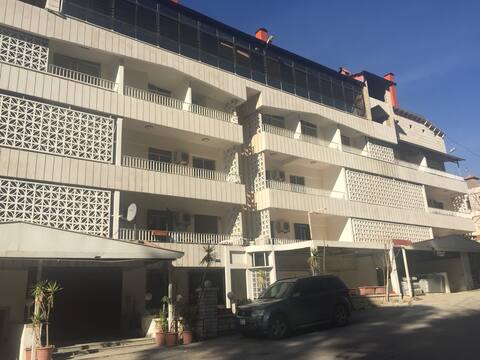
Duplex with breathtaking view 24h electricity
Entire Place • 3 bedrooms
Solemar resort,generator is included,sea view,wifi
Entire Place • 1 bedroom
Estiraha Residence , best view ever
Entire Place • 1 bedroom

Aley, Lovely 3 bedrooms with pool A3
Entire Place • 3 bedrooms

2BR, 1BA condo in Aley center!
Entire Place • 2 bedrooms
Note: Performance varies based on location, size, amenities, seasonality, and management quality. Data reflects the past 12 months.
Top Performing Airbnb Hosts in Aley (2025)
Learn from the best! This table showcases top-performing Airbnb hosts in Aley based on the number of properties managed and estimated total revenue over the past year. Analyze their scale and performance metrics.
| Host Name | Properties | Grossing Revenue | Stay Reviews | Avg Rating |
|---|---|---|---|---|
| Local Host | 1 | $15,579 | 17 | 4.82/5.0 |
| Rita | 1 | $9,895 | 4 | 5.00/5.0 |
| Ronald | 1 | $4,882 | 3 | 4.67/5.0 |
| Host #9897709 | 1 | $3,217 | 0 | N/A/5.0 |
| Nessrine | 1 | $3,174 | 4 | 5.00/5.0 |
| Host #489744493 | 3 | $2,942 | 0 | N/A/5.0 |
| Host #512924973 | 1 | $2,907 | 0 | N/A/5.0 |
| Host #520217450 | 1 | $2,896 | 0 | N/A/5.0 |
| Host #72820592 | 1 | $2,197 | 0 | N/A/5.0 |
| Host #526014164 | 1 | $1,619 | 0 | N/A/5.0 |
Analyzing the strategies of top hosts, such as their property selection, pricing, and guest communication, can offer valuable lessons for optimizing your own Airbnb operations in Aley.
Dive Deeper: Advanced Aley STR Market Data (2025)
Ready to unlock more insights? AirROI provides access to advanced metrics and comprehensive Airbnb data for Aley. Explore detailed analytics beyond this report to refine your investment strategy, optimize pricing, and maximize your vacation rental profits.
Explore Advanced MetricsAley Short-Term Rental Market Composition (2025): Property & Room Types
Room Type Distribution
Property Type Distribution
Market Composition Insights for Aley
- The Aley Airbnb market composition is heavily skewed towards Entire Home/Apt listings, which make up 100% of the 19 active rentals. This indicates strong guest preference for privacy and space.
- Looking at the property type distribution in Aley, Apartment/Condo properties are the most common (89.5%), reflecting the local real estate landscape.
Aley Airbnb Room Capacity Analysis (2025): Bedroom Distribution
Distribution of Listings by Number of Bedrooms
Room Capacity Insights for Aley
- The dominant room capacity in Aley is 2 bedrooms listings, making up 36.8% of the market. This suggests a strong demand for properties suitable for couples or solo travelers.
- Together, 2 bedrooms and 1 bedroom properties represent 68.4% of the active Airbnb listings in Aley, indicating a high concentration in these sizes.
- A significant 31.6% of listings offer 3+ bedrooms, catering to larger groups and families seeking more space in Aley.
Aley Vacation Rental Guest Capacity Trends (2025)
Distribution of Listings by Guest Capacity
Guest Capacity Insights for Aley
- The most common guest capacity trend in Aley vacation rentals is listings accommodating 6 guests (36.8%). This suggests the primary traveler segment is likely larger groups.
- Properties designed for 6 guests and 4 guests dominate the Aley STR market, accounting for 57.9% of listings.
- 47.4% of properties accommodate 6+ guests, serving the market segment for larger families or group travel in Aley.
- On average, properties in Aley are equipped to host 4.8 guests.
Aley Airbnb Booking Patterns (2025): Available vs. Booked Days
Available Days Distribution
Booked Days Distribution
Booking Pattern Insights for Aley
- The most common availability pattern in Aley falls within the 271-366 days range, representing 94.7% of listings. This suggests many properties have significant open periods on their calendars.
- Approximately 100.0% of listings show high availability (181+ days open annually), indicating potential for increased bookings or specific owner usage patterns.
- For booked days, the 1-30 days range is most frequent in Aley (68.4%), reflecting common guest stay durations or potential owner blocking patterns.
Aley Airbnb Minimum Stay Requirements Analysis
Distribution of Listings by Minimum Night Requirement
1 Night
5 listings
26.3% of total
2 Nights
1 listings
5.3% of total
3 Nights
2 listings
10.5% of total
4-6 Nights
1 listings
5.3% of total
7-29 Nights
5 listings
26.3% of total
30+ Nights
5 listings
26.3% of total
Key Insights
- The most prevalent minimum stay requirement in Aley is 1 Night, adopted by 26.3% of listings. This highlights the market's preference for shorter, flexible bookings.
- A significant segment (26.3%) caters to monthly stays (30+ nights) in Aley, pointing to opportunities in the extended-stay market.
Recommendations
- Align with the market by considering a 1 Night minimum stay, as 26.3% of Aley hosts use this setting.
- If feasible, allowing 1-night stays, especially midweek or during low season, could capture last-minute bookings, as only 26.3% currently do.
- Explore offering discounts for stays of 30+ nights to attract the 26.3% of the market seeking extended stays.
- Adjust minimum nights based on seasonality – potentially shorter during low season and longer during peak demand periods in Aley.
Aley Airbnb Cancellation Policy Trends Analysis (2025)
Flexible
3 listings
27.3% of total
Moderate
4 listings
36.4% of total
Firm
1 listings
9.1% of total
Strict
3 listings
27.3% of total
Cancellation Policy Insights for Aley
- The prevailing Airbnb cancellation policy trend in Aley is Moderate, used by 36.4% of listings.
- There's a relatively balanced mix between guest-friendly (63.7%) and stricter (36.4%) policies, offering choices for different guest needs.
Recommendations for Hosts
- Consider adopting a Moderate policy to align with the 36.4% market standard in Aley.
- Regularly review your cancellation policy against competitors and market demand shifts in Aley.
Aley STR Booking Lead Time Analysis (2025)
Average Booking Lead Time by Month
Booking Lead Time Insights for Aley
- The overall average booking lead time for vacation rentals in Aley is 10 days.
- Guests book furthest in advance for stays during June (average 24 days), likely coinciding with peak travel demand or local events.
- The shortest booking windows occur for stays in February (average 1 days), indicating more last-minute travel plans during this time.
- Seasonally, Summer (14 days avg.) sees the longest lead times, while Winter (6 days avg.) has the shortest, reflecting typical travel planning cycles.
Recommendations for Hosts
- Use the overall average lead time (10 days) as a baseline for your pricing and availability strategy in Aley.
- For June stays, consider implementing length-of-stay discounts or slightly higher rates for bookings made less than 24 days out to capitalize on advance planning.
- During February, focus on last-minute booking availability and promotions, as guests book with very short notice (1 days avg.).
- Target marketing efforts for the Summer season well in advance (at least 14 days) to capture early planners.
- Monitor your own booking lead times against these Aley averages to identify opportunities for dynamic pricing adjustments.
Popular & Essential Airbnb Amenities in Aley (2025)
Amenity Prevalence
Amenity Insights for Aley
- Essential amenities in Aley that guests expect include: Washer, Kitchen, TV, Wifi. Lacking these (any) could significantly impact bookings.
- Popular amenities like Hot water, Air conditioning, Heating are common but not universal. Offering these can provide a competitive edge.
Recommendations for Hosts
- Ensure your listing includes all essential amenities for Aley: Washer, Kitchen, TV, Wifi.
- Consider adding popular differentiators like Hot water or Air conditioning to increase appeal.
- Highlight unique or less common amenities you offer (e.g., hot tub, dedicated workspace, EV charger) in your listing description and photos.
- Regularly check competitor amenities in Aley to stay competitive.
Aley Airbnb Guest Demographics & Profile Analysis (2025)
Guest Profile Summary for Aley
- The typical guest profile for Airbnb in Aley consists of predominantly international visitors (82%), with top international origins including Kuwait, typically belonging to the Post-2000s (Gen Z/Alpha) group (50%), primarily speaking English or Arabic.
- Domestic travelers account for 18.2% of guests.
- Key international markets include United States (18.2%) and Kuwait (18.2%).
- Top languages spoken are English (38.1%) followed by Arabic (28.6%).
- A significant demographic segment is the Post-2000s (Gen Z/Alpha) group, representing 50% of guests.
Recommendations for Hosts
- Focus marketing internationally, particularly towards travelers from Kuwait.
- Tailor amenities and listing descriptions to appeal to the dominant Post-2000s (Gen Z/Alpha) demographic (e.g., highlight fast WiFi, smart home features, local guides).
- Highlight unique local experiences or amenities relevant to the primary guest profile.
- Consider seasonal promotions aligned with peak travel times for key origin markets.
Nearby Short-Term Rental Market Comparison
How does the Aley Airbnb market stack up against its neighbors? Compare key performance metrics like average monthly revenue, ADR, and occupancy rates in surrounding areas to understand the broader regional STR landscape.
| Market | Active Properties | Monthly Revenue | Daily Rate | Avg. Occupancy |
|---|---|---|---|---|
| Gilboa Regional Council | 92 | $3,307 | $436.13 | 29% |
| Hof HaCarmel Regional Council | 187 | $2,876 | $558.33 | 30% |
| Emek HaMaayanot Regional Council | 81 | $2,800 | $418.19 | 33% |
| Kadima | 11 | $2,652 | $573.90 | 28% |
| Daliyat al-Karmel | 19 | $2,274 | $354.84 | 28% |
| Aannaya | 11 | $2,257 | $523.45 | 20% |
| Migdal | 71 | $2,253 | $609.08 | 25% |
| Galil Tachton Regional Council | 104 | $2,141 | $411.76 | 26% |
| Yavneel | 40 | $2,090 | $674.39 | 23% |
| Merom HaGalil Regional Council | 115 | $2,089 | $448.54 | 25% |