Mar Mitr Airbnb Market Analysis 2025: Short Term Rental Data & Vacation Rental Statistics in Beirut Governorate, Lebanon
Is Airbnb profitable in Mar Mitr in 2025? Explore comprehensive Airbnb analytics for Mar Mitr, Beirut Governorate, Lebanon to uncover income potential. This 2025 STR market report for Mar Mitr, based on AirROI data from April 2024 to March 2025, reveals key trends in the niche market of 17 active listings.
Whether you're considering an Airbnb investment in Mar Mitr, optimizing your existing vacation rental, or exploring rental arbitrage opportunities, understanding the Mar Mitr Airbnb data is crucial. Leveraging the low regulation environment is key to maximizing your short term rental income potential. Let's dive into the specifics.
Key Mar Mitr Airbnb Performance Metrics Overview
Monthly Airbnb Revenue Variations & Income Potential in Mar Mitr (2025)
Understanding the monthly revenue variations for Airbnb listings in Mar Mitr is key to maximizing your short term rental income potential. Seasonality significantly impacts earnings. Our analysis, based on data from the past 12 months, shows that the peak revenue month for STRs in Mar Mitr is typically July, while October often presents the lowest earnings, highlighting opportunities for strategic pricing adjustments during shoulder and low seasons. Explore the typical Airbnb income in Mar Mitr across different performance tiers:
- Best-in-class properties (Top 10%) achieve $1,647+ monthly, often utilizing dynamic pricing and superior guest experiences.
- Strong performing properties (Top 25%) earn $1,150 or more, indicating effective management and desirable locations/amenities.
- Typical properties (Median) generate around $642 per month, representing the average market performance.
- Entry-level properties (Bottom 25%) see earnings around $380, often with potential for optimization.
Average Monthly Airbnb Earnings Trend in Mar Mitr
Mar Mitr Airbnb Occupancy Rate Trends (2025)
Maximize your bookings by understanding the Mar Mitr STR occupancy trends. Seasonal demand shifts significantly influence how often properties are booked. Typically, Junesees the highest demand (peak season occupancy), while January experiences the lowest (low season). Effective strategies, like adjusting minimum stays or offering promotions, can boost occupancy during slower periods. Here's how different property tiers perform in Mar Mitr:
- Best-in-class properties (Top 10%) achieve 69%+ occupancy, indicating high desirability and potentially optimized availability.
- Strong performing properties (Top 25%) maintain 50% or higher occupancy, suggesting good market fit and guest satisfaction.
- Typical properties (Median) have an occupancy rate around 27%.
- Entry-level properties (Bottom 25%) average 11% occupancy, potentially facing higher vacancy.
Average Monthly Occupancy Rate Trend in Mar Mitr
Average Daily Rate (ADR) Airbnb Trends in Mar Mitr (2025)
Effective short term rental pricing strategy in Mar Mitr involves understanding monthly ADR fluctuations. The Average Daily Rate (ADR) for Airbnb in Mar Mitr typically peaks in July and dips lowest during November. Leveraging Airbnb dynamic pricing tools or strategies based on this seasonality can significantly boost revenue. Here's a look at the typical nightly rates achieved:
- Best-in-class properties (Top 10%) command rates of $132+ per night, often due to premium features or locations.
- Strong performing properties (Top 25%) achieve nightly rates of $106 or more.
- Typical properties (Median) charge around $68 per night.
- Entry-level properties (Bottom 25%) earn around $50 per night.
Average Daily Rate (ADR) Trend by Month in Mar Mitr
Get Live Mar Mitr Market Intelligence 👇

Explore Real-time Analytics
Airbnb Seasonality Analysis & Trends in Mar Mitr (2025)
Peak Season (July, May, June)
- Revenue averages $1,309 per month
- Occupancy rates average 47.1%
- Daily rates average $78
Shoulder Season
- Revenue averages $769 per month
- Occupancy maintains around 31.0%
- Daily rates hold near $78
Low Season (February, October, November)
- Revenue drops to average $452 per month
- Occupancy decreases to average 24.7%
- Daily rates adjust to average $76
Seasonality Insights for Mar Mitr
- The Airbnb seasonality in Mar Mitr shows highly seasonal trends requiring careful strategy. While the sections above show seasonal averages, it's also insightful to look at the extremes:
- During the high season, the absolute peak month showcases Mar Mitr's highest earning potential, with monthly revenues capable of climbing to $1,458, occupancy reaching a high of 48.3%, and ADRs peaking at $80.
- Conversely, the slowest single month of the year, typically falling within the low season, marks the market's lowest point. In this month, revenue might dip to $420, occupancy could drop to 21.5%, and ADRs may adjust down to $75.
- Understanding both the seasonal averages and these monthly peaks and troughs in revenue, occupancy, and ADR is crucial for maximizing your Airbnb profit potential in Mar Mitr.
Seasonal Strategies for Maximizing Profit
- Peak Season: Maximize revenue through premium pricing and potentially longer minimum stays. Ensure high availability.
- Low Season: Offer competitive pricing, special promotions (e.g., extended stay discounts), and flexible cancellation policies. Target off-season travelers like remote workers or budget-conscious guests.
- Shoulder Seasons: Implement dynamic pricing that balances peak and low rates. Target weekend travelers or specific events. Offer slightly more flexible terms than peak season.
- Regularly analyze your own performance against these Mar Mitr seasonality benchmarks and adjust your pricing and availability strategy accordingly.
Best Areas for Airbnb Investment in Mar Mitr (2025)
Exploring the top neighborhoods for short-term rentals in Mar Mitr? This section highlights key areas, outlining why they are attractive for hosts and guests, along with notable local attractions. Consider these locations based on your target guest profile and investment strategy.
| Neighborhood / Area | Why Host Here? (Target Guests & Appeal) | Key Attractions & Landmarks |
|---|---|---|
| Gemmayzeh | A vibrant and artistic neighborhood known for its nightlife, cafés, and galleries. Gemmayzeh is popular with both locals and tourists, making it a prime location for short-term rentals. | Street art and murals, Lively bars and restaurants, Sursock Museum, Gastronomy tours |
| Achrafieh | One of Beirut's most upscale neighborhoods, Achrafieh offers a blend of modern living and historical charm, attracting affluent travelers looking for luxury accommodations. | Shopping in ABC Mall, St. George Church, Beirut Art Center, Cafés and fine dining |
| Mar Mikhael | Known for its cultural scene and vibrant nightlife, Mar Mikhael is a trendy area that attracts young professionals and tourists looking for an authentic Lebanese experience. | Art galleries, Live music venues, Trendy restaurants, Street art |
| Hamra | A bustling commercial and residential area, Hamra is popular among students and expats, providing a dynamic atmosphere and a range of amenities. | Modern shops, American University of Beirut, Cafés and bookstores, Beirut Souks |
| Downtown Beirut | The historic heart of Beirut, filled with restored buildings and bustling with tourists and business people. It offers access to major attractions and nightlife. | Beirut Souks, Zaitunay Bay, Martyrs' Square, National Museum of Beirut |
| Corniche | The beautiful seaside promenade is perfect for tourists seeking scenic views and beachfront activities. It's a prime spot for leisure and recreation. | Walking path by the sea, Beirut Marina, Cafés along the Corniche, Pigeon Rocks |
| Badaro | A charming neighborhood that has recently seen a revival, offering cozy cafés and a relaxed vibe, attractive to both locals and expats. | Local eateries, Art galleries, Community events, Craft markets |
| Jnah | A quieter residential area with access to the coast, Jnah appeals to families and longer-term visitors looking for a peaceful stay with proximity to the city. | Beaches, Local parks, Shopping districts, Residential community atmosphere |
Understanding Airbnb License Requirements & STR Laws in Mar Mitr (2025)
While Mar Mitr, Beirut Governorate, Lebanon currently shows low STR regulations, specific Airbnb license requirements might still exist or change. Always verify the latest short term rental regulations and Airbnb license requirements directly with local government authorities for Mar Mitr to ensure full compliance before hosting.
(Source: AirROI data, 2025, finding no licensed listings among those analyzed)
Top Performing Airbnb Properties in Mar Mitr (2025)
Benchmark your potential! Explore examples of top-performing Airbnb properties in Mar Mitrbased on Trailing Twelve Month (TTM) revenue. Analyze their characteristics, revenue, occupancy rate, and ADR to understand what drives success in this market.
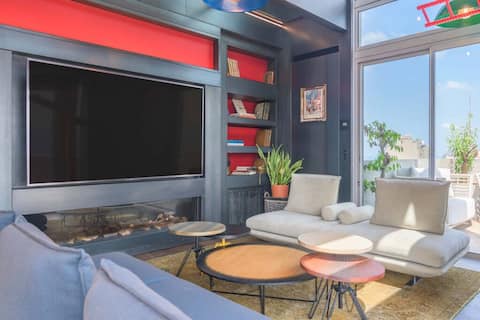
Glamour 3-Bedroom Duplex W/ Terrace in Achrafieh
Entire Place • 3 bedrooms
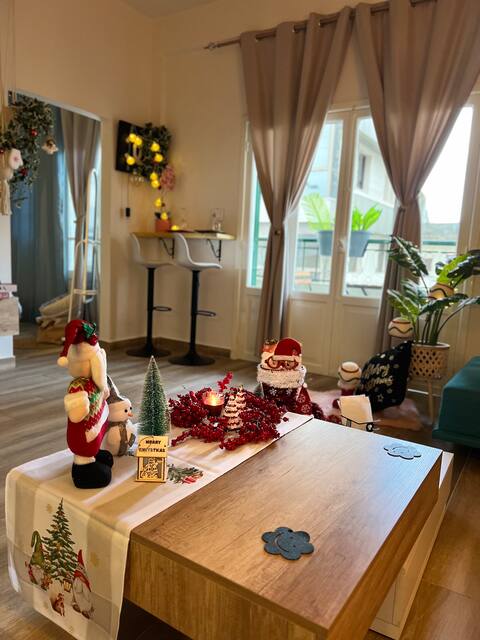
Byout Beirut's M2- Celebrate Christmas! Achrafieh
Entire Place • 1 bedroom
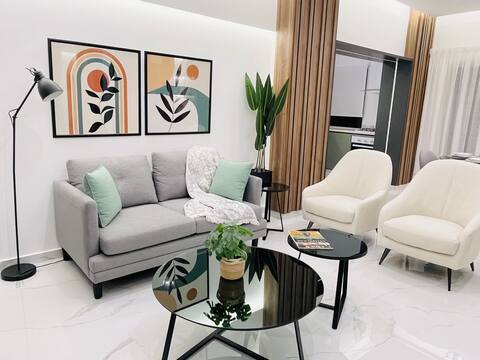
Fancy appart Achrafieh- Sassine (fiberoptic Wifi)
Entire Place • 2 bedrooms
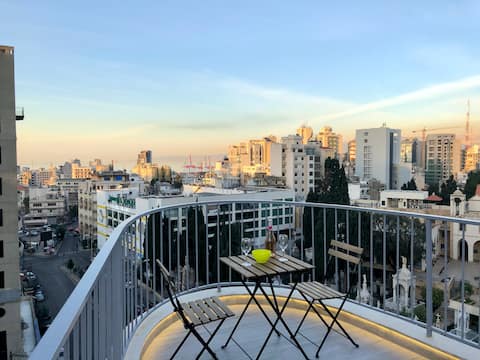
Studio w/ Terrace & Park. - Ashrafieh
Entire Place • N/A

Achrafieh (Shoe Box) Rooftop
Entire Place • N/A
Allure Studio W/Gym in Achrafieh
Entire Place • N/A
Note: Performance varies based on location, size, amenities, seasonality, and management quality. Data reflects the past 12 months.
Top Performing Airbnb Hosts in Mar Mitr (2025)
Learn from the best! This table showcases top-performing Airbnb hosts in Mar Mitr based on the number of properties managed and estimated total revenue over the past year. Analyze their scale and performance metrics.
| Host Name | Properties | Grossing Revenue | Stay Reviews | Avg Rating |
|---|---|---|---|---|
| Diala | 2 | $16,384 | 24 | 4.97/5.0 |
| Pascale | 3 | $16,063 | 122 | 4.99/5.0 |
| Host #488562112 | 1 | $14,588 | 2 | 0.00/5.0 |
| Rouf Stays | 2 | $11,501 | 227 | 2.39/5.0 |
| Rami | 1 | $9,274 | 25 | 4.88/5.0 |
| Stephanie | 1 | $8,931 | 169 | 4.95/5.0 |
| Host #72820592 | 1 | $8,063 | 19 | 4.68/5.0 |
| Host #420924755 | 1 | $6,708 | 2 | 0.00/5.0 |
| IMad | 1 | $4,450 | 199 | 4.97/5.0 |
| Dayf | 1 | $4,213 | 143 | 4.79/5.0 |
Analyzing the strategies of top hosts, such as their property selection, pricing, and guest communication, can offer valuable lessons for optimizing your own Airbnb operations in Mar Mitr.
Dive Deeper: Advanced Mar Mitr STR Market Data (2025)
Ready to unlock more insights? AirROI provides access to advanced metrics and comprehensive Airbnb data for Mar Mitr. Explore detailed analytics beyond this report to refine your investment strategy, optimize pricing, and maximize your vacation rental profits.
Explore Advanced MetricsMar Mitr Short-Term Rental Market Composition (2025): Property & Room Types
Room Type Distribution
Property Type Distribution
Market Composition Insights for Mar Mitr
- The Mar Mitr Airbnb market composition is heavily skewed towards Entire Home/Apt listings, which make up 64.7% of the 17 active rentals. This indicates strong guest preference for privacy and space.
- However, a notable 35.3% share for Private Rooms suggests opportunities for budget-conscious travelers or hosts renting out spare rooms.
- Looking at the property type distribution in Mar Mitr, Apartment/Condo properties are the most common (76.5%), reflecting the local real estate landscape.
- Houses represent a significant 23.5% portion, catering likely to families or larger groups.
Mar Mitr Airbnb Room Capacity Analysis (2025): Bedroom Distribution
Distribution of Listings by Number of Bedrooms
Room Capacity Insights for Mar Mitr
- The dominant room capacity in Mar Mitr is 1 bedroom listings, making up 35.3% of the market. This suggests a strong demand for properties suitable for couples or solo travelers.
- Together, 1 bedroom and 2 bedrooms properties represent 64.7% of the active Airbnb listings in Mar Mitr, indicating a high concentration in these sizes.
- Listings with 3+ bedrooms (5.9%) represent a smaller niche, potentially indicating an underserved market for larger group accommodations in Mar Mitr.
Mar Mitr Vacation Rental Guest Capacity Trends (2025)
Distribution of Listings by Guest Capacity
Guest Capacity Insights for Mar Mitr
- The most common guest capacity trend in Mar Mitr vacation rentals is listings accommodating 2 guests (35.3%). This suggests the primary traveler segment is likely couples or solo travelers.
- Properties designed for 2 guests and 4 guests dominate the Mar Mitr STR market, accounting for 52.9% of listings.
- A significant 47.1% of listings cater specifically to 1-2 guests, highlighting strong demand from couples and solo travelers in Mar Mitr.
- On average, properties in Mar Mitr are equipped to host 2.4 guests.
Mar Mitr Airbnb Booking Patterns (2025): Available vs. Booked Days
Available Days Distribution
Booked Days Distribution
Booking Pattern Insights for Mar Mitr
- The most common availability pattern in Mar Mitr falls within the 271-366 days range, representing 58.8% of listings. This suggests many properties have significant open periods on their calendars.
- Approximately 100.0% of listings show high availability (181+ days open annually), indicating potential for increased bookings or specific owner usage patterns.
- For booked days, the 31-90 days range is most frequent in Mar Mitr (47.1%), reflecting common guest stay durations or potential owner blocking patterns.
Mar Mitr Airbnb Minimum Stay Requirements Analysis
Distribution of Listings by Minimum Night Requirement
1 Night
4 listings
28.6% of total
2 Nights
6 listings
42.9% of total
3 Nights
1 listings
7.1% of total
7-29 Nights
2 listings
14.3% of total
30+ Nights
1 listings
7.1% of total
Key Insights
- The most prevalent minimum stay requirement in Mar Mitr is 2 Nights, adopted by 42.9% of listings. This highlights the market's preference for shorter, flexible bookings.
- A strong majority (71.5%) of the Mar Mitr Airbnb data shows acceptance of very short stays (1-2 nights), indicating a dynamic, high-turnover market.
Recommendations
- Align with the market by considering a 2 Nights minimum stay, as 42.9% of Mar Mitr hosts use this setting.
- If feasible, allowing 1-night stays, especially midweek or during low season, could capture last-minute bookings, as only 28.6% currently do.
- Explore offering discounts for stays of 30+ nights to attract the 7.1% of the market seeking extended stays.
- Adjust minimum nights based on seasonality – potentially shorter during low season and longer during peak demand periods in Mar Mitr.
Mar Mitr Airbnb Cancellation Policy Trends Analysis (2025)
Moderate
7 listings
63.6% of total
Firm
3 listings
27.3% of total
Strict
1 listings
9.1% of total
Cancellation Policy Insights for Mar Mitr
- The prevailing Airbnb cancellation policy trend in Mar Mitr is Moderate, used by 63.6% of listings.
- There's a relatively balanced mix between guest-friendly (63.6%) and stricter (36.4%) policies, offering choices for different guest needs.
- Strict cancellation policies are quite rare (9.1%), potentially making listings with this policy less competitive unless justified by high demand or property type.
Recommendations for Hosts
- Consider adopting a Moderate policy to align with the 63.6% market standard in Mar Mitr.
- Using a Strict policy might deter some guests, as only 9.1% of listings use it. Evaluate if potential revenue protection outweighs possible lower booking rates.
- Regularly review your cancellation policy against competitors and market demand shifts in Mar Mitr.
Mar Mitr STR Booking Lead Time Analysis (2025)
Average Booking Lead Time by Month
Booking Lead Time Insights for Mar Mitr
- The overall average booking lead time for vacation rentals in Mar Mitr is 20 days.
- Guests book furthest in advance for stays during July (average 33 days), likely coinciding with peak travel demand or local events.
- The shortest booking windows occur for stays in September (average 3 days), indicating more last-minute travel plans during this time.
- Seasonally, Summer (27 days avg.) sees the longest lead times, while Fall (10 days avg.) has the shortest, reflecting typical travel planning cycles.
Recommendations for Hosts
- Use the overall average lead time (20 days) as a baseline for your pricing and availability strategy in Mar Mitr.
- For July stays, consider implementing length-of-stay discounts or slightly higher rates for bookings made less than 33 days out to capitalize on advance planning.
- During September, focus on last-minute booking availability and promotions, as guests book with very short notice (3 days avg.).
- Target marketing efforts for the Summer season well in advance (at least 27 days) to capture early planners.
- Monitor your own booking lead times against these Mar Mitr averages to identify opportunities for dynamic pricing adjustments.
Popular & Essential Airbnb Amenities in Mar Mitr (2025)
Amenity Prevalence
Amenity Insights for Mar Mitr
- Essential amenities in Mar Mitr that guests expect include: Hot water, Kitchen, Air conditioning, Heating, Wifi. Lacking these (any) could significantly impact bookings.
- Popular amenities like Washer, TV, Essentials are common but not universal. Offering these can provide a competitive edge.
Recommendations for Hosts
- Ensure your listing includes all essential amenities for Mar Mitr: Hot water, Kitchen, Air conditioning, Heating, Wifi.
- Consider adding popular differentiators like Washer or TV to increase appeal.
- Highlight unique or less common amenities you offer (e.g., hot tub, dedicated workspace, EV charger) in your listing description and photos.
- Regularly check competitor amenities in Mar Mitr to stay competitive.
Mar Mitr Airbnb Guest Demographics & Profile Analysis (2025)
Guest Profile Summary for Mar Mitr
- The typical guest profile for Airbnb in Mar Mitr consists of predominantly international visitors (69%), with top international origins including United States, typically belonging to the Post-2000s (Gen Z/Alpha) group (50%), primarily speaking English or Arabic.
- Domestic travelers account for 31.1% of guests.
- Key international markets include Lebanon (31.1%) and United States (11.5%).
- Top languages spoken are English (35.2%) followed by Arabic (25.4%).
- A significant demographic segment is the Post-2000s (Gen Z/Alpha) group, representing 50% of guests.
Recommendations for Hosts
- Focus marketing internationally, particularly towards travelers from United States.
- Tailor amenities and listing descriptions to appeal to the dominant Post-2000s (Gen Z/Alpha) demographic (e.g., highlight fast WiFi, smart home features, local guides).
- Highlight unique local experiences or amenities relevant to the primary guest profile.
- Consider seasonal promotions aligned with peak travel times for key origin markets.
Nearby Short-Term Rental Market Comparison
How does the Mar Mitr Airbnb market stack up against its neighbors? Compare key performance metrics like average monthly revenue, ADR, and occupancy rates in surrounding areas to understand the broader regional STR landscape.
| Market | Active Properties | Monthly Revenue | Daily Rate | Avg. Occupancy |
|---|---|---|---|---|
| Kadima | 11 | $4,564 | $519.75 | 32% |
| Gilboa Regional Council | 75 | $3,602 | $431.74 | 32% |
| Emek HaMaayanot Regional Council | 63 | $3,455 | $424.79 | 38% |
| Hof HaCarmel Regional Council | 170 | $3,038 | $553.02 | 31% |
| Daliyat al-Karmel | 16 | $2,735 | $383.12 | 29% |
| Migdal | 62 | $2,570 | $614.97 | 22% |
| Zikhron Yaakov | 78 | $2,420 | $274.17 | 34% |
| Aannaya | 11 | $2,325 | $516.04 | 23% |
| Alona Regional Council | 16 | $2,270 | $303.23 | 37% |
| Merom HaGalil Regional Council | 83 | $2,193 | $455.58 | 25% |