Priory Airbnb Market Analysis 2025: Short Term Rental Data & Vacation Rental Statistics in Saint Ann, Jamaica
Is Airbnb profitable in Priory in 2025? Explore comprehensive Airbnb analytics for Priory, Saint Ann, Jamaica to uncover income potential. This 2025 STR market report for Priory, based on AirROI data from April 2024 to March 2025, reveals key trends in the niche market of 132 active listings.
Whether you're considering an Airbnb investment in Priory, optimizing your existing vacation rental, or exploring rental arbitrage opportunities, understanding the Priory Airbnb data is crucial. Leveraging the low regulation environment is key to maximizing your short term rental income potential. Let's dive into the specifics.
Key Priory Airbnb Performance Metrics Overview
Monthly Airbnb Revenue Variations & Income Potential in Priory (2025)
Understanding the monthly revenue variations for Airbnb listings in Priory is key to maximizing your short term rental income potential. Seasonality significantly impacts earnings. Our analysis, based on data from the past 12 months, shows that the peak revenue month for STRs in Priory is typically July, while March often presents the lowest earnings, highlighting opportunities for strategic pricing adjustments during shoulder and low seasons. Explore the typical Airbnb income in Priory across different performance tiers:
- Best-in-class properties (Top 10%) achieve $4,319+ monthly, often utilizing dynamic pricing and superior guest experiences.
- Strong performing properties (Top 25%) earn $3,021 or more, indicating effective management and desirable locations/amenities.
- Typical properties (Median) generate around $1,604 per month, representing the average market performance.
- Entry-level properties (Bottom 25%) see earnings around $793, often with potential for optimization.
Average Monthly Airbnb Earnings Trend in Priory
Priory Airbnb Occupancy Rate Trends (2025)
Maximize your bookings by understanding the Priory STR occupancy trends. Seasonal demand shifts significantly influence how often properties are booked. Typically, Julysees the highest demand (peak season occupancy), while November experiences the lowest (low season). Effective strategies, like adjusting minimum stays or offering promotions, can boost occupancy during slower periods. Here's how different property tiers perform in Priory:
- Best-in-class properties (Top 10%) achieve 73%+ occupancy, indicating high desirability and potentially optimized availability.
- Strong performing properties (Top 25%) maintain 50% or higher occupancy, suggesting good market fit and guest satisfaction.
- Typical properties (Median) have an occupancy rate around 27%.
- Entry-level properties (Bottom 25%) average 14% occupancy, potentially facing higher vacancy.
Average Monthly Occupancy Rate Trend in Priory
Average Daily Rate (ADR) Airbnb Trends in Priory (2025)
Effective short term rental pricing strategy in Priory involves understanding monthly ADR fluctuations. The Average Daily Rate (ADR) for Airbnb in Priory typically peaks in December and dips lowest during March. Leveraging Airbnb dynamic pricing tools or strategies based on this seasonality can significantly boost revenue. Here's a look at the typical nightly rates achieved:
- Best-in-class properties (Top 10%) command rates of $276+ per night, often due to premium features or locations.
- Strong performing properties (Top 25%) achieve nightly rates of $207 or more.
- Typical properties (Median) charge around $166 per night.
- Entry-level properties (Bottom 25%) earn around $134 per night.
Average Daily Rate (ADR) Trend by Month in Priory
Get Live Priory Market Intelligence 👇

Explore Real-time Analytics
Airbnb Seasonality Analysis & Trends in Priory (2025)
Peak Season (July, May, June)
- Revenue averages $2,653 per month
- Occupancy rates average 35.9%
- Daily rates average $180
Shoulder Season
- Revenue averages $2,074 per month
- Occupancy maintains around 35.6%
- Daily rates hold near $183
Low Season (March, October, November)
- Revenue drops to average $1,480 per month
- Occupancy decreases to average 30.2%
- Daily rates adjust to average $182
Seasonality Insights for Priory
- The Airbnb seasonality in Priory shows moderate seasonality with distinct peak and low periods. While the sections above show seasonal averages, it's also insightful to look at the extremes:
- During the high season, the absolute peak month showcases Priory's highest earning potential, with monthly revenues capable of climbing to $2,744, occupancy reaching a high of 46.4%, and ADRs peaking at $190.
- Conversely, the slowest single month of the year, typically falling within the low season, marks the market's lowest point. In this month, revenue might dip to $1,387, occupancy could drop to 29.0%, and ADRs may adjust down to $179.
- Understanding both the seasonal averages and these monthly peaks and troughs in revenue, occupancy, and ADR is crucial for maximizing your Airbnb profit potential in Priory.
Seasonal Strategies for Maximizing Profit
- Peak Season: Maximize revenue through premium pricing and potentially longer minimum stays. Ensure high availability.
- Low Season: Offer competitive pricing, special promotions (e.g., extended stay discounts), and flexible cancellation policies. Target off-season travelers like remote workers or budget-conscious guests.
- Shoulder Seasons: Implement dynamic pricing that balances peak and low rates. Target weekend travelers or specific events. Offer slightly more flexible terms than peak season.
- Regularly analyze your own performance against these Priory seasonality benchmarks and adjust your pricing and availability strategy accordingly.
Best Areas for Airbnb Investment in Priory (2025)
Exploring the top neighborhoods for short-term rentals in Priory? This section highlights key areas, outlining why they are attractive for hosts and guests, along with notable local attractions. Consider these locations based on your target guest profile and investment strategy.
| Neighborhood / Area | Why Host Here? (Target Guests & Appeal) | Key Attractions & Landmarks |
|---|---|---|
| Ocho Rios | A popular tourist destination known for its beautiful beaches and vibrant culture. Ocho Rios attracts visitors for its natural attractions such as waterfalls and snorkeling sites. | Dunn's River Falls, Mystic Mountain, Ocho Rios Bay Beach, Fern Gully, Island Gully Falls, Reggae Beach |
| Runaway Bay | A serene beach town ideal for relaxation and beach activities. Known for its less crowded beaches and a peaceful atmosphere, perfect for families and couples. | Runaway Bay Beach, Bamboo Beach Club, Green Grotto Caves, Flavours Beach, Breezes Runaway Bay Resort, Coral Reef |
| Discovery Bay | A tranquil location with a rich historical background. Great for vacationers who enjoy water sports, beaches, and local culture. | Discovery Bay Beach, James Bond Beach, Puerta del Sol Beach, Gold Rock Beach, Green Grotto Caves, Coral Reef |
| Saint Ann's Bay | A fantastic location with historical significance and access to various attractions. It provides a perfect balance of local culture and tourist activities. | Saint Ann's Bay Beach, Bob Marley Museum, Fort Haldane, Green Grotto Caves, Turtle River Falls and Gardens, Little Dunn's River |
| Bamboo Beach | Famous for its picturesque views and relaxing environment. Ideal for water sports enthusiasts and those looking to unwind by the beach. | Bamboo Beach Club, Bamboo River Rafting, Fish Cove, James Bond Beach, Chukka Caribbean Adventures, Reggae Beach |
| Trelawny | A more rural retreat with beautiful landscapes and historical sites. Attracts those interested in exploring nature and local heritage. | Luminous Lagoon, Falmouth Historic District, Silver Sands Beach, Burwood Beach, Glistening Waters, Queen's Park |
| Falmouth | Rich with Jamaican history and culture, Falmouth offers visitors a vibrant local lifestyle along with access to amazing beaches. | Falmouth Harbour, Water Square, Pearns Point Beach, Martha Brae River, Glistening Waters, Luminous Lagoon |
| Mamme Bay | A quieter area with luxurious villa rentals and access to pristine beaches, attracting travelers looking for a more luxurious getaway. | Mamme Bay Beach, Irie Blue Hole, Puerto Seco Beach, Chukka Caribbean Adventures, Mariners Galleon, Dolphin Cove Ocho Rios |
Understanding Airbnb License Requirements & STR Laws in Priory (2025)
While Priory, Saint Ann, Jamaica currently shows low STR regulations, specific Airbnb license requirements might still exist or change. Always verify the latest short term rental regulations and Airbnb license requirements directly with local government authorities for Priory to ensure full compliance before hosting.
(Source: AirROI data, 2025, finding no licensed listings among those analyzed)
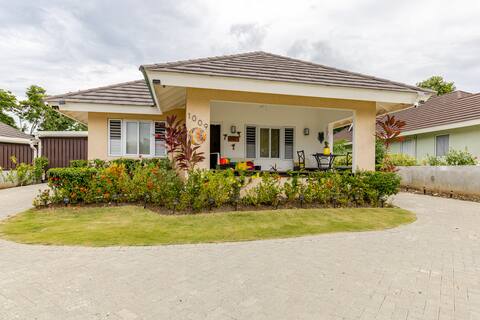
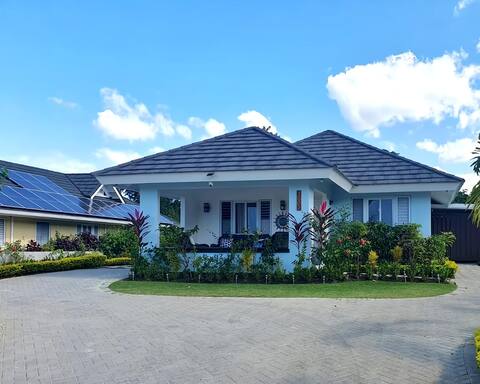
Top Performing Airbnb Properties in Priory (2025)
Benchmark your potential! Explore examples of top-performing Airbnb properties in Priorybased on Trailing Twelve Month (TTM) revenue. Analyze their characteristics, revenue, occupancy rate, and ADR to understand what drives success in this market.

Family friendly villa near Ocho Rios; attractions
Entire Place • 3 bedrooms

Deluxe Richmond Retreat w/ Spectacular Amenities
Entire Place • 3 bedrooms
3 LittleBirds @ Richmond (3Bdr + Loft)
Entire Place • 4 bedrooms
Blue Haven @ Richmond (3 Bdr + Loft Villa)
Entire Place • 4 bedrooms
Home Away @ The Gated Richmond -Entire home
Entire Place • 3 bedrooms
OchoRios, Beach/Pool,AC,Gated/24hrSecurity, Sleep6
Entire Place • 3 bedrooms
Note: Performance varies based on location, size, amenities, seasonality, and management quality. Data reflects the past 12 months.
Top Performing Airbnb Hosts in Priory (2025)
Learn from the best! This table showcases top-performing Airbnb hosts in Priory based on the number of properties managed and estimated total revenue over the past year. Analyze their scale and performance metrics.
| Host Name | Properties | Grossing Revenue | Stay Reviews | Avg Rating |
|---|---|---|---|---|
| Philip | 1 | $60,691 | 7 | 5.00/5.0 |
| Sherie & I Heart Travel Jamaic | 2 | $60,568 | 146 | 4.92/5.0 |
| Bryan | 2 | $55,883 | 69 | 4.96/5.0 |
| Nordia | 1 | $54,352 | 92 | 4.85/5.0 |
| Patrick | 1 | $51,564 | 17 | 4.88/5.0 |
| Colin | 1 | $50,636 | 33 | 4.97/5.0 |
| Semoura | 1 | $50,369 | 23 | 4.87/5.0 |
| Lauri-Ann | 2 | $48,789 | 48 | 2.46/5.0 |
| Sandra | 1 | $48,310 | 93 | 4.90/5.0 |
| Oshane | 1 | $45,215 | 114 | 4.74/5.0 |
Analyzing the strategies of top hosts, such as their property selection, pricing, and guest communication, can offer valuable lessons for optimizing your own Airbnb operations in Priory.
Dive Deeper: Advanced Priory STR Market Data (2025)
Ready to unlock more insights? AirROI provides access to advanced metrics and comprehensive Airbnb data for Priory. Explore detailed analytics beyond this report to refine your investment strategy, optimize pricing, and maximize your vacation rental profits.
Explore Advanced MetricsPriory Short-Term Rental Market Composition (2025): Property & Room Types
Room Type Distribution
Property Type Distribution
Market Composition Insights for Priory
- The Priory Airbnb market composition is heavily skewed towards Entire Home/Apt listings, which make up 96.2% of the 132 active rentals. This indicates strong guest preference for privacy and space.
- Looking at the property type distribution in Priory, House properties are the most common (90.2%), reflecting the local real estate landscape.
- Houses represent a significant 90.2% portion, catering likely to families or larger groups.
- Smaller segments like others (combined 0.8%) offer potential for unique stay experiences.
Priory Airbnb Room Capacity Analysis (2025): Bedroom Distribution
Distribution of Listings by Number of Bedrooms
Room Capacity Insights for Priory
- The dominant room capacity in Priory is 3 bedrooms listings, making up 65.2% of the market. This suggests a strong demand for properties suitable for families or small groups.
- Together, 3 bedrooms and 2 bedrooms properties represent 83.4% of the active Airbnb listings in Priory, indicating a high concentration in these sizes.
- A significant 71.2% of listings offer 3+ bedrooms, catering to larger groups and families seeking more space in Priory.
Priory Vacation Rental Guest Capacity Trends (2025)
Distribution of Listings by Guest Capacity
Guest Capacity Insights for Priory
- The most common guest capacity trend in Priory vacation rentals is listings accommodating 6 guests (52.3%). This suggests the primary traveler segment is likely larger groups.
- Properties designed for 6 guests and 8+ guests dominate the Priory STR market, accounting for 67.5% of listings.
- 70.5% of properties accommodate 6+ guests, serving the market segment for larger families or group travel in Priory.
- On average, properties in Priory are equipped to host 5.5 guests.
Priory Airbnb Booking Patterns (2025): Available vs. Booked Days
Available Days Distribution
Booked Days Distribution
Booking Pattern Insights for Priory
- The most common availability pattern in Priory falls within the 271-366 days range, representing 61.4% of listings. This suggests many properties have significant open periods on their calendars.
- Approximately 84.1% of listings show high availability (181+ days open annually), indicating potential for increased bookings or specific owner usage patterns.
- For booked days, the 1-30 days range is most frequent in Priory (34.1%), reflecting common guest stay durations or potential owner blocking patterns.
- A notable 15.9% of properties secure long booking periods (181+ days booked per year), highlighting successful long-term rental strategies or significant owner usage.
Priory Airbnb Minimum Stay Requirements Analysis
Distribution of Listings by Minimum Night Requirement
1 Night
19 listings
15.2% of total
2 Nights
43 listings
34.4% of total
3 Nights
37 listings
29.6% of total
4-6 Nights
10 listings
8% of total
30+ Nights
16 listings
12.8% of total
Key Insights
- The most prevalent minimum stay requirement in Priory is 2 Nights, adopted by 34.4% of listings. This highlights the market's preference for shorter, flexible bookings.
- A significant segment (12.8%) caters to monthly stays (30+ nights) in Priory, pointing to opportunities in the extended-stay market.
Recommendations
- Align with the market by considering a 2 Nights minimum stay, as 34.4% of Priory hosts use this setting.
- If feasible, allowing 1-night stays, especially midweek or during low season, could capture last-minute bookings, as only 15.2% currently do.
- A 2-night minimum appears standard (34.4%). Consider this for weekends or peak periods.
- Explore offering discounts for stays of 30+ nights to attract the 12.8% of the market seeking extended stays.
- Adjust minimum nights based on seasonality – potentially shorter during low season and longer during peak demand periods in Priory.
Priory Airbnb Cancellation Policy Trends Analysis (2025)
Flexible
32 listings
28.3% of total
Moderate
39 listings
34.5% of total
Firm
15 listings
13.3% of total
Strict
27 listings
23.9% of total
Cancellation Policy Insights for Priory
- The prevailing Airbnb cancellation policy trend in Priory is Moderate, used by 34.5% of listings.
- There's a relatively balanced mix between guest-friendly (62.8%) and stricter (37.2%) policies, offering choices for different guest needs.
Recommendations for Hosts
- Consider adopting a Moderate policy to align with the 34.5% market standard in Priory.
- Regularly review your cancellation policy against competitors and market demand shifts in Priory.
Priory STR Booking Lead Time Analysis (2025)
Average Booking Lead Time by Month
Booking Lead Time Insights for Priory
- The overall average booking lead time for vacation rentals in Priory is 43 days.
- Guests book furthest in advance for stays during December (average 61 days), likely coinciding with peak travel demand or local events.
- The shortest booking windows occur for stays in March (average 22 days), indicating more last-minute travel plans during this time.
- Seasonally, Summer (54 days avg.) sees the longest lead times, while Spring (39 days avg.) has the shortest, reflecting typical travel planning cycles.
Recommendations for Hosts
- Use the overall average lead time (43 days) as a baseline for your pricing and availability strategy in Priory.
- For December stays, consider implementing length-of-stay discounts or slightly higher rates for bookings made less than 61 days out to capitalize on advance planning.
- Target marketing efforts for the Summer season well in advance (at least 54 days) to capture early planners.
- Monitor your own booking lead times against these Priory averages to identify opportunities for dynamic pricing adjustments.
Popular & Essential Airbnb Amenities in Priory (2025)
Amenity Prevalence
Amenity Insights for Priory
- Essential amenities in Priory that guests expect include: Air conditioning, Wifi, TV, Kitchen, Free parking on premises, Iron. Lacking these (any) could significantly impact bookings.
- Popular amenities like Hot water, Washer, Essentials are common but not universal. Offering these can provide a competitive edge.
Recommendations for Hosts
- Ensure your listing includes all essential amenities for Priory: Air conditioning, Wifi, TV, Kitchen, Free parking on premises, Iron.
- Prioritize adding missing essentials: Wifi, TV, Kitchen, Free parking on premises, Iron.
- Consider adding popular differentiators like Hot water or Washer to increase appeal.
- Highlight unique or less common amenities you offer (e.g., hot tub, dedicated workspace, EV charger) in your listing description and photos.
- Regularly check competitor amenities in Priory to stay competitive.
Priory Airbnb Guest Demographics & Profile Analysis (2025)
Guest Profile Summary for Priory
- The typical guest profile for Airbnb in Priory consists of predominantly international visitors (80%), with top international origins including Jamaica, typically belonging to the Post-2000s (Gen Z/Alpha) group (50%), primarily speaking English or Spanish.
- Domestic travelers account for 19.8% of guests.
- Key international markets include United States (53%) and Jamaica (19.8%).
- Top languages spoken are English (82.1%) followed by Spanish (6%).
- A significant demographic segment is the Post-2000s (Gen Z/Alpha) group, representing 50% of guests.
Recommendations for Hosts
- Focus marketing internationally, particularly towards travelers from Jamaica.
- Tailor amenities and listing descriptions to appeal to the dominant Post-2000s (Gen Z/Alpha) demographic (e.g., highlight fast WiFi, smart home features, local guides).
- Highlight unique local experiences or amenities relevant to the primary guest profile.
- Consider seasonal promotions aligned with peak travel times for key origin markets.
Nearby Short-Term Rental Market Comparison
How does the Priory Airbnb market stack up against its neighbors? Compare key performance metrics like average monthly revenue, ADR, and occupancy rates in surrounding areas to understand the broader regional STR landscape.
| Market | Active Properties | Monthly Revenue | Daily Rate | Avg. Occupancy |
|---|---|---|---|---|
| Duncans | 26 | $4,507 | $580.79 | 35% |
| Mount Zion | 27 | $3,816 | $389.46 | 36% |
| Unity Hall | 28 | $3,710 | $374.87 | 29% |
| Ocho Rios | 16 | $3,641 | $403.86 | 30% |
| Montego Bay | 200 | $3,111 | $375.32 | 38% |
| Davis Cove | 14 | $2,828 | $319.17 | 33% |
| Treasure Beach | 14 | $2,813 | $335.30 | 31% |
| Bruces Hill | 18 | $2,611 | $554.75 | 28% |
| West End | 23 | $2,581 | $285.34 | 37% |
| St. James Parish | 73 | $2,398 | $320.53 | 36% |