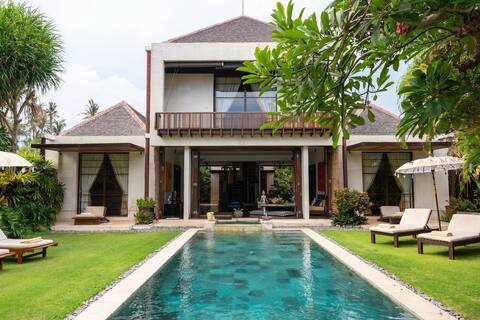
Ketewel Airbnb Market Analysis 2025: Short Term Rental Data & Vacation Rental Statistics in Bali, Indonesia
Is Airbnb profitable in Ketewel in 2025? Explore comprehensive Airbnb analytics for Ketewel, Bali, Indonesia to uncover income potential. This 2025 STR market report for Ketewel, based on AirROI data from April 2024 to March 2025, reveals key trends in the niche market of 26 active listings.
Whether you're considering an Airbnb investment in Ketewel, optimizing your existing vacation rental, or exploring rental arbitrage opportunities, understanding the Ketewel Airbnb data is crucial. Leveraging the low regulation environment is key to maximizing your short term rental income potential. Let's dive into the specifics.
Key Ketewel Airbnb Performance Metrics Overview
Monthly Airbnb Revenue Variations & Income Potential in Ketewel (2025)
Understanding the monthly revenue variations for Airbnb listings in Ketewel is key to maximizing your short term rental income potential. Seasonality significantly impacts earnings. Our analysis, based on data from the past 12 months, shows that the peak revenue month for STRs in Ketewel is typically December, while November often presents the lowest earnings, highlighting opportunities for strategic pricing adjustments during shoulder and low seasons. Explore the typical Airbnb income in Ketewel across different performance tiers:
- Best-in-class properties (Top 10%) achieve $9,226+ monthly, often utilizing dynamic pricing and superior guest experiences.
- Strong performing properties (Top 25%) earn $4,269 or more, indicating effective management and desirable locations/amenities.
- Typical properties (Median) generate around $1,533 per month, representing the average market performance.
- Entry-level properties (Bottom 25%) see earnings around $490, often with potential for optimization.
Average Monthly Airbnb Earnings Trend in Ketewel
Ketewel Airbnb Occupancy Rate Trends (2025)
Maximize your bookings by understanding the Ketewel STR occupancy trends. Seasonal demand shifts significantly influence how often properties are booked. Typically, Decembersees the highest demand (peak season occupancy), while May experiences the lowest (low season). Effective strategies, like adjusting minimum stays or offering promotions, can boost occupancy during slower periods. Here's how different property tiers perform in Ketewel:
- Best-in-class properties (Top 10%) achieve 44%+ occupancy, indicating high desirability and potentially optimized availability.
- Strong performing properties (Top 25%) maintain 28% or higher occupancy, suggesting good market fit and guest satisfaction.
- Typical properties (Median) have an occupancy rate around 17%.
- Entry-level properties (Bottom 25%) average 11% occupancy, potentially facing higher vacancy.
Average Monthly Occupancy Rate Trend in Ketewel
Average Daily Rate (ADR) Airbnb Trends in Ketewel (2025)
Effective short term rental pricing strategy in Ketewel involves understanding monthly ADR fluctuations. The Average Daily Rate (ADR) for Airbnb in Ketewel typically peaks in December and dips lowest during October. Leveraging Airbnb dynamic pricing tools or strategies based on this seasonality can significantly boost revenue. Here's a look at the typical nightly rates achieved:
- Best-in-class properties (Top 10%) command rates of $957+ per night, often due to premium features or locations.
- Strong performing properties (Top 25%) achieve nightly rates of $469 or more.
- Typical properties (Median) charge around $284 per night.
- Entry-level properties (Bottom 25%) earn around $45 per night.
Average Daily Rate (ADR) Trend by Month in Ketewel
Get Live Ketewel Market Intelligence 👇

Explore Real-time Analytics
Airbnb Seasonality Analysis & Trends in Ketewel (2025)
Peak Season (December, July, February)
- Revenue averages $4,467 per month
- Occupancy rates average 26.1%
- Daily rates average $371
Shoulder Season
- Revenue averages $2,881 per month
- Occupancy maintains around 22.0%
- Daily rates hold near $359
Low Season (March, June, November)
- Revenue drops to average $2,182 per month
- Occupancy decreases to average 19.0%
- Daily rates adjust to average $360
Seasonality Insights for Ketewel
- The Airbnb seasonality in Ketewel shows highly seasonal trends requiring careful strategy. While the sections above show seasonal averages, it's also insightful to look at the extremes:
- During the high season, the absolute peak month showcases Ketewel's highest earning potential, with monthly revenues capable of climbing to $4,661, occupancy reaching a high of 29.2%, and ADRs peaking at $385.
- Conversely, the slowest single month of the year, typically falling within the low season, marks the market's lowest point. In this month, revenue might dip to $2,053, occupancy could drop to 14.5%, and ADRs may adjust down to $346.
- Understanding both the seasonal averages and these monthly peaks and troughs in revenue, occupancy, and ADR is crucial for maximizing your Airbnb profit potential in Ketewel.
Seasonal Strategies for Maximizing Profit
- Peak Season: Maximize revenue through premium pricing and potentially longer minimum stays. Ensure high availability.
- Low Season: Offer competitive pricing, special promotions (e.g., extended stay discounts), and flexible cancellation policies. Target off-season travelers like remote workers or budget-conscious guests.
- Shoulder Seasons: Implement dynamic pricing that balances peak and low rates. Target weekend travelers or specific events. Offer slightly more flexible terms than peak season.
- Regularly analyze your own performance against these Ketewel seasonality benchmarks and adjust your pricing and availability strategy accordingly.
Best Areas for Airbnb Investment in Ketewel (2025)
Exploring the top neighborhoods for short-term rentals in Ketewel? This section highlights key areas, outlining why they are attractive for hosts and guests, along with notable local attractions. Consider these locations based on your target guest profile and investment strategy.
| Neighborhood / Area | Why Host Here? (Target Guests & Appeal) | Key Attractions & Landmarks |
|---|---|---|
| Ketewel Beach | A serene beach location known for its beautiful black sand and stunning sunrise views. It attracts both local visitors and tourists seeking tranquility and a more authentic Balinese experience. | Ketewel Beach, Bali Swede Farm, Beaches of Bali, Local Warungs, Sunset Dining on Beach |
| Sukawati | Famous for its art market and traditional Balinese crafts. This area is popular among tourists looking to buy local artifacts and art, making it a prime spot for cultural tourists. | Sukawati Art Market, Gifts from Bali, Balinese Culture, Bali Zoo, Ubud Traditional Market |
| Mas Village | An area known for its wood carving and other artisan crafts, Mas Village attracts those interested in Balinese art and culture, making it a great spot for cultural stays. | Devdan Show, Bali Bird Park |
| Ubud | The cultural heart of Bali, Ubud attracts tourists interested in yoga, wellness, and traditional Balinese culture. It's surrounded by rice fields and provides a serene atmosphere. | Ubud Monkey Forest, Tegallalang Rice Terrace, Ubud Art Market, Campuhan Ridge Walk, Puri Saren Royal Palace |
| Sidemen | A tranquil village surrounded by rice paddies and mountains, popular for hiking, trekking, and experiencing village life. Offers a more secluded option for travelers. | Sidemen Rice Fields, Local Waterfalls, Trekking Tours, Traditional Weaving Classes |
| Keramas | Known for its beach breaks and surf culture, Keramas attracts a younger crowd and surfers looking for a less commercialized beach experience. | Keramas Beach, Surfing Spots, Beach Clubs, Sunset Views |
| Candi Dasa | A coastal town known for its beautiful beaches and proximity to dive sites. It appeals to tourists looking to relax and explore the underwater beauty of Bali. | Candi Dasa Beach, Scuba Diving, Snorkeling Tours, Local Seafood Restaurants |
| Sanur | A laid-back beach area popular with families and retirees. Sanur has calm waters and beautiful sunrises, making it a great spot for a relaxing vacation. | Sanur Beach Promenade, Pasar Sindu Night Market, Museum Le Mayeur, Biking along the Coast |
Understanding Airbnb License Requirements & STR Laws in Ketewel (2025)
While Ketewel, Bali, Indonesia currently shows low STR regulations, specific Airbnb license requirements might still exist or change. Always verify the latest short term rental regulations and Airbnb license requirements directly with local government authorities for Ketewel to ensure full compliance before hosting.
(Source: AirROI data, 2025, finding no licensed listings among those analyzed)
Top Performing Airbnb Properties in Ketewel (2025)
Benchmark your potential! Explore examples of top-performing Airbnb properties in Ketewelbased on Trailing Twelve Month (TTM) revenue. Analyze their characteristics, revenue, occupancy rate, and ADR to understand what drives success in this market.

Peaceful Retreats at a Stunning Beachfront
Entire Place • 4 bedrooms

Exclusive & Stylish Ocean View Villa with Private Chef
Entire Place • 6 bedrooms

Beautiful Waterfront Private Villas
Entire Place • 7 bedrooms

Unforgettable Retreat. Beautiful Private Villas!
Entire Place • 7 bedrooms
3 Bedroom Villa, Ketewel
Entire Place • 3 bedrooms

Villa Samudra Luxury Beachfront
Entire Place • 3 bedrooms
Note: Performance varies based on location, size, amenities, seasonality, and management quality. Data reflects the past 12 months.
Top Performing Airbnb Hosts in Ketewel (2025)
Learn from the best! This table showcases top-performing Airbnb hosts in Ketewel based on the number of properties managed and estimated total revenue over the past year. Analyze their scale and performance metrics.
| Host Name | Properties | Grossing Revenue | Stay Reviews | Avg Rating |
|---|---|---|---|---|
| Firman | 1 | $115,519 | 55 | 4.98/5.0 |
| Host #305260588 | 4 | $106,859 | 2 | 0.00/5.0 |
| René | 1 | $80,003 | 9 | 4.89/5.0 |
| Host #78999757 | 2 | $60,060 | 1 | 0.00/5.0 |
| Host #1455923 | 1 | $42,617 | 0 | 0.00/5.0 |
| Endang | 1 | $36,655 | 12 | 4.83/5.0 |
| Host #28368233 | 1 | $30,833 | 0 | 0.00/5.0 |
| Host #96396582 | 1 | $19,939 | 0 | 0.00/5.0 |
| Host #115578456 | 1 | $18,457 | 0 | 0.00/5.0 |
| Host #485995634 | 1 | $10,902 | 0 | 0.00/5.0 |
Analyzing the strategies of top hosts, such as their property selection, pricing, and guest communication, can offer valuable lessons for optimizing your own Airbnb operations in Ketewel.
Dive Deeper: Advanced Ketewel STR Market Data (2025)
Ready to unlock more insights? AirROI provides access to advanced metrics and comprehensive Airbnb data for Ketewel. Explore detailed analytics beyond this report to refine your investment strategy, optimize pricing, and maximize your vacation rental profits.
Explore Advanced MetricsKetewel Short-Term Rental Market Composition (2025): Property & Room Types
Room Type Distribution
Property Type Distribution
Market Composition Insights for Ketewel
- The Ketewel Airbnb market composition is heavily skewed towards Entire Home/Apt listings, which make up 84.6% of the 26 active rentals. This indicates strong guest preference for privacy and space.
- Looking at the property type distribution in Ketewel, House properties are the most common (84.6%), reflecting the local real estate landscape.
- Houses represent a significant 84.6% portion, catering likely to families or larger groups.
- The presence of 11.5% Hotel/Boutique listings indicates integration with traditional hospitality.
- Smaller segments like apartment/condo (combined 3.8%) offer potential for unique stay experiences.
Ketewel Airbnb Room Capacity Analysis (2025): Bedroom Distribution
Distribution of Listings by Number of Bedrooms
Room Capacity Insights for Ketewel
- The dominant room capacity in Ketewel is 3 bedrooms listings, making up 46.2% of the market. This suggests a strong demand for properties suitable for families or small groups.
- Together, 3 bedrooms and 1 bedroom properties represent 65.4% of the active Airbnb listings in Ketewel, indicating a high concentration in these sizes.
- A significant 76.9% of listings offer 3+ bedrooms, catering to larger groups and families seeking more space in Ketewel.
Ketewel Vacation Rental Guest Capacity Trends (2025)
Distribution of Listings by Guest Capacity
Guest Capacity Insights for Ketewel
- The most common guest capacity trend in Ketewel vacation rentals is listings accommodating 6 guests (34.6%). This suggests the primary traveler segment is likely larger groups.
- Properties designed for 6 guests and 8+ guests dominate the Ketewel STR market, accounting for 65.4% of listings.
- 65.4% of properties accommodate 6+ guests, serving the market segment for larger families or group travel in Ketewel.
- On average, properties in Ketewel are equipped to host 5.3 guests.
Ketewel Airbnb Booking Patterns (2025): Available vs. Booked Days
Available Days Distribution
Booked Days Distribution
Booking Pattern Insights for Ketewel
- The most common availability pattern in Ketewel falls within the 271-366 days range, representing 88.5% of listings. This suggests many properties have significant open periods on their calendars.
- Approximately 100.0% of listings show high availability (181+ days open annually), indicating potential for increased bookings or specific owner usage patterns.
- For booked days, the 31-90 days range is most frequent in Ketewel (42.3%), reflecting common guest stay durations or potential owner blocking patterns.
Ketewel Airbnb Minimum Stay Requirements Analysis
Distribution of Listings by Minimum Night Requirement
1 Night
14 listings
60.9% of total
2 Nights
4 listings
17.4% of total
3 Nights
1 listings
4.3% of total
4-6 Nights
1 listings
4.3% of total
30+ Nights
3 listings
13% of total
Key Insights
- The most prevalent minimum stay requirement in Ketewel is 1 Night, adopted by 60.9% of listings. This highlights the market's preference for shorter, flexible bookings.
- A strong majority (78.3%) of the Ketewel Airbnb data shows acceptance of very short stays (1-2 nights), indicating a dynamic, high-turnover market.
- A significant segment (13%) caters to monthly stays (30+ nights) in Ketewel, pointing to opportunities in the extended-stay market.
Recommendations
- Align with the market by considering a 1 Night minimum stay, as 60.9% of Ketewel hosts use this setting.
- Explore offering discounts for stays of 30+ nights to attract the 13% of the market seeking extended stays.
- Adjust minimum nights based on seasonality – potentially shorter during low season and longer during peak demand periods in Ketewel.
Ketewel Airbnb Cancellation Policy Trends Analysis (2025)
Flexible
3 listings
37.5% of total
Moderate
1 listings
12.5% of total
Firm
1 listings
12.5% of total
Strict
3 listings
37.5% of total
Cancellation Policy Insights for Ketewel
- The prevailing Airbnb cancellation policy trend in Ketewel is Flexible, used by 37.5% of listings.
- There's a relatively balanced mix between guest-friendly (50.0%) and stricter (50.0%) policies, offering choices for different guest needs.
Recommendations for Hosts
- Consider adopting a Flexible policy to align with the 37.5% market standard in Ketewel.
- With 37.5% using Strict terms, this is a viable option in Ketewel, particularly for high-value properties or during peak demand periods.
- Regularly review your cancellation policy against competitors and market demand shifts in Ketewel.
Ketewel STR Booking Lead Time Analysis (2025)
Average Booking Lead Time by Month
Booking Lead Time Insights for Ketewel
- The overall average booking lead time for vacation rentals in Ketewel is 45 days.
- Guests book furthest in advance for stays during June (average 168 days), likely coinciding with peak travel demand or local events.
- The shortest booking windows occur for stays in February (average 23 days), indicating more last-minute travel plans during this time.
- Seasonally, Summer (125 days avg.) sees the longest lead times, while Winter (38 days avg.) has the shortest, reflecting typical travel planning cycles.
Recommendations for Hosts
- Use the overall average lead time (45 days) as a baseline for your pricing and availability strategy in Ketewel.
- For June stays, consider implementing length-of-stay discounts or slightly higher rates for bookings made less than 168 days out to capitalize on advance planning.
- Target marketing efforts for the Summer season well in advance (at least 125 days) to capture early planners.
- Monitor your own booking lead times against these Ketewel averages to identify opportunities for dynamic pricing adjustments.
Popular & Essential Airbnb Amenities in Ketewel (2025)
Amenity Prevalence
Amenity Insights for Ketewel
- Essential amenities in Ketewel that guests expect include: Free parking on premises, Wifi, Essentials, Air conditioning, TV, Kitchen. Lacking these (any) could significantly impact bookings.
- Popular amenities like Smoke alarm, Carbon monoxide alarm, Dryer are common but not universal. Offering these can provide a competitive edge.
Recommendations for Hosts
- Ensure your listing includes all essential amenities for Ketewel: Free parking on premises, Wifi, Essentials, Air conditioning, TV, Kitchen.
- Prioritize adding missing essentials: TV, Kitchen.
- Consider adding popular differentiators like Smoke alarm or Carbon monoxide alarm to increase appeal.
- Highlight unique or less common amenities you offer (e.g., hot tub, dedicated workspace, EV charger) in your listing description and photos.
- Regularly check competitor amenities in Ketewel to stay competitive.
Ketewel Airbnb Guest Demographics & Profile Analysis (2025)
Guest Profile Summary for Ketewel
- The typical guest profile for Airbnb in Ketewel consists of predominantly international visitors (91%), with top international origins including Netherlands, typically belonging to the Post-2000s (Gen Z/Alpha) group (50%), primarily speaking English or German.
- Domestic travelers account for 9.1% of guests.
- Key international markets include United States (13.6%) and Netherlands (13.6%).
- Top languages spoken are English (47.4%) followed by German (10.5%).
- A significant demographic segment is the Post-2000s (Gen Z/Alpha) group, representing 50% of guests.
Recommendations for Hosts
- Focus marketing internationally, particularly towards travelers from Netherlands.
- Tailor amenities and listing descriptions to appeal to the dominant Post-2000s (Gen Z/Alpha) demographic (e.g., highlight fast WiFi, smart home features, local guides).
- Highlight unique local experiences or amenities relevant to the primary guest profile.
- Consider seasonal promotions aligned with peak travel times for key origin markets.
Nearby Short-Term Rental Market Comparison
How does the Ketewel Airbnb market stack up against its neighbors? Compare key performance metrics like average monthly revenue, ADR, and occupancy rates in surrounding areas to understand the broader regional STR landscape.
| Market | Active Properties | Monthly Revenue | Daily Rate | Avg. Occupancy |
|---|---|---|---|---|
| Padangaji | 14 | $7,854 | $326.79 | 74% |
| BATAS DESA BATU JANGKIH | 14 | $4,638 | $485.04 | 37% |
| Bedulu | 35 | $3,506 | $252.39 | 49% |
| Pejeng Kawan | 120 | $3,303 | $213.75 | 46% |
| Pecatu | 1,532 | $3,185 | $253.79 | 50% |
| Sanding | 12 | $3,133 | $252.45 | 37% |
| Duda | 25 | $3,103 | $216.55 | 46% |
| Seminyak | 2,155 | $2,895 | $289.07 | 44% |
| Pujut | 10 | $2,772 | $153.49 | 49% |
| Dencarik | 52 | $2,660 | $193.40 | 48% |