Budakeling Airbnb Market Analysis 2025: Short Term Rental Data & Vacation Rental Statistics in Bali, Indonesia
Is Airbnb profitable in Budakeling in 2025? Explore comprehensive Airbnb analytics for Budakeling, Bali, Indonesia to uncover income potential. This 2025 STR market report for Budakeling, based on AirROI data from April 2024 to March 2025, reveals key trends in the niche market of 46 active listings.
Whether you're considering an Airbnb investment in Budakeling, optimizing your existing vacation rental, or exploring rental arbitrage opportunities, understanding the Budakeling Airbnb data is crucial. Leveraging the low regulation environment is key to maximizing your short term rental income potential. Let's dive into the specifics.
Key Budakeling Airbnb Performance Metrics Overview
Monthly Airbnb Revenue Variations & Income Potential in Budakeling (2025)
Understanding the monthly revenue variations for Airbnb listings in Budakeling is key to maximizing your short term rental income potential. Seasonality significantly impacts earnings. Our analysis, based on data from the past 12 months, shows that the peak revenue month for STRs in Budakeling is typically April, while July often presents the lowest earnings, highlighting opportunities for strategic pricing adjustments during shoulder and low seasons. Explore the typical Airbnb income in Budakeling across different performance tiers:
- Best-in-class properties (Top 10%) achieve $473+ monthly, often utilizing dynamic pricing and superior guest experiences.
- Strong performing properties (Top 25%) earn $391 or more, indicating effective management and desirable locations/amenities.
- Typical properties (Median) generate around $332 per month, representing the average market performance.
- Entry-level properties (Bottom 25%) see earnings around $312, often with potential for optimization.
Average Monthly Airbnb Earnings Trend in Budakeling
Budakeling Airbnb Occupancy Rate Trends (2025)
Maximize your bookings by understanding the Budakeling STR occupancy trends. Seasonal demand shifts significantly influence how often properties are booked. Typically, Maysees the highest demand (peak season occupancy), while July experiences the lowest (low season). Effective strategies, like adjusting minimum stays or offering promotions, can boost occupancy during slower periods. Here's how different property tiers perform in Budakeling:
- Best-in-class properties (Top 10%) achieve 20%+ occupancy, indicating high desirability and potentially optimized availability.
- Strong performing properties (Top 25%) maintain 19% or higher occupancy, suggesting good market fit and guest satisfaction.
- Typical properties (Median) have an occupancy rate around 19%.
- Entry-level properties (Bottom 25%) average 15% occupancy, potentially facing higher vacancy.
Average Monthly Occupancy Rate Trend in Budakeling
Average Daily Rate (ADR) Airbnb Trends in Budakeling (2025)
Effective short term rental pricing strategy in Budakeling involves understanding monthly ADR fluctuations. The Average Daily Rate (ADR) for Airbnb in Budakeling typically peaks in November and dips lowest during August. Leveraging Airbnb dynamic pricing tools or strategies based on this seasonality can significantly boost revenue. Here's a look at the typical nightly rates achieved:
- Best-in-class properties (Top 10%) command rates of $100+ per night, often due to premium features or locations.
- Strong performing properties (Top 25%) achieve nightly rates of $71 or more.
- Typical properties (Median) charge around $28 per night.
- Entry-level properties (Bottom 25%) earn around $23 per night.
Average Daily Rate (ADR) Trend by Month in Budakeling
Get Live Budakeling Market Intelligence 👇

Explore Real-time Analytics
Airbnb Seasonality Analysis & Trends in Budakeling (2025)
Peak Season (April, May, September)
- Revenue averages $933 per month
- Occupancy rates average 33.6%
- Daily rates average $48
Shoulder Season
- Revenue averages $130 per month
- Occupancy maintains around 9.6%
- Daily rates hold near $49
Low Season (February, June, July)
- Revenue drops to average $15 per month
- Occupancy decreases to average 1.1%
- Daily rates adjust to average $49
Seasonality Insights for Budakeling
- The Airbnb seasonality in Budakeling shows highly seasonal trends requiring careful strategy. While the sections above show seasonal averages, it's also insightful to look at the extremes:
- During the high season, the absolute peak month showcases Budakeling's highest earning potential, with monthly revenues capable of climbing to $1,370, occupancy reaching a high of 80.6%, and ADRs peaking at $52.
- Conversely, the slowest single month of the year, typically falling within the low season, marks the market's lowest point. In this month, revenue might dip to $0, occupancy could drop to 0.0%, and ADRs may adjust down to $47.
- Understanding both the seasonal averages and these monthly peaks and troughs in revenue, occupancy, and ADR is crucial for maximizing your Airbnb profit potential in Budakeling.
Seasonal Strategies for Maximizing Profit
- Peak Season: Maximize revenue through premium pricing and potentially longer minimum stays. Ensure high availability.
- Low Season: Offer competitive pricing, special promotions (e.g., extended stay discounts), and flexible cancellation policies. Target off-season travelers like remote workers or budget-conscious guests.
- Shoulder Seasons: Implement dynamic pricing that balances peak and low rates. Target weekend travelers or specific events. Offer slightly more flexible terms than peak season.
- Regularly analyze your own performance against these Budakeling seasonality benchmarks and adjust your pricing and availability strategy accordingly.
Best Areas for Airbnb Investment in Budakeling (2025)
Exploring the top neighborhoods for short-term rentals in Budakeling? This section highlights key areas, outlining why they are attractive for hosts and guests, along with notable local attractions. Consider these locations based on your target guest profile and investment strategy.
| Neighborhood / Area | Why Host Here? (Target Guests & Appeal) | Key Attractions & Landmarks |
|---|---|---|
| Amlapura | Cultural heart of East Bali, offering a blend of history, natural beauty, and proximity to the famous Tirtagangga Water Palace. Amlapura attracts travelers looking for authentic Balinese experiences. | Tirtagangga Water Palace, Soekasada Water Garden, Amlapura Market, Lempuyang Temple, Bali Chocolate Factory |
| Candidasa | A tranquil coastal village known for its scenic beaches and diving spots. Popular among travelers seeking relaxation, water activities, and beautiful views. | Candidasa Beach, White Sand Beach, Tukad Cepung Waterfall, Snorkeling at Blue Lagoon, Pura Candidasa |
| Tirta Gangga | Famous for its beautiful water palace, Tirta Gangga is a sought-after location for visitors looking for picturesque landscapes and serene surroundings. | Tirta Gangga Water Palace, Karma Beach, Goa Lawah Temple, Rice Terraces of Ababi, Ujung Water Palace |
| Amed | Amed is renowned for its stunning coral reefs and laid-back atmosphere, perfect for snorkeling, diving, and enjoying a quieter side of Bali. | Amed Beach, Japanese Shipwreck Dive, Pura Lempuyang Luhur, Scuba diving and snorkeling spots, Sunset views |
| Sanur | A lovely beach town that offers a more relaxed vibe compared to busier tourist areas. Sanur is known for its family-friendly beaches and charming local markets. | Sanur Beach, Le Mayeur Museum, Mola Mola Dive Sites, Bali Seawalker, Night markets |
| Ubud | Famous for its arts and culture, Ubud attracts those looking for wellness retreats, yoga, and scenic rice paddies, as well as traditional Balinese arts and crafts. | Ubud Monkey Forest, Tegallalang Rice Terraces, Ubud Art Market, Campuhan Ridge Walk, Puri Saren Agung |
| Ngurah Rai International Airport | Essential for all travelers to Bali, hosting visitors from around the world. Properties here can cater to transit travelers and those seeking convenience. | Departure and arrival halls, Local dining options, Nearby beach resorts, Proximity to Kuta and Seminyak, Car rentals and services |
| Klungkung | Known for its rich historical sites and access to Nusa Penida, Klungkung attracts visitors seeking off-the-beaten-path experiences and beautiful coastal views. | Klungkung Palace, Taman Nusa, Nusa Penida Island, Goa Lawah Temple, Museum Semarajaya |
Understanding Airbnb License Requirements & STR Laws in Budakeling (2025)
While Budakeling, Bali, Indonesia currently shows low STR regulations, specific Airbnb license requirements might still exist or change. Always verify the latest short term rental regulations and Airbnb license requirements directly with local government authorities for Budakeling to ensure full compliance before hosting.
(Source: AirROI data, 2025, finding no licensed listings among those analyzed)
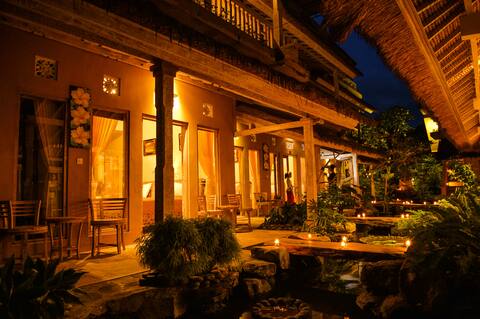
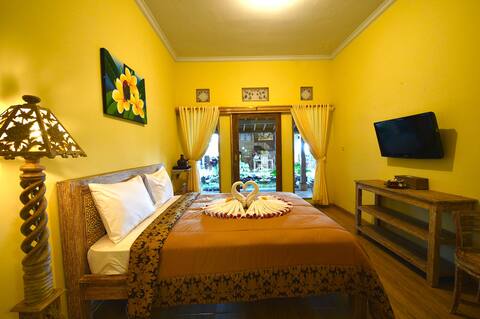
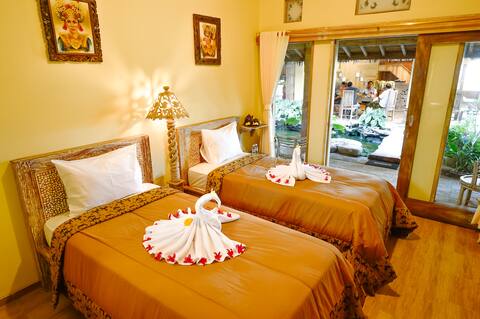
Top Performing Airbnb Properties in Budakeling (2025)
Benchmark your potential! Explore examples of top-performing Airbnb properties in Budakelingbased on Trailing Twelve Month (TTM) revenue. Analyze their characteristics, revenue, occupancy rate, and ADR to understand what drives success in this market.

Fantastic View! 2BR Double Room in Karangasem
Private Room • 2 bedrooms

Family Package! 4BR Twin Beds in Karangasem
Private Room • 4 bedrooms
Spacious Homestay! 5BR Double Room in Karangasem
Private Room • 5 bedrooms

Group Fiesta! 3BR Twin Beds in Karangasem
Private Room • 3 bedrooms
Group Staycation! 3BR Twin Room in Karangasem
Entire Place • 3 bedrooms
Group Vacation! 4BR Twin Beds in Karangasem
Private Room • 4 bedrooms
Note: Performance varies based on location, size, amenities, seasonality, and management quality. Data reflects the past 12 months.
Top Performing Airbnb Hosts in Budakeling (2025)
Learn from the best! This table showcases top-performing Airbnb hosts in Budakeling based on the number of properties managed and estimated total revenue over the past year. Analyze their scale and performance metrics.
| Host Name | Properties | Grossing Revenue | Stay Reviews | Avg Rating |
|---|---|---|---|---|
| Host #449686872 | 15 | $17,444 | 7 | 0.13/5.0 |
| Host #377889916 | 16 | $10,716 | 0 | 0.00/5.0 |
| Host #67394941 | 11 | $8,527 | 0 | 0.00/5.0 |
| Host #409607427 | 2 | $1,341 | 2 | 0.00/5.0 |
| Host #94274689 | 2 | $163 | 4 | 2.50/5.0 |
Analyzing the strategies of top hosts, such as their property selection, pricing, and guest communication, can offer valuable lessons for optimizing your own Airbnb operations in Budakeling.
Dive Deeper: Advanced Budakeling STR Market Data (2025)
Ready to unlock more insights? AirROI provides access to advanced metrics and comprehensive Airbnb data for Budakeling. Explore detailed analytics beyond this report to refine your investment strategy, optimize pricing, and maximize your vacation rental profits.
Explore Advanced MetricsBudakeling Short-Term Rental Market Composition (2025): Property & Room Types
Room Type Distribution
Property Type Distribution
Market Composition Insights for Budakeling
- The Budakeling Airbnb market composition is heavily skewed towards Private Room listings, which make up 82.6% of the 46 active rentals. This indicates strong guest preference for privacy and space.
- Looking at the property type distribution in Budakeling, Hotel/Boutique properties are the most common (60.9%), reflecting the local real estate landscape.
- Houses represent a significant 39.1% portion, catering likely to families or larger groups.
- The presence of 60.9% Hotel/Boutique listings indicates integration with traditional hospitality.
Budakeling Airbnb Room Capacity Analysis (2025): Bedroom Distribution
Distribution of Listings by Number of Bedrooms
Room Capacity Insights for Budakeling
- The dominant room capacity in Budakeling is 1 bedroom listings, making up 52.2% of the market. This suggests a strong demand for properties suitable for couples or solo travelers.
- Together, 1 bedroom and 2 bedrooms properties represent 67.4% of the active Airbnb listings in Budakeling, indicating a high concentration in these sizes.
- With over half the market (52.2%) consisting of studios or 1-bedroom units, Budakeling is particularly well-suited for individuals or couples.
- A significant 32.5% of listings offer 3+ bedrooms, catering to larger groups and families seeking more space in Budakeling.
Budakeling Vacation Rental Guest Capacity Trends (2025)
Distribution of Listings by Guest Capacity
Guest Capacity Insights for Budakeling
- The most common guest capacity trend in Budakeling vacation rentals is listings accommodating 2 guests (52.2%). This suggests the primary traveler segment is likely couples or solo travelers.
- Properties designed for 2 guests and 8+ guests dominate the Budakeling STR market, accounting for 69.6% of listings.
- A significant 52.2% of listings cater specifically to 1-2 guests, highlighting strong demand from couples and solo travelers in Budakeling.
- 32.6% of properties accommodate 6+ guests, serving the market segment for larger families or group travel in Budakeling.
- On average, properties in Budakeling are equipped to host 4.0 guests.
Budakeling Airbnb Booking Patterns (2025): Available vs. Booked Days
Available Days Distribution
Booked Days Distribution
Booking Pattern Insights for Budakeling
- The most common availability pattern in Budakeling falls within the 271-366 days range, representing 100% of listings. This suggests many properties have significant open periods on their calendars.
- Approximately 100.0% of listings show high availability (181+ days open annually), indicating potential for increased bookings or specific owner usage patterns.
- For booked days, the 1-30 days range is most frequent in Budakeling (95.7%), reflecting common guest stay durations or potential owner blocking patterns.
Budakeling Airbnb Minimum Stay Requirements Analysis
Distribution of Listings by Minimum Night Requirement
1 Night
39 listings
100% of total
Key Insights
- The most prevalent minimum stay requirement in Budakeling is 1 Night, adopted by 100% of listings. This highlights the market's preference for shorter, flexible bookings.
- A strong majority (100.0%) of the Budakeling Airbnb data shows acceptance of very short stays (1-2 nights), indicating a dynamic, high-turnover market.
Recommendations
- Align with the market by considering a 1 Night minimum stay, as 100% of Budakeling hosts use this setting.
- Adjust minimum nights based on seasonality – potentially shorter during low season and longer during peak demand periods in Budakeling.
Budakeling Airbnb Cancellation Policy Trends (2025)
Cancellation policy data is currently unavailable for Budakeling.
Budakeling STR Booking Lead Time Analysis (2025)
Average Booking Lead Time by Month
Booking Lead Time Insights for Budakeling
- The overall average booking lead time for vacation rentals in Budakeling is 26 days.
- Guests book furthest in advance for stays during March (average 36 days), likely coinciding with peak travel demand or local events.
- The shortest booking windows occur for stays in December (average 0 days), indicating more last-minute travel plans during this time.
- Seasonally, Fall (15 days avg.) sees the longest lead times, while Winter (0 days avg.) has the shortest, reflecting typical travel planning cycles.
Recommendations for Hosts
- Use the overall average lead time (26 days) as a baseline for your pricing and availability strategy in Budakeling.
- During December, focus on last-minute booking availability and promotions, as guests book with very short notice (0 days avg.).
- Target marketing efforts for the Fall season well in advance (at least 15 days) to capture early planners.
- Monitor your own booking lead times against these Budakeling averages to identify opportunities for dynamic pricing adjustments.
Popular & Essential Airbnb Amenities in Budakeling (2025)
Amenity Prevalence
No amenities with partial availability (less than 100%) were found to display in the chart. All essential amenities might be present in all listings. Check insights below.
Amenity Insights for Budakeling
- Essential amenities in Budakeling that guests expect include: Wifi, Dedicated workspace, TV, Kitchen, Carbon monoxide alarm, Dryer, Smoke alarm, Essentials, Washer, Air conditioning. Lacking these (any) could significantly impact bookings.
Recommendations for Hosts
- Ensure your listing includes all essential amenities for Budakeling: Wifi, Dedicated workspace, TV, Kitchen, Carbon monoxide alarm, Dryer, Smoke alarm, Essentials, Washer, Air conditioning.
- Highlight unique or less common amenities you offer (e.g., hot tub, dedicated workspace, EV charger) in your listing description and photos.
- Regularly check competitor amenities in Budakeling to stay competitive.
Budakeling Airbnb Guest Demographics & Profile Analysis (2025)
Guest Profile Summary for Budakeling
- The typical guest profile for Airbnb in Budakeling consists of predominantly international visitors (100%), with top international origins including India, typically belonging to the 1990s (Older Gen Z) group (50%), primarily speaking Gujarati or English.
- Domestic travelers account for 0.0% of guests.
- Top languages spoken are Gujarati (33.3%) followed by English (33.3%).
- A significant demographic segment is the Post-2000s (Gen Z/Alpha) group, representing 50% of guests.
Recommendations for Hosts
- Focus marketing internationally, particularly towards travelers from India.
- Offer listing details and communication support in Gujarati.
- Tailor amenities and listing descriptions to appeal to the dominant 1990s (Older Gen Z) demographic (e.g., highlight fast WiFi, smart home features, local guides).
- Highlight unique local experiences or amenities relevant to the primary guest profile.
- Consider seasonal promotions aligned with peak travel times for key origin markets.
Nearby Short-Term Rental Market Comparison
How does the Budakeling Airbnb market stack up against its neighbors? Compare key performance metrics like average monthly revenue, ADR, and occupancy rates in surrounding areas to understand the broader regional STR landscape.
| Market | Active Properties | Monthly Revenue | Daily Rate | Avg. Occupancy |
|---|---|---|---|---|
| Padangaji | 14 | $7,854 | $326.79 | 74% |
| BATAS DESA BATU JANGKIH | 14 | $4,638 | $485.04 | 37% |
| Bedulu | 35 | $3,506 | $252.39 | 49% |
| Pejeng Kawan | 120 | $3,303 | $213.75 | 46% |
| Pecatu | 1,532 | $3,185 | $253.79 | 50% |
| Sanding | 12 | $3,133 | $252.45 | 37% |
| Duda | 25 | $3,103 | $216.55 | 46% |
| Seminyak | 2,155 | $2,895 | $289.07 | 44% |
| Pujut | 10 | $2,772 | $153.49 | 49% |
| Dencarik | 52 | $2,660 | $193.40 | 48% |