Nedumbassery Airbnb Market Analysis 2025: Short Term Rental Data & Vacation Rental Statistics in Kerala, India
Is Airbnb profitable in Nedumbassery in 2025? Explore comprehensive Airbnb analytics for Nedumbassery, Kerala, India to uncover income potential. This 2025 STR market report for Nedumbassery, based on AirROI data from June 2024 to May 2025, reveals key trends in the niche market of 21 active listings.
Whether you're considering an Airbnb investment in Nedumbassery, optimizing your existing vacation rental, or exploring rental arbitrage opportunities, understanding the Nedumbassery Airbnb data is crucial. Leveraging the low regulation environment is key to maximizing your short term rental income potential. Let's dive into the specifics.
Key Nedumbassery Airbnb Performance Metrics Overview
Monthly Airbnb Revenue Variations & Income Potential in Nedumbassery (2025)
Understanding the monthly revenue variations for Airbnb listings in Nedumbassery is key to maximizing your short term rental income potential. Seasonality significantly impacts earnings. Our analysis, based on data from the past 12 months, shows that the peak revenue month for STRs in Nedumbassery is typically January, while September often presents the lowest earnings, highlighting opportunities for strategic pricing adjustments during shoulder and low seasons. Explore the typical Airbnb income in Nedumbassery across different performance tiers:
- Best-in-class properties (Top 10%) achieve $520+ monthly, often utilizing dynamic pricing and superior guest experiences.
- Strong performing properties (Top 25%) earn $341 or more, indicating effective management and desirable locations/amenities.
- Typical properties (Median) generate around $189 per month, representing the average market performance.
- Entry-level properties (Bottom 25%) see earnings around $89, often with potential for optimization.
Average Monthly Airbnb Earnings Trend in Nedumbassery
Nedumbassery Airbnb Occupancy Rate Trends (2025)
Maximize your bookings by understanding the Nedumbassery STR occupancy trends. Seasonal demand shifts significantly influence how often properties are booked. Typically, Januarysees the highest demand (peak season occupancy), while May experiences the lowest (low season). Effective strategies, like adjusting minimum stays or offering promotions, can boost occupancy during slower periods. Here's how different property tiers perform in Nedumbassery:
- Best-in-class properties (Top 10%) achieve 46%+ occupancy, indicating high desirability and potentially optimized availability.
- Strong performing properties (Top 25%) maintain 24% or higher occupancy, suggesting good market fit and guest satisfaction.
- Typical properties (Median) have an occupancy rate around 13%.
- Entry-level properties (Bottom 25%) average 8% occupancy, potentially facing higher vacancy.
Average Monthly Occupancy Rate Trend in Nedumbassery
Average Daily Rate (ADR) Airbnb Trends in Nedumbassery (2025)
Effective short term rental pricing strategy in Nedumbassery involves understanding monthly ADR fluctuations. The Average Daily Rate (ADR) for Airbnb in Nedumbassery typically peaks in January and dips lowest during April. Leveraging Airbnb dynamic pricing tools or strategies based on this seasonality can significantly boost revenue. Here's a look at the typical nightly rates achieved:
- Best-in-class properties (Top 10%) command rates of $78+ per night, often due to premium features or locations.
- Strong performing properties (Top 25%) achieve nightly rates of $61 or more.
- Typical properties (Median) charge around $30 per night.
- Entry-level properties (Bottom 25%) earn around $27 per night.
Average Daily Rate (ADR) Trend by Month in Nedumbassery
Get Live Nedumbassery Market Intelligence 👇

Explore Real-time Analytics
Airbnb Seasonality Analysis & Trends in Nedumbassery (2025)
Peak Season (January, February, December)
- Revenue averages $380 per month
- Occupancy rates average 25.9%
- Daily rates average $49
Shoulder Season
- Revenue averages $225 per month
- Occupancy maintains around 17.5%
- Daily rates hold near $47
Low Season (April, June, September)
- Revenue drops to average $103 per month
- Occupancy decreases to average 10.9%
- Daily rates adjust to average $46
Seasonality Insights for Nedumbassery
- The Airbnb seasonality in Nedumbassery shows highly seasonal trends requiring careful strategy. While the sections above show seasonal averages, it's also insightful to look at the extremes:
- During the high season, the absolute peak month showcases Nedumbassery's highest earning potential, with monthly revenues capable of climbing to $415, occupancy reaching a high of 26.9%, and ADRs peaking at $51.
- Conversely, the slowest single month of the year, typically falling within the low season, marks the market's lowest point. In this month, revenue might dip to $0, occupancy could drop to 0.0%, and ADRs may adjust down to $42.
- Understanding both the seasonal averages and these monthly peaks and troughs in revenue, occupancy, and ADR is crucial for maximizing your Airbnb profit potential in Nedumbassery.
Seasonal Strategies for Maximizing Profit
- Peak Season: Maximize revenue through premium pricing and potentially longer minimum stays. Ensure high availability.
- Low Season: Offer competitive pricing, special promotions (e.g., extended stay discounts), and flexible cancellation policies. Target off-season travelers like remote workers or budget-conscious guests.
- Shoulder Seasons: Implement dynamic pricing that balances peak and low rates. Target weekend travelers or specific events. Offer slightly more flexible terms than peak season.
- Regularly analyze your own performance against these Nedumbassery seasonality benchmarks and adjust your pricing and availability strategy accordingly.
Best Areas for Airbnb Investment in Nedumbassery (2025)
Exploring the top neighborhoods for short-term rentals in Nedumbassery? This section highlights key areas, outlining why they are attractive for hosts and guests, along with notable local attractions. Consider these locations based on your target guest profile and investment strategy.
| Neighborhood / Area | Why Host Here? (Target Guests & Appeal) | Key Attractions & Landmarks |
|---|---|---|
| Nedumbassery | Strategically located near Cochin International Airport, making it a perfect spot for guests arriving in Kerala and those visiting nearby attractions. | Cochin International Airport, Athirappilly Waterfalls, Cherai Beach, Munnar Hill Station, Kochi backwaters |
| Kochi | A vibrant city with rich cultural heritage and major tourist attractions, popular among domestic and international travelers. | Fort Kochi, Chinese Fishing Nets, Mattancherry Palace, Jewish Synagogue, Marine Drive |
| Aluva | Accessible location close to Kochi, known for its serene surroundings and the banks of the Periyar River, attracting both tourists and business travelers. | Aluva Palace, River Periyar, Shiva Temple, Bird Sanctuary |
| Athirappilly | Famous for its stunning waterfalls and lush natural beauty, making it a popular getaway for nature lovers. | Athirappilly Waterfalls, Vazhachal Waterfalls, Thrissur Pooram Festival, Endangered species of butterflies |
| Cherai | Known for its picturesque beaches and backwaters, attracting beach lovers and people looking for a relaxing stay. | Cherai Beach, Cherai Muziris Heritage Project, Fishing activities, Puranattukara Village |
| Munnar | A hill station famous for its tea gardens and cool climate, appealing to tourists seeking a retreat from the heat. | Tea Gardens, Anamudi Peak, Eravikulam National Park, Mattupetty Dam |
| Kumarakom | A beautiful backwater destination famous for bird watching and houseboat experiences, attracting romantic getaways and nature enthusiasts. | Vembanad Lake, Bird Sanctuary, Houseboat rides, Ayurvedic resorts |
| Pathanamthitta | Rich in cultural heritage and serene landscapes, making it a popular choice for eco-tourism and pilgrimages. | Sabarimala Temple, Perunthenaruvi Waterfalls, Gavi Forest, Patamon Eco-Tourism |
Understanding Airbnb License Requirements & STR Laws in Nedumbassery (2025)
While Nedumbassery, Kerala, India currently shows low STR regulations, specific Airbnb license requirements might still exist or change. Always verify the latest short term rental regulations and Airbnb license requirements directly with local government authorities for Nedumbassery to ensure full compliance before hosting.
(Source: AirROI data, 2025, based on 5% licensed listings)
Top Performing Airbnb Properties in Nedumbassery (2025)
Benchmark your potential! Explore examples of top-performing Airbnb properties in Nedumbasserybased on Trailing Twelve Month (TTM) revenue. Analyze their characteristics, revenue, occupancy rate, and ADR to understand what drives success in this market.

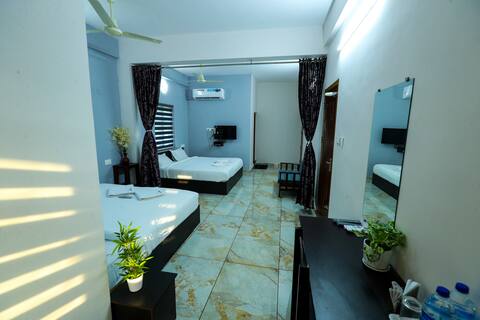
Homestay - Near Cochin Airport
Entire Place • 6 bedrooms

Cozy room in traditional home near airport - #101
Private Room • 1 bedroom

Luxury Homes-Fully Furnished- Near Cochin Airport
Entire Place • 3 bedrooms

DRO Homes, Stay -12Pax, Near Kochi Airport - NonAC
Entire Place • 4 bedrooms

Cozy room in traditional home near airport - #103
Private Room • 1 bedroom
Family Suite
Private Room • 1 bedroom
Note: Performance varies based on location, size, amenities, seasonality, and management quality. Data reflects the past 12 months.
Top Performing Airbnb Hosts in Nedumbassery (2025)
Learn from the best! This table showcases top-performing Airbnb hosts in Nedumbassery based on the number of properties managed and estimated total revenue over the past year. Analyze their scale and performance metrics.
| Host Name | Properties | Grossing Revenue | Stay Reviews | Avg Rating |
|---|---|---|---|---|
| Gopalakrishnan | 9 | $16,221 | 72 | 4.94/5.0 |
| Vibin | 3 | $11,615 | 51 | 4.92/5.0 |
| Host #494027335 | 4 | $4,773 | 1 | N/A/5.0 |
| Dro | 1 | $2,610 | 5 | 5.00/5.0 |
| Base9 | 2 | $1,177 | 4 | 4.25/5.0 |
| Jomon | 2 | $968 | 6 | 5.00/5.0 |
Analyzing the strategies of top hosts, such as their property selection, pricing, and guest communication, can offer valuable lessons for optimizing your own Airbnb operations in Nedumbassery.
Dive Deeper: Advanced Nedumbassery STR Market Data (2025)
Ready to unlock more insights? AirROI provides access to advanced metrics and comprehensive Airbnb data for Nedumbassery. Explore detailed analytics beyond this report to refine your investment strategy, optimize pricing, and maximize your vacation rental profits.
Explore Advanced MetricsNedumbassery Short-Term Rental Market Composition (2025): Property & Room Types
Room Type Distribution
Property Type Distribution
Market Composition Insights for Nedumbassery
- The Nedumbassery Airbnb market composition is heavily skewed towards Private Room listings, which make up 66.7% of the 21 active rentals. This indicates strong guest preference for privacy and space.
- Looking at the property type distribution in Nedumbassery, Apartment/Condo properties are the most common (52.4%), reflecting the local real estate landscape.
- The presence of 33.3% Hotel/Boutique listings indicates integration with traditional hospitality.
Nedumbassery Airbnb Room Capacity Analysis (2025): Bedroom Distribution
Distribution of Listings by Number of Bedrooms
Room Capacity Insights for Nedumbassery
- The dominant room capacity in Nedumbassery is 1 bedroom listings, making up 71.4% of the market. This suggests a strong demand for properties suitable for couples or solo travelers.
- Together, 1 bedroom and 5+ bedrooms properties represent 80.9% of the active Airbnb listings in Nedumbassery, indicating a high concentration in these sizes.
- With over half the market (71.4%) consisting of studios or 1-bedroom units, Nedumbassery is particularly well-suited for individuals or couples.
- A significant 23.8% of listings offer 3+ bedrooms, catering to larger groups and families seeking more space in Nedumbassery.
Nedumbassery Vacation Rental Guest Capacity Trends (2025)
Distribution of Listings by Guest Capacity
Guest Capacity Insights for Nedumbassery
- The most common guest capacity trend in Nedumbassery vacation rentals is listings accommodating 3 guests (38.1%). This suggests the primary traveler segment is likely small families or groups.
- Properties designed for 3 guests and 2 guests dominate the Nedumbassery STR market, accounting for 71.4% of listings.
- 28.6% of properties accommodate 6+ guests, serving the market segment for larger families or group travel in Nedumbassery.
- On average, properties in Nedumbassery are equipped to host 4.0 guests.
Nedumbassery Airbnb Booking Patterns (2025): Available vs. Booked Days
Available Days Distribution
Booked Days Distribution
Booking Pattern Insights for Nedumbassery
- The most common availability pattern in Nedumbassery falls within the 271-366 days range, representing 95.2% of listings. This suggests many properties have significant open periods on their calendars.
- Approximately 95.2% of listings show high availability (181+ days open annually), indicating potential for increased bookings or specific owner usage patterns.
- For booked days, the 1-30 days range is most frequent in Nedumbassery (52.4%), reflecting common guest stay durations or potential owner blocking patterns.
- A notable 4.8% of properties secure long booking periods (181+ days booked per year), highlighting successful long-term rental strategies or significant owner usage.
Nedumbassery Airbnb Minimum Stay Requirements Analysis
Distribution of Listings by Minimum Night Requirement
1 Night
21 listings
100% of total
Key Insights
- The most prevalent minimum stay requirement in Nedumbassery is 1 Night, adopted by 100% of listings. This highlights the market's preference for shorter, flexible bookings.
- A strong majority (100.0%) of the Nedumbassery Airbnb data shows acceptance of very short stays (1-2 nights), indicating a dynamic, high-turnover market.
Recommendations
- Align with the market by considering a 1 Night minimum stay, as 100% of Nedumbassery hosts use this setting.
- Adjust minimum nights based on seasonality – potentially shorter during low season and longer during peak demand periods in Nedumbassery.
Nedumbassery Airbnb Cancellation Policy Trends Analysis (2025)
Flexible
4 listings
40% of total
Moderate
1 listings
10% of total
Firm
5 listings
50% of total
Cancellation Policy Insights for Nedumbassery
- The prevailing Airbnb cancellation policy trend in Nedumbassery is Firm, used by 50% of listings.
- There's a relatively balanced mix between guest-friendly (50.0%) and stricter (50.0%) policies, offering choices for different guest needs.
Recommendations for Hosts
- Consider adopting a Firm policy to align with the 50% market standard in Nedumbassery.
- Regularly review your cancellation policy against competitors and market demand shifts in Nedumbassery.
Nedumbassery STR Booking Lead Time Analysis (2025)
Average Booking Lead Time by Month
Booking Lead Time Insights for Nedumbassery
- The overall average booking lead time for vacation rentals in Nedumbassery is 17 days.
- Guests book furthest in advance for stays during December (average 37 days), likely coinciding with peak travel demand or local events.
- The shortest booking windows occur for stays in June (average 0 days), indicating more last-minute travel plans during this time.
- Seasonally, Winter (27 days avg.) sees the longest lead times, while Summer (5 days avg.) has the shortest, reflecting typical travel planning cycles.
Recommendations for Hosts
- Use the overall average lead time (17 days) as a baseline for your pricing and availability strategy in Nedumbassery.
- For December stays, consider implementing length-of-stay discounts or slightly higher rates for bookings made less than 37 days out to capitalize on advance planning.
- During June, focus on last-minute booking availability and promotions, as guests book with very short notice (0 days avg.).
- Target marketing efforts for the Winter season well in advance (at least 27 days) to capture early planners.
- Monitor your own booking lead times against these Nedumbassery averages to identify opportunities for dynamic pricing adjustments.
Popular & Essential Airbnb Amenities in Nedumbassery (2025)
Amenity Prevalence
Amenity Insights for Nedumbassery
- Essential amenities in Nedumbassery that guests expect include: Wifi, TV. Lacking these (any) could significantly impact bookings.
- Popular amenities like Air conditioning, Essentials, Hot water are common but not universal. Offering these can provide a competitive edge.
Recommendations for Hosts
- Ensure your listing includes all essential amenities for Nedumbassery: Wifi, TV.
- Consider adding popular differentiators like Air conditioning or Essentials to increase appeal.
- Highlight unique or less common amenities you offer (e.g., hot tub, dedicated workspace, EV charger) in your listing description and photos.
- Regularly check competitor amenities in Nedumbassery to stay competitive.
Nedumbassery Airbnb Guest Demographics & Profile Analysis (2025)
Guest Profile Summary for Nedumbassery
- The typical guest profile for Airbnb in Nedumbassery consists of predominantly international visitors (83%), with top international origins including India, typically belonging to the Post-2000s (Gen Z/Alpha) group (50%), primarily speaking English or Hindi.
- Domestic travelers account for 16.7% of guests.
- Key international markets include United States (20.8%) and India (16.7%).
- Top languages spoken are English (36.3%) followed by Hindi (16.3%).
- A significant demographic segment is the Post-2000s (Gen Z/Alpha) group, representing 50% of guests.
Recommendations for Hosts
- Focus marketing internationally, particularly towards travelers from India.
- Tailor amenities and listing descriptions to appeal to the dominant Post-2000s (Gen Z/Alpha) demographic (e.g., highlight fast WiFi, smart home features, local guides).
- Highlight unique local experiences or amenities relevant to the primary guest profile.
- Consider seasonal promotions aligned with peak travel times for key origin markets.
Nearby Short-Term Rental Market Comparison
How does the Nedumbassery Airbnb market stack up against its neighbors? Compare key performance metrics like average monthly revenue, ADR, and occupancy rates in surrounding areas to understand the broader regional STR landscape.
| Market | Active Properties | Monthly Revenue | Daily Rate | Avg. Occupancy |
|---|---|---|---|---|
| Halakkarai | 10 | $1,116 | $164.26 | 32% |
| Pothamedu | 15 | $1,057 | $165.22 | 24% |
| Poopalli | 12 | $860 | $150.12 | 27% |
| Komalapuram | 10 | $842 | $159.81 | 19% |
| Valparai | 11 | $819 | $211.55 | 23% |
| Lovedale | 27 | $797 | $196.90 | 21% |
| Banagudi | 10 | $726 | $113.86 | 22% |
| Achanakal hatty | 15 | $674 | $75.35 | 32% |
| Vilpatti | 52 | $547 | $102.25 | 27% |
| Gandhi Nagar B. L. Shed | 10 | $546 | $66.61 | 38% |