Munambam Airbnb Market Analysis 2025: Short Term Rental Data & Vacation Rental Statistics in Kerala, India
Is Airbnb profitable in Munambam in 2025? Explore comprehensive Airbnb analytics for Munambam, Kerala, India to uncover income potential. This 2025 STR market report for Munambam, based on AirROI data from June 2024 to May 2025, reveals key trends in the niche market of 31 active listings.
Whether you're considering an Airbnb investment in Munambam, optimizing your existing vacation rental, or exploring rental arbitrage opportunities, understanding the Munambam Airbnb data is crucial. Understanding the local regulations is key to maximizing your short term rental income potential. Let's dive into the specifics.
Key Munambam Airbnb Performance Metrics Overview
Monthly Airbnb Revenue Variations & Income Potential in Munambam (2025)
Understanding the monthly revenue variations for Airbnb listings in Munambam is key to maximizing your short term rental income potential. Seasonality significantly impacts earnings. Our analysis, based on data from the past 12 months, shows that the peak revenue month for STRs in Munambam is typically July, while November often presents the lowest earnings, highlighting opportunities for strategic pricing adjustments during shoulder and low seasons. Explore the typical Airbnb income in Munambam across different performance tiers:
- Best-in-class properties (Top 10%) achieve $2,872+ monthly, often utilizing dynamic pricing and superior guest experiences.
- Strong performing properties (Top 25%) earn $780 or more, indicating effective management and desirable locations/amenities.
- Typical properties (Median) generate around $336 per month, representing the average market performance.
- Entry-level properties (Bottom 25%) see earnings around $186, often with potential for optimization.
Average Monthly Airbnb Earnings Trend in Munambam
Munambam Airbnb Occupancy Rate Trends (2025)
Maximize your bookings by understanding the Munambam STR occupancy trends. Seasonal demand shifts significantly influence how often properties are booked. Typically, Februarysees the highest demand (peak season occupancy), while May experiences the lowest (low season). Effective strategies, like adjusting minimum stays or offering promotions, can boost occupancy during slower periods. Here's how different property tiers perform in Munambam:
- Best-in-class properties (Top 10%) achieve 53%+ occupancy, indicating high desirability and potentially optimized availability.
- Strong performing properties (Top 25%) maintain 31% or higher occupancy, suggesting good market fit and guest satisfaction.
- Typical properties (Median) have an occupancy rate around 20%.
- Entry-level properties (Bottom 25%) average 12% occupancy, potentially facing higher vacancy.
Average Monthly Occupancy Rate Trend in Munambam
Average Daily Rate (ADR) Airbnb Trends in Munambam (2025)
Effective short term rental pricing strategy in Munambam involves understanding monthly ADR fluctuations. The Average Daily Rate (ADR) for Airbnb in Munambam typically peaks in January and dips lowest during August. Leveraging Airbnb dynamic pricing tools or strategies based on this seasonality can significantly boost revenue. Here's a look at the typical nightly rates achieved:
- Best-in-class properties (Top 10%) command rates of $182+ per night, often due to premium features or locations.
- Strong performing properties (Top 25%) achieve nightly rates of $85 or more.
- Typical properties (Median) charge around $50 per night.
- Entry-level properties (Bottom 25%) earn around $26 per night.
Average Daily Rate (ADR) Trend by Month in Munambam
Get Live Munambam Market Intelligence 👇

Explore Real-time Analytics
Airbnb Seasonality Analysis & Trends in Munambam (2025)
Peak Season (July, September, February)
- Revenue averages $1,494 per month
- Occupancy rates average 31.5%
- Daily rates average $89
Shoulder Season
- Revenue averages $1,046 per month
- Occupancy maintains around 25.2%
- Daily rates hold near $91
Low Season (January, May, November)
- Revenue drops to average $767 per month
- Occupancy decreases to average 18.1%
- Daily rates adjust to average $105
Seasonality Insights for Munambam
- The Airbnb seasonality in Munambam shows highly seasonal trends requiring careful strategy. While the sections above show seasonal averages, it's also insightful to look at the extremes:
- During the high season, the absolute peak month showcases Munambam's highest earning potential, with monthly revenues capable of climbing to $1,595, occupancy reaching a high of 37.3%, and ADRs peaking at $124.
- Conversely, the slowest single month of the year, typically falling within the low season, marks the market's lowest point. In this month, revenue might dip to $668, occupancy could drop to 16.4%, and ADRs may adjust down to $78.
- Understanding both the seasonal averages and these monthly peaks and troughs in revenue, occupancy, and ADR is crucial for maximizing your Airbnb profit potential in Munambam.
Seasonal Strategies for Maximizing Profit
- Peak Season: Maximize revenue through premium pricing and potentially longer minimum stays. Ensure high availability.
- Low Season: Offer competitive pricing, special promotions (e.g., extended stay discounts), and flexible cancellation policies. Target off-season travelers like remote workers or budget-conscious guests.
- Shoulder Seasons: Implement dynamic pricing that balances peak and low rates. Target weekend travelers or specific events. Offer slightly more flexible terms than peak season.
- Regularly analyze your own performance against these Munambam seasonality benchmarks and adjust your pricing and availability strategy accordingly.
Best Areas for Airbnb Investment in Munambam (2025)
Exploring the top neighborhoods for short-term rentals in Munambam? This section highlights key areas, outlining why they are attractive for hosts and guests, along with notable local attractions. Consider these locations based on your target guest profile and investment strategy.
| Neighborhood / Area | Why Host Here? (Target Guests & Appeal) | Key Attractions & Landmarks |
|---|---|---|
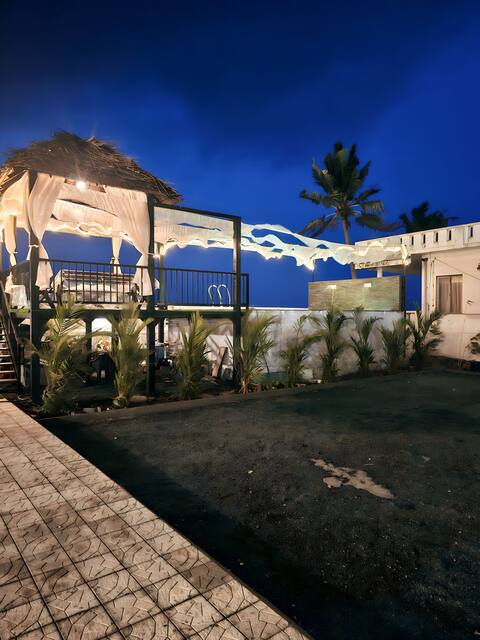
| Munambam Beach | A picturesque beach known for its serene atmosphere and stunning sunsets. Ideal for tourists seeking relaxation by the sea, with opportunities for water sports and beach activities. | Munambam Beach, Kottaparambu Beach, Fishing Harbor, Vypin Island, Coastal Walkways |
| Cherai Beach | Famous for its golden sands and calm waters, Cherai Beach is a popular destination for both leisure travelers and families. Great for swimming, sunbathing, and enjoying local seafood. | Cherai Beach, Chinese Fishing Nets, Paliyam Juma Masjid, Sree Nelliswaram Ayyappa Temple, Coconut groves |
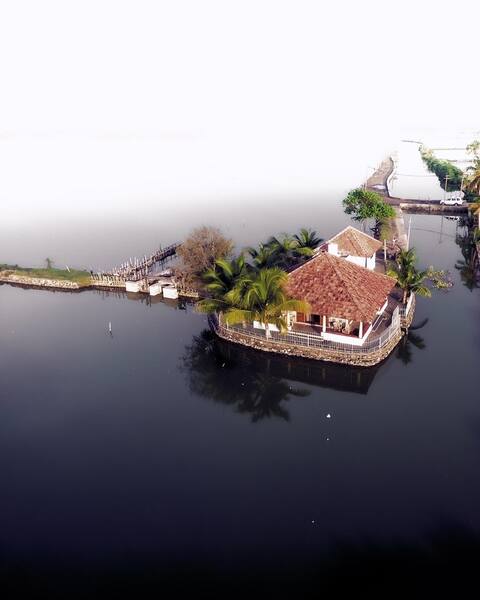
| Kochi Backwaters | The enchanting backwaters of Kochi offer a unique experience of Kerala's natural beauty and traditional houseboat rides. Attracts tourists looking for adventure and tranquility in nature. | Backwater Houseboat Rides, Kumarakom Bird Sanctuary, Vembanad Lake, Punnamada Lake, Traditional Kerala Cuisine |
| Fort Kochi | A historical area known for its colonial architecture, Fort Kochi attracts cultural enthusiasts interested in heritage, art, and local history. It's a vibrant area with many attractions. | Fort Kochi Beach, Chinese Fishing Nets, St. Francis Church, Kathakali Dance Performances, Jew Town and Synagogue |
| Ernakulam | A bustling urban center offering a mix of shopping, dining, and nightlife. Popular with business travelers and those seeking a more urban environment while still being close to attractions. | MG Road, Sabor India Mall, Marine Drive, Subhash Park, Ernakulam Market |
| Kochi Marine Drive | A picturesque promenade along the waterfront, ideal for evening strolls and enjoying the views of the sea. Great for both tourists and locals looking for relaxation and ambiance. | Marine Drive Promenade, Rainbow Bridge, Cochin Shipyard, Shopping Malls, Restaurants with waterfront views |
| Vypin Island | An island destination offering pristine beaches and a quieter escape from the city. Appeals to families and tourists looking for natural beauty and outdoor activities. | Kottu Puzha Beach, Puthuvype Beach, Vypin Lighthouse, Local Fishing Villages, Eco Tourism Spots |
| Njarackal | A serene village known for its agricultural landscapes and close proximity to nature. Ideal for eco-tourism and travelers seeking off-the-beaten-path experiences. | Njarackal Backwaters, Farming Experiences, Bird Watching, Local Temples, Cultural Homestays |
Understanding Airbnb License Requirements & STR Laws in Munambam (2025)
With 23% of listings showing registration in 2025, understanding potential Airbnb license requirements is crucial in Munambam. Always verify the latest short term rental regulations and Airbnb license requirements directly with local government authorities for Munambam to ensure full compliance before hosting.
(Source: AirROI data, 2025, based on 23% licensed listings)
Top Performing Airbnb Properties in Munambam (2025)
Benchmark your potential! Explore examples of top-performing Airbnb properties in Munambambased on Trailing Twelve Month (TTM) revenue. Analyze their characteristics, revenue, occupancy rate, and ADR to understand what drives success in this market.

Camper by the bay
Entire Place • 5 bedrooms

Theeraa stunning beachfront villa in Cherai
Entire Place • 3 bedrooms
The Cabana - Managed by FeelHome
Entire Place • 8 bedrooms
Living waters, Kuzhipally beach, Cherai
Entire Place • 2 bedrooms

Sunshine Beach villa
Entire Place • 2 bedrooms
Villa between sea and backwaters
Entire Place • 2 bedrooms
Note: Performance varies based on location, size, amenities, seasonality, and management quality. Data reflects the past 12 months.
Top Performing Airbnb Hosts in Munambam (2025)
Learn from the best! This table showcases top-performing Airbnb hosts in Munambam based on the number of properties managed and estimated total revenue over the past year. Analyze their scale and performance metrics.
| Host Name | Properties | Grossing Revenue | Stay Reviews | Avg Rating |
|---|---|---|---|---|
| Swahel | 1 | $98,613 | 68 | 4.87/5.0 |
| Priyanka | 1 | $22,534 | 45 | 4.93/5.0 |
| Host #8949724 | 1 | $18,581 | 5 | 5.00/5.0 |
| Host #509372109 | 6 | $15,647 | 0 | N/A/5.0 |
| Joseph | 1 | $8,234 | 114 | 4.88/5.0 |
| Syamlal | 1 | $7,481 | 6 | 5.00/5.0 |
| Unnikannan | 1 | $6,343 | 24 | 4.75/5.0 |
| Host #326356751 | 1 | $5,481 | 0 | N/A/5.0 |
| Host #463165175 | 9 | $4,141 | 0 | N/A/5.0 |
| Host #452846399 | 1 | $3,435 | 0 | N/A/5.0 |
Analyzing the strategies of top hosts, such as their property selection, pricing, and guest communication, can offer valuable lessons for optimizing your own Airbnb operations in Munambam.
Dive Deeper: Advanced Munambam STR Market Data (2025)
Ready to unlock more insights? AirROI provides access to advanced metrics and comprehensive Airbnb data for Munambam. Explore detailed analytics beyond this report to refine your investment strategy, optimize pricing, and maximize your vacation rental profits.
Explore Advanced MetricsMunambam Short-Term Rental Market Composition (2025): Property & Room Types
Room Type Distribution
Property Type Distribution
Market Composition Insights for Munambam
- The Munambam Airbnb market composition is heavily skewed towards Entire Home/Apt listings, which make up 64.5% of the 31 active rentals. This indicates strong guest preference for privacy and space.
- However, a notable 35.5% share for Private Rooms suggests opportunities for budget-conscious travelers or hosts renting out spare rooms.
- Looking at the property type distribution in Munambam, House properties are the most common (64.5%), reflecting the local real estate landscape.
- Houses represent a significant 64.5% portion, catering likely to families or larger groups.
- The presence of 35.5% Hotel/Boutique listings indicates integration with traditional hospitality.
Munambam Airbnb Room Capacity Analysis (2025): Bedroom Distribution
Distribution of Listings by Number of Bedrooms
Room Capacity Insights for Munambam
- The dominant room capacity in Munambam is 2 bedrooms listings, making up 29% of the market. This suggests a strong demand for properties suitable for couples or solo travelers.
- Together, 2 bedrooms and 5+ bedrooms properties represent 54.8% of the active Airbnb listings in Munambam, indicating a high concentration in these sizes.
- A significant 58.1% of listings offer 3+ bedrooms, catering to larger groups and families seeking more space in Munambam.
Munambam Vacation Rental Guest Capacity Trends (2025)
Distribution of Listings by Guest Capacity
Guest Capacity Insights for Munambam
- The most common guest capacity trend in Munambam vacation rentals is listings accommodating 8+ guests (48.4%). This suggests the primary traveler segment is likely larger groups.
- Properties designed for 8+ guests and 5 guests dominate the Munambam STR market, accounting for 61.3% of listings.
- 54.8% of properties accommodate 6+ guests, serving the market segment for larger families or group travel in Munambam.
- On average, properties in Munambam are equipped to host 5.6 guests.
Munambam Airbnb Booking Patterns (2025): Available vs. Booked Days
Available Days Distribution
Booked Days Distribution
Booking Pattern Insights for Munambam
- The most common availability pattern in Munambam falls within the 271-366 days range, representing 87.1% of listings. This suggests many properties have significant open periods on their calendars.
- Approximately 96.8% of listings show high availability (181+ days open annually), indicating potential for increased bookings or specific owner usage patterns.
- For booked days, the 1-30 days range is most frequent in Munambam (51.6%), reflecting common guest stay durations or potential owner blocking patterns.
- A notable 3.2% of properties secure long booking periods (181+ days booked per year), highlighting successful long-term rental strategies or significant owner usage.
Munambam Airbnb Minimum Stay Requirements Analysis
Distribution of Listings by Minimum Night Requirement
1 Night
27 listings
90% of total
2 Nights
1 listings
3.3% of total
3 Nights
1 listings
3.3% of total
30+ Nights
1 listings
3.3% of total
Key Insights
- The most prevalent minimum stay requirement in Munambam is 1 Night, adopted by 90% of listings. This highlights the market's preference for shorter, flexible bookings.
- A strong majority (93.3%) of the Munambam Airbnb data shows acceptance of very short stays (1-2 nights), indicating a dynamic, high-turnover market.
Recommendations
- Align with the market by considering a 1 Night minimum stay, as 90% of Munambam hosts use this setting.
- Adjust minimum nights based on seasonality – potentially shorter during low season and longer during peak demand periods in Munambam.
Munambam Airbnb Cancellation Policy Trends Analysis (2025)
Flexible
11 listings
57.9% of total
Moderate
4 listings
21.1% of total
Firm
2 listings
10.5% of total
Strict
2 listings
10.5% of total
Cancellation Policy Insights for Munambam
- The prevailing Airbnb cancellation policy trend in Munambam is Flexible, used by 57.9% of listings.
- The market strongly favors guest-friendly terms, with 79.0% of listings offering Flexible or Moderate policies. This suggests guests in Munambam may expect booking flexibility.
Recommendations for Hosts
- Consider adopting a Flexible policy to align with the 57.9% market standard in Munambam.
- Given the high prevalence of Flexible policies (57.9%), offering this can enhance booking appeal, especially during shoulder seasons.
- Using a Strict policy might deter some guests, as only 10.5% of listings use it. Evaluate if potential revenue protection outweighs possible lower booking rates.
- Regularly review your cancellation policy against competitors and market demand shifts in Munambam.
Munambam STR Booking Lead Time Analysis (2025)
Average Booking Lead Time by Month
Booking Lead Time Insights for Munambam
- The overall average booking lead time for vacation rentals in Munambam is 25 days.
- Guests book furthest in advance for stays during March (average 40 days), likely coinciding with peak travel demand or local events.
- The shortest booking windows occur for stays in June (average 11 days), indicating more last-minute travel plans during this time.
- Seasonally, Winter (34 days avg.) sees the longest lead times, while Summer (16 days avg.) has the shortest, reflecting typical travel planning cycles.
Recommendations for Hosts
- Use the overall average lead time (25 days) as a baseline for your pricing and availability strategy in Munambam.
- For March stays, consider implementing length-of-stay discounts or slightly higher rates for bookings made less than 40 days out to capitalize on advance planning.
- During June, focus on last-minute booking availability and promotions, as guests book with very short notice (11 days avg.).
- Target marketing efforts for the Winter season well in advance (at least 34 days) to capture early planners.
- Monitor your own booking lead times against these Munambam averages to identify opportunities for dynamic pricing adjustments.
Popular & Essential Airbnb Amenities in Munambam (2025)
Amenity Prevalence
Amenity Insights for Munambam
- Essential amenities in Munambam that guests expect include: Wifi, Essentials. Lacking these (any) could significantly impact bookings.
- Popular amenities like Air conditioning, Kitchen, Washer are common but not universal. Offering these can provide a competitive edge.
Recommendations for Hosts
- Ensure your listing includes all essential amenities for Munambam: Wifi, Essentials.
- Prioritize adding missing essentials: Wifi, Essentials.
- Consider adding popular differentiators like Air conditioning or Kitchen to increase appeal.
- Highlight unique or less common amenities you offer (e.g., hot tub, dedicated workspace, EV charger) in your listing description and photos.
- Regularly check competitor amenities in Munambam to stay competitive.
Munambam Airbnb Guest Demographics & Profile Analysis (2025)
Guest Profile Summary for Munambam
- The typical guest profile for Airbnb in Munambam consists of a mix of domestic (49%) and international guests, with top international origins including United States, typically belonging to the Post-2000s (Gen Z/Alpha) group (50%), primarily speaking English or Hindi.
- Domestic travelers account for 49.1% of guests.
- Key international markets include India (49.1%) and United States (20%).
- Top languages spoken are English (47.4%) followed by Hindi (24.6%).
- A significant demographic segment is the Post-2000s (Gen Z/Alpha) group, representing 50% of guests.
Recommendations for Hosts
- Balance marketing efforts between domestic and international channels based on the guest mix.
- Tailor amenities and listing descriptions to appeal to the dominant Post-2000s (Gen Z/Alpha) demographic (e.g., highlight fast WiFi, smart home features, local guides).
- Highlight unique local experiences or amenities relevant to the primary guest profile.
- Consider seasonal promotions aligned with peak travel times for key origin markets.
Nearby Short-Term Rental Market Comparison
How does the Munambam Airbnb market stack up against its neighbors? Compare key performance metrics like average monthly revenue, ADR, and occupancy rates in surrounding areas to understand the broader regional STR landscape.
| Market | Active Properties | Monthly Revenue | Daily Rate | Avg. Occupancy |
|---|---|---|---|---|
| Halakkarai | 10 | $1,116 | $164.26 | 32% |
| Pothamedu | 15 | $1,057 | $165.22 | 24% |
| Poopalli | 12 | $860 | $150.12 | 27% |
| Komalapuram | 10 | $842 | $159.81 | 19% |
| Valparai | 11 | $819 | $211.55 | 23% |
| Lovedale | 27 | $797 | $196.90 | 21% |
| Banagudi | 10 | $726 | $113.86 | 22% |
| Achanakal hatty | 15 | $674 | $75.35 | 32% |
| Vilpatti | 52 | $547 | $102.25 | 27% |
| Gandhi Nagar B. L. Shed | 10 | $546 | $66.61 | 38% |