Marseille Airbnb Market Analysis 2026: Short Term Rental Data & Vacation Rental Statistics in Provence-Alpes-Côte d'Azur, France
Is Airbnb profitable in Marseille in 2026? Explore comprehensive Airbnb analytics for Marseille, Provence-Alpes-Côte d'Azur, France to uncover income potential. This 2026 STR market report for Marseille, based on AirROI data from February 2025 to January 2026, reveals key trends in the bustling market of 8,797 active listings.
Whether you're considering an Airbnb investment in Marseille, optimizing your existing vacation rental, or exploring rental arbitrage opportunities, understanding the Marseille Airbnb data is crucial. Navigating the high regulation landscape is key to maximizing your short term rental income potential. Let's dive into the specifics.
Key Marseille Airbnb Performance Metrics Overview
Monthly Airbnb Revenue Variations & Income Potential in Marseille (2026)
Understanding the monthly revenue variations for Airbnb listings in Marseille is key to maximizing your short term rental income potential. Seasonality significantly impacts earnings. Our analysis, based on data from the past 12 months, shows that the peak revenue month for STRs in Marseille is typically August, while January often presents the lowest earnings, highlighting opportunities for strategic pricing adjustments during shoulder and low seasons. Explore the typical Airbnb income in Marseille across different performance tiers:
- Best-in-class properties (Top 10%) achieve $3,774+ monthly, often utilizing dynamic pricing and superior guest experiences.
- Strong performing properties (Top 25%) earn $2,509 or more, indicating effective management and desirable locations/amenities.
- Typical properties (Median) generate around $1,617 per month, representing the average market performance.
- Entry-level properties (Bottom 25%) see earnings around $861, often with potential for optimization.
Average Monthly Airbnb Earnings Trend in Marseille
Marseille Airbnb Occupancy Rate Trends (2026)
Maximize your bookings by understanding the Marseille STR occupancy trends. Seasonal demand shifts significantly influence how often properties are booked. Typically, Augustsees the highest demand (peak season occupancy), while January experiences the lowest (low season). Effective strategies, like adjusting minimum stays or offering promotions, can boost occupancy during slower periods. Here's how different property tiers perform in Marseille:
- Best-in-class properties (Top 10%) achieve 86%+ occupancy, indicating high desirability and potentially optimized availability.
- Strong performing properties (Top 25%) maintain 73% or higher occupancy, suggesting good market fit and guest satisfaction.
- Typical properties (Median) have an occupancy rate around 50%.
- Entry-level properties (Bottom 25%) average 25% occupancy, potentially facing higher vacancy.
Average Monthly Occupancy Rate Trend in Marseille
Average Daily Rate (ADR) Airbnb Trends in Marseille (2026)
Effective short term rental pricing strategy in Marseille involves understanding monthly ADR fluctuations. The Average Daily Rate (ADR) for Airbnb in Marseille typically peaks in August and dips lowest during February. Leveraging Airbnb dynamic pricing tools or strategies based on this seasonality can significantly boost revenue. Here's a look at the typical nightly rates achieved:
- Best-in-class properties (Top 10%) command rates of $245+ per night, often due to premium features or locations.
- Strong performing properties (Top 25%) achieve nightly rates of $155 or more.
- Typical properties (Median) charge around $108 per night.
- Entry-level properties (Bottom 25%) earn around $81 per night.
Average Daily Rate (ADR) Trend by Month in Marseille
Get Live Marseille Market Intelligence 👇

Explore Real-time Analytics
Airbnb Seasonality Analysis & Trends in Marseille (2026)
Peak Season (August, July, September)
- Revenue averages $2,751 per month
- Occupancy rates average 59.4%
- Daily rates average $150
Shoulder Season
- Revenue averages $1,978 per month
- Occupancy maintains around 50.2%
- Daily rates hold near $140
Low Season (January, February, December)
- Revenue drops to average $1,274 per month
- Occupancy decreases to average 36.1%
- Daily rates adjust to average $138
Seasonality Insights for Marseille
- The Airbnb seasonality in Marseille shows highly seasonal trends requiring careful strategy. While the sections above show seasonal averages, it's also insightful to look at the extremes:
- During the high season, the absolute peak month showcases Marseille's highest earning potential, with monthly revenues capable of climbing to $3,124, occupancy reaching a high of 65.0%, and ADRs peaking at $152.
- Conversely, the slowest single month of the year, typically falling within the low season, marks the market's lowest point. In this month, revenue might dip to $1,142, occupancy could drop to 29.6%, and ADRs may adjust down to $129.
- Understanding both the seasonal averages and these monthly peaks and troughs in revenue, occupancy, and ADR is crucial for maximizing your Airbnb profit potential in Marseille.
Seasonal Strategies for Maximizing Profit
- Peak Season: Maximize revenue through premium pricing and potentially longer minimum stays. Ensure high availability.
- Low Season: Offer competitive pricing, special promotions (e.g., extended stay discounts), and flexible cancellation policies. Target off-season travelers like remote workers or budget-conscious guests.
- Shoulder Seasons: Implement dynamic pricing that balances peak and low rates. Target weekend travelers or specific events. Offer slightly more flexible terms than peak season.
- Regularly analyze your own performance against these Marseille seasonality benchmarks and adjust your pricing and availability strategy accordingly.
Best Areas for Airbnb Investment in Marseille (2026)
Exploring the top neighborhoods for short-term rentals in Marseille? This section highlights key areas, outlining why they are attractive for hosts and guests, along with notable local attractions. Consider these locations based on your target guest profile and investment strategy.
| Neighborhood / Area | Why Host Here? (Target Guests & Appeal) | Key Attractions & Landmarks |
|---|---|---|
| Le Panier | Historic neighborhood known for its charming streets, colorful houses, and artistic vibe. A popular area for tourists seeking to explore local culture and history, with easy access to other attractions. | Old Port of Marseille, Massif des Calanques, La Vieille Charité, Cathédrale de la Major, Mucem |
| Vieux Port | The heart of Marseille, Vieux Port is bustling with activity and offers beautiful waterfront views. It's a must-see for tourists and a great location for Airbnb hosts due to its proximity to restaurants and attractions. | Palais des Congrès, Fort Saint-Nicolas, Fish Market, Boat tours, Restaurants and cafés |
| Cours Julien | Known as the artistic and bohemian district of Marseille, Cours Julien is filled with street art, cafes, and vibrant nightlife. It attracts a younger crowd and those looking for a creative atmosphere. | Street art, Retro shops, Local markets, Cafés and bars, Concert venues |
| La Corniche | A picturesque coastal area that offers stunning views of the Mediterranean Sea. Perfect for those looking for a relaxing beach experience, it is popular with both tourists and locals alike. | Plages du Prophète, Parc Balnéaire du Prado, Routes de la Corniche, Restaurants with sea views, Cap Croisette |
| Saint-Charles | Central location with great transport connections, making it ideal for business travelers and tourists alike. This area is close to the main train station and has a variety of accommodations. | Gare Saint-Charles, Cité des Associations, Public gardens, Nearby restaurants, Shopping |
| Plage des Catalans | A beautiful beach area that is family-friendly and offers a vibrant atmosphere in the summer. It's popular among locals and tourists looking to enjoy sun and sea. | Beach activities, Water sports, Nearby cafés, Beautiful promenade, Events during summer |
| Noailles | An eclectic neighborhood that embodies the multicultural spirit of Marseille. It's known for its markets and diverse food scene, making it attractive for food lovers and tourists. | Marché des Capucins, Street food, Local boutiques, Cultural festivals, Artisan shops |
| Les Terrasses du Port | A modern shopping center with a stunning view of the harbor, ideal for those who enjoy shopping and dining. It's a popular spot for both locals and tourists, especially families. | Shopping mall, Restaurants, Café terraces, Cultural events, Views of the port |
Understanding Airbnb License Requirements & STR Laws in Marseille (2026)
Yes, Marseille, Provence-Alpes-Côte d'Azur, France enforces high STR regulations. Obtaining a license and ensuring compliance is almost certainly required according to current 2026 STR laws. Always verify the latest short term rental regulations and Airbnb license requirements directly with local government authorities for Marseille to ensure full compliance before hosting.
(Source: AirROI data, 2026, based on 80% licensed listings)
Top Performing Airbnb Properties in Marseille (2026)
Benchmark your potential! Explore examples of top-performing Airbnb properties in Marseillebased on Trailing Twelve Month (TTM) revenue. Analyze their characteristics, revenue, occupancy rate, and ADR to understand what drives success in this market.
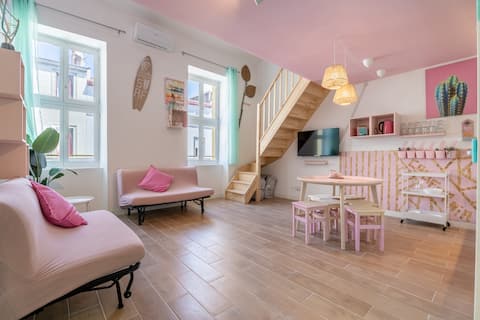
Marseille Loft XXL – Group/Seminar 32 people
Entire Place • 9 bedrooms
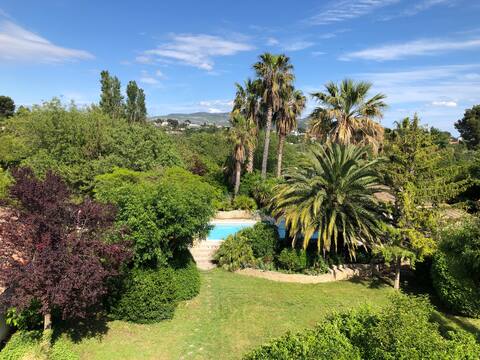
Property with pool, garden and sports field
Entire Place • 9 bedrooms
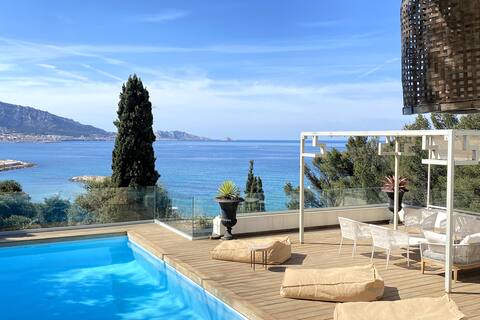
VILLA JFK
Entire Place • 6 bedrooms

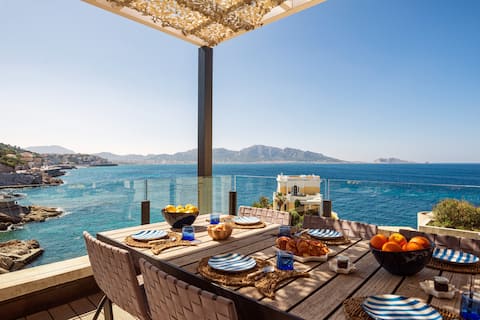
Villa La Corniche
Entire Place • 4 bedrooms
Presqu'île Villa
Entire Place • 5 bedrooms

Villa des Prophètes - Beach Front - Unique View
Entire Place • 5 bedrooms
Note: Performance varies based on location, size, amenities, seasonality, and management quality. Data reflects the past 12 months.
Top Performing Airbnb Hosts in Marseille (2026)
Learn from the best! This table showcases top-performing Airbnb hosts in Marseille based on the number of properties managed and estimated total revenue over the past year. Analyze their scale and performance metrics.
| Host Name | Properties | Grossing Revenue | Stay Reviews | Avg Rating |
|---|---|---|---|---|
| Agence Cocoonr Marseille | 78 | $2,286,533 | 4516 | 4.57/5.0 |
| Julie | 75 | $1,409,713 | 1344 | 4.45/5.0 |
| Jose | 60 | $1,398,545 | 3596 | 4.72/5.0 |
| René | 40 | $1,061,490 | 4062 | 4.74/5.0 |
| Jonatan | 16 | $895,530 | 1623 | 4.58/5.0 |
| Mikaël Baloo | 54 | $855,407 | 2044 | 4.47/5.0 |
| Julie | 19 | $845,676 | 483 | 4.70/5.0 |
| Eléonore | 41 | $829,126 | 1495 | 4.80/5.0 |
| Mimi | 32 | $670,636 | 1683 | 4.74/5.0 |
| Margot FENECH | 28 | $551,557 | 369 | 4.65/5.0 |
Analyzing the strategies of top hosts, such as their property selection, pricing, and guest communication, can offer valuable lessons for optimizing your own Airbnb operations in Marseille.
Dive Deeper: Advanced Marseille STR Market Data (2026)
Ready to unlock more insights? AirROI provides access to advanced metrics and comprehensive Airbnb data for Marseille. Explore detailed analytics beyond this report to refine your investment strategy, optimize pricing, and maximize your vacation rental profits.
Explore Advanced MetricsMarseille Short-Term Rental Market Composition (2026): Property & Room Types
Room Type Distribution
Property Type Distribution
Market Composition Insights for Marseille
- The Marseille Airbnb market composition is heavily skewed towards Entire Home/Apt listings, which make up 88.3% of the 8,797 active rentals. This indicates strong guest preference for privacy and space.
- Looking at the property type distribution in Marseille, Apartment/Condo properties are the most common (80.8%), reflecting the local real estate landscape.
- Smaller segments like hotel/boutique, others, outdoor/unique (combined 4.3%) offer potential for unique stay experiences.
Marseille Airbnb Room Capacity Analysis (2026): Bedroom Distribution
Distribution of Listings by Number of Bedrooms
Room Capacity Insights for Marseille
- The dominant room capacity in Marseille is 1 bedroom listings, making up 44.7% of the market. This suggests a strong demand for properties suitable for couples or solo travelers.
- Together, 1 bedroom and 2 bedrooms properties represent 67.4% of the active Airbnb listings in Marseille, indicating a high concentration in these sizes.
Marseille Vacation Rental Guest Capacity Trends (2026)
Distribution of Listings by Guest Capacity
Guest Capacity Insights for Marseille
- The most common guest capacity trend in Marseille vacation rentals is listings accommodating 4 guests (30.6%). This suggests the primary traveler segment is likely small families or groups.
- Properties designed for 4 guests and 2 guests dominate the Marseille STR market, accounting for 60.8% of listings.
- 17.0% of properties accommodate 6+ guests, serving the market segment for larger families or group travel in Marseille.
- On average, properties in Marseille are equipped to host 3.4 guests.
Marseille Airbnb Booking Patterns (2026): Available vs. Booked Days
Available Days Distribution
Booked Days Distribution
Booking Pattern Insights for Marseille
- The most common availability pattern in Marseille falls within the 271-366 days range, representing 39.3% of listings. This suggests many properties have significant open periods on their calendars.
- Approximately 72.9% of listings show high availability (181+ days open annually), indicating potential for increased bookings or specific owner usage patterns.
- For booked days, the 91-180 days range is most frequent in Marseille (33.9%), reflecting common guest stay durations or potential owner blocking patterns.
- A notable 28.4% of properties secure long booking periods (181+ days booked per year), highlighting successful long-term rental strategies or significant owner usage.
Marseille Airbnb Minimum Stay Requirements Analysis
Distribution of Listings by Minimum Night Requirement
1 Night
1421 listings
16.2% of total
2 Nights
1938 listings
22% of total
3 Nights
714 listings
8.1% of total
4-6 Nights
816 listings
9.3% of total
7-29 Nights
341 listings
3.9% of total
30+ Nights
3567 listings
40.5% of total
Key Insights
- The most prevalent minimum stay requirement in Marseille is 30+ Nights, adopted by 40.5% of listings. This highlights the market's preference for longer commitments.
- A significant segment (40.5%) caters to monthly stays (30+ nights) in Marseille, pointing to opportunities in the extended-stay market.
Recommendations
- Align with the market by considering a 30+ Nights minimum stay, as 40.5% of Marseille hosts use this setting.
- If feasible, allowing 1-night stays, especially midweek or during low season, could capture last-minute bookings, as only 16.2% currently do.
- Explore offering discounts for stays of 30+ nights to attract the 40.5% of the market seeking extended stays.
- Adjust minimum nights based on seasonality – potentially shorter during low season and longer during peak demand periods in Marseille.
Marseille Airbnb Cancellation Policy Trends Analysis (2026)
Non-refundable
3 listings
0% of total
Super Strict 60 Days
9 listings
0.1% of total
Limited
70 listings
0.8% of total
Refundable
1 listings
0% of total
Super Strict 30 Days
13 listings
0.1% of total
Flexible
1852 listings
21.1% of total
Moderate
3370 listings
38.5% of total
Firm
2624 listings
30% of total
Strict
817 listings
9.3% of total
Cancellation Policy Insights for Marseille
- The prevailing Airbnb cancellation policy trend in Marseille is Moderate, used by 38.5% of listings.
- There's a relatively balanced mix between guest-friendly (59.6%) and stricter (39.3%) policies, offering choices for different guest needs.
- Strict cancellation policies are quite rare (9.3%), potentially making listings with this policy less competitive unless justified by high demand or property type.
Recommendations for Hosts
- Consider adopting a Moderate policy to align with the 38.5% market standard in Marseille.
- Using a Strict policy might deter some guests, as only 9.3% of listings use it. Evaluate if potential revenue protection outweighs possible lower booking rates.
- Regularly review your cancellation policy against competitors and market demand shifts in Marseille.
Marseille STR Booking Lead Time Analysis (2026)
Average Booking Lead Time by Month
Booking Lead Time Insights for Marseille
- The overall average booking lead time for vacation rentals in Marseille is 43 days.
- Guests book furthest in advance for stays during May (average 62 days), likely coinciding with peak travel demand or local events.
- The shortest booking windows occur for stays in February (average 24 days), indicating more last-minute travel plans during this time.
- Seasonally, Summer (52 days avg.) sees the longest lead times, while Winter (29 days avg.) has the shortest, reflecting typical travel planning cycles.
Recommendations for Hosts
- Use the overall average lead time (43 days) as a baseline for your pricing and availability strategy in Marseille.
- For May stays, consider implementing length-of-stay discounts or slightly higher rates for bookings made less than 62 days out to capitalize on advance planning.
- Target marketing efforts for the Summer season well in advance (at least 52 days) to capture early planners.
- Monitor your own booking lead times against these Marseille averages to identify opportunities for dynamic pricing adjustments.
Popular & Essential Airbnb Amenities in Marseille (2026)
Amenity Prevalence
Amenity Insights for Marseille
- Popular amenities like Kitchen, Wifi, Heating are common but not universal. Offering these can provide a competitive edge.
- Warning: Wifi is not universally provided but is considered essential globally. Ensure reliable Wifi is offered.
Recommendations for Hosts
- Consider adding popular differentiators like Kitchen or Wifi to increase appeal.
- Highlight unique or less common amenities you offer (e.g., hot tub, dedicated workspace, EV charger) in your listing description and photos.
- Regularly check competitor amenities in Marseille to stay competitive.
Marseille Airbnb Guest Demographics & Profile Analysis (2026)
Guest Profile Summary for Marseille
- The typical guest profile for Airbnb in Marseille consists of a mix of domestic (64%) and international guests, often arriving from nearby Paris, typically belonging to the Post-2000s (Gen Z/Alpha) group (50%), primarily speaking English or French.
- Domestic travelers account for 63.9% of guests.
- Key international markets include France (63.9%) and United Kingdom (6%).
- Top languages spoken are English (35.9%) followed by French (33.3%).
- A significant demographic segment is the Post-2000s (Gen Z/Alpha) group, representing 50% of guests.
Recommendations for Hosts
- Target domestic marketing efforts towards travelers from Paris and Lyon.
- Tailor amenities and listing descriptions to appeal to the dominant Post-2000s (Gen Z/Alpha) demographic (e.g., highlight fast WiFi, smart home features, local guides).
- Highlight unique local experiences or amenities relevant to the primary guest profile.
- Consider seasonal promotions aligned with peak travel times for key origin markets.
Nearby Short-Term Rental Market Comparison
How does the Marseille Airbnb market stack up against its neighbors? Compare key performance metrics like average monthly revenue, ADR, and occupancy rates in surrounding areas to understand the broader regional STR landscape.
| Market | Active Properties | Monthly Revenue | Daily Rate | Avg. Occupancy |
|---|---|---|---|---|
| Ramatuelle | 231 | $4,086 | $662.31 | 40% |
| Saint-Tropez | 847 | $3,591 | $514.76 | 39% |
| Cavillargues | 12 | $3,274 | $342.99 | 43% |
| Eygalières | 82 | $3,206 | $417.97 | 39% |
| Puget | 30 | $3,152 | $362.65 | 41% |
| Gordes | 251 | $3,129 | $406.17 | 41% |
| Opio | 41 | $3,101 | $542.89 | 41% |
| Divajeu | 20 | $3,061 | $421.97 | 32% |
| Goult | 88 | $2,994 | $342.26 | 44% |
| Suzette | 12 | $2,973 | $415.98 | 37% |