Montesson Airbnb Market Analysis 2025: Short Term Rental Data & Vacation Rental Statistics in Ile-de-France, France
Is Airbnb profitable in Montesson in 2025? Explore comprehensive Airbnb analytics for Montesson, Ile-de-France, France to uncover income potential. This 2025 STR market report for Montesson, based on AirROI data from June 2024 to May 2025, reveals key trends in the niche market of 22 active listings.
Whether you're considering an Airbnb investment in Montesson, optimizing your existing vacation rental, or exploring rental arbitrage opportunities, understanding the Montesson Airbnb data is crucial. Leveraging the low regulation environment is key to maximizing your short term rental income potential. Let's dive into the specifics.
Key Montesson Airbnb Performance Metrics Overview
Monthly Airbnb Revenue Variations & Income Potential in Montesson (2025)
Understanding the monthly revenue variations for Airbnb listings in Montesson is key to maximizing your short term rental income potential. Seasonality significantly impacts earnings. Our analysis, based on data from the past 12 months, shows that the peak revenue month for STRs in Montesson is typically July, while June often presents the lowest earnings, highlighting opportunities for strategic pricing adjustments during shoulder and low seasons. Explore the typical Airbnb income in Montesson across different performance tiers:
- Best-in-class properties (Top 10%) achieve $3,685+ monthly, often utilizing dynamic pricing and superior guest experiences.
- Strong performing properties (Top 25%) earn $2,308 or more, indicating effective management and desirable locations/amenities.
- Typical properties (Median) generate around $958 per month, representing the average market performance.
- Entry-level properties (Bottom 25%) see earnings around $456, often with potential for optimization.
Average Monthly Airbnb Earnings Trend in Montesson
Montesson Airbnb Occupancy Rate Trends (2025)
Maximize your bookings by understanding the Montesson STR occupancy trends. Seasonal demand shifts significantly influence how often properties are booked. Typically, Marchsees the highest demand (peak season occupancy), while November experiences the lowest (low season). Effective strategies, like adjusting minimum stays or offering promotions, can boost occupancy during slower periods. Here's how different property tiers perform in Montesson:
- Best-in-class properties (Top 10%) achieve 74%+ occupancy, indicating high desirability and potentially optimized availability.
- Strong performing properties (Top 25%) maintain 42% or higher occupancy, suggesting good market fit and guest satisfaction.
- Typical properties (Median) have an occupancy rate around 25%.
- Entry-level properties (Bottom 25%) average 16% occupancy, potentially facing higher vacancy.
Average Monthly Occupancy Rate Trend in Montesson
Average Daily Rate (ADR) Airbnb Trends in Montesson (2025)
Effective short term rental pricing strategy in Montesson involves understanding monthly ADR fluctuations. The Average Daily Rate (ADR) for Airbnb in Montesson typically peaks in August and dips lowest during November. Leveraging Airbnb dynamic pricing tools or strategies based on this seasonality can significantly boost revenue. Here's a look at the typical nightly rates achieved:
- Best-in-class properties (Top 10%) command rates of $358+ per night, often due to premium features or locations.
- Strong performing properties (Top 25%) achieve nightly rates of $206 or more.
- Typical properties (Median) charge around $110 per night.
- Entry-level properties (Bottom 25%) earn around $67 per night.
Average Daily Rate (ADR) Trend by Month in Montesson
Get Live Montesson Market Intelligence 👇

Explore Real-time Analytics
Airbnb Seasonality Analysis & Trends in Montesson (2025)
Peak Season (July, October, August)
- Revenue averages $2,243 per month
- Occupancy rates average 34.0%
- Daily rates average $169
Shoulder Season
- Revenue averages $1,711 per month
- Occupancy maintains around 35.5%
- Daily rates hold near $165
Low Season (April, June, November)
- Revenue drops to average $1,201 per month
- Occupancy decreases to average 30.3%
- Daily rates adjust to average $162
Seasonality Insights for Montesson
- The Airbnb seasonality in Montesson shows highly seasonal trends requiring careful strategy. While the sections above show seasonal averages, it's also insightful to look at the extremes:
- During the high season, the absolute peak month showcases Montesson's highest earning potential, with monthly revenues capable of climbing to $2,414, occupancy reaching a high of 46.5%, and ADRs peaking at $176.
- Conversely, the slowest single month of the year, typically falling within the low season, marks the market's lowest point. In this month, revenue might dip to $670, occupancy could drop to 24.9%, and ADRs may adjust down to $151.
- Understanding both the seasonal averages and these monthly peaks and troughs in revenue, occupancy, and ADR is crucial for maximizing your Airbnb profit potential in Montesson.
Seasonal Strategies for Maximizing Profit
- Peak Season: Maximize revenue through premium pricing and potentially longer minimum stays. Ensure high availability.
- Low Season: Offer competitive pricing, special promotions (e.g., extended stay discounts), and flexible cancellation policies. Target off-season travelers like remote workers or budget-conscious guests.
- Shoulder Seasons: Implement dynamic pricing that balances peak and low rates. Target weekend travelers or specific events. Offer slightly more flexible terms than peak season.
- Regularly analyze your own performance against these Montesson seasonality benchmarks and adjust your pricing and availability strategy accordingly.
Best Areas for Airbnb Investment in Montesson (2025)
Exploring the top neighborhoods for short-term rentals in Montesson? This section highlights key areas, outlining why they are attractive for hosts and guests, along with notable local attractions. Consider these locations based on your target guest profile and investment strategy.
| Neighborhood / Area | Why Host Here? (Target Guests & Appeal) | Key Attractions & Landmarks |
|---|---|---|
| Montesson Center | Located close to the Seine, Montesson Center offers a charming village atmosphere with easy access to local shops and restaurants. Ideal for guests looking for a peaceful retreat close to Paris. | Parc de la Mairie, Église Saint-Germain, Seine River Promenade, Local Markets, Montesson Park |
| La Garenne | This residential area is known for its tranquil environment and green spaces, offering a family-friendly atmosphere. It's an excellent choice for families visiting Paris. | Parc de la Garenne, Local Playgrounds, Walking Paths, Nearby Cafés, Community Events |
| Le Petit Montesson | A quaint neighborhood with a small-town feel, Le Petit Montesson is perfect for travelers wanting to explore the culture and lifestyle of suburban France, with quick transit to central Paris. | Local Artisan Shops, Cultural Festivals, Family-owned Restaurants, Shaded Walking Lanes, Local Art Installations |
| Château de Maisons-Laffitte | Just a short distance from Montesson, this area features the stunning Maisons-Laffitte Castle and its beautiful park. Attracts guests interested in history and nature. | Maisons-Laffitte Castle, Castle Park, Historic Environments, Equestrian Events, River Seine Views |
| Equestrian Facilities | Renowned for its proximity to top equestrian facilities, this area caters to horse enthusiasts and provides a unique experience for guests wanting to learn about French equestrian culture. | Horse Riding Schools, Equestrian Competitions, Local Tack Shops, Scenic Riding Trails, Equestrian Festivals |
| Seine River | The Seine River offers picturesque views and relaxing spaces for walks or picnics. A perfect escape for couples and families wanting to indulge in beautiful landscapes near Montesson. | Scenic Picnicking Spots, Biking Trails, Fishing Areas, Nature Observation, Canoeing |
| Local Vineyards | Montesson is near vineyards that produce local wines, attracting wine enthusiasts looking for tastings and vineyard tours, while enjoying the serene countryside environment. | Wine Tasting Tours, Vineyard Walks, Local Wine Shops, Gastronomic Experiences, Seasonal Festivals |
| Rueil-Malmaison | A nearby town with historical significance, Rueil-Malmaison offers various attractions related to the Napoleonic era. It's a fascinating area for tourists interested in French history. | Château de Malmaison, Napoleon Museum, Historic Walking Tours, Diverse Cafés, Cultural Events |
Understanding Airbnb License Requirements & STR Laws in Montesson (2025)
While Montesson, Ile-de-France, France currently shows low STR regulations, specific Airbnb license requirements might still exist or change. Always verify the latest short term rental regulations and Airbnb license requirements directly with local government authorities for Montesson to ensure full compliance before hosting.
(Source: AirROI data, 2025, based on 5% licensed listings)
Top Performing Airbnb Properties in Montesson (2025)
Benchmark your potential! Explore examples of top-performing Airbnb properties in Montessonbased on Trailing Twelve Month (TTM) revenue. Analyze their characteristics, revenue, occupancy rate, and ADR to understand what drives success in this market.
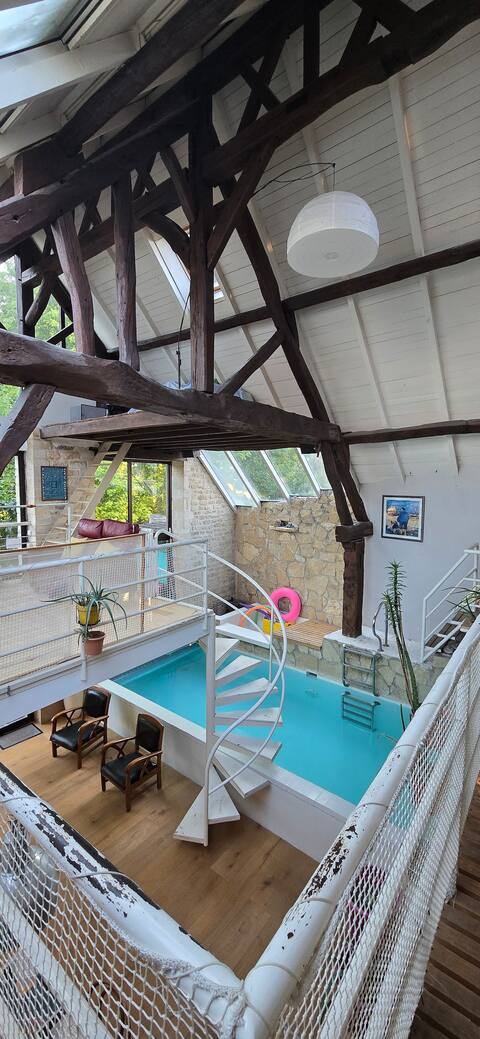
Architect house near Paris indoor pool
Entire Place • 5 bedrooms

Villa des Quai de Seine et Jacuzzi Prox Paris
Entire Place • 4 bedrooms

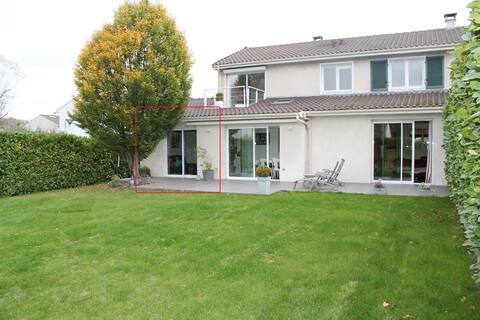
Chic & Spacious Villa near Paris
Entire Place • 6 bedrooms
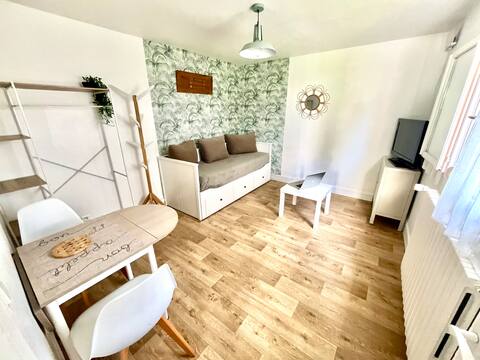
Calme et verdure à 12 km de PARIS
Entire Place • 2 bedrooms
Quiet, private, independent room
Private Room • 1 bedroom
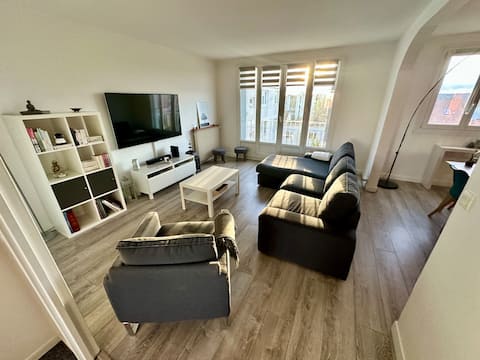
Cozy apartment near RER IN Paris
Entire Place • N/A
Note: Performance varies based on location, size, amenities, seasonality, and management quality. Data reflects the past 12 months.
Top Performing Airbnb Hosts in Montesson (2025)
Learn from the best! This table showcases top-performing Airbnb hosts in Montesson based on the number of properties managed and estimated total revenue over the past year. Analyze their scale and performance metrics.
| Host Name | Properties | Grossing Revenue | Stay Reviews | Avg Rating |
|---|---|---|---|---|
| Manalie | 1 | $55,457 | 5 | 5.00/5.0 |
| Maxime | 1 | $35,723 | 8 | 4.88/5.0 |
| Paul-Henry | 1 | $35,628 | 24 | 4.96/5.0 |
| Host #53372230 | 1 | $28,718 | 0 | N/A/5.0 |
| Sylvie Et Didier | 2 | $21,197 | 0 | N/A/5.0 |
| Julie Et Cédric | 1 | $12,690 | 25 | 5.00/5.0 |
| Teresa | 1 | $12,056 | 159 | 4.69/5.0 |
| Antonio | 2 | $8,489 | 28 | 4.60/5.0 |
| Host #12308741 | 1 | $8,244 | 0 | N/A/5.0 |
| Anne Sophie | 1 | $6,287 | 0 | N/A/5.0 |
Analyzing the strategies of top hosts, such as their property selection, pricing, and guest communication, can offer valuable lessons for optimizing your own Airbnb operations in Montesson.
Dive Deeper: Advanced Montesson STR Market Data (2025)
Ready to unlock more insights? AirROI provides access to advanced metrics and comprehensive Airbnb data for Montesson. Explore detailed analytics beyond this report to refine your investment strategy, optimize pricing, and maximize your vacation rental profits.
Explore Advanced MetricsMontesson Short-Term Rental Market Composition (2025): Property & Room Types
Room Type Distribution
Property Type Distribution
Market Composition Insights for Montesson
- The Montesson Airbnb market composition is heavily skewed towards Entire Home/Apt listings, which make up 63.6% of the 22 active rentals. This indicates strong guest preference for privacy and space.
- However, a notable 36.4% share for Private Rooms suggests opportunities for budget-conscious travelers or hosts renting out spare rooms.
- Looking at the property type distribution in Montesson, Apartment/Condo properties are the most common (40.9%), reflecting the local real estate landscape.
- Houses represent a significant 36.4% portion, catering likely to families or larger groups.
- The presence of 18.2% Hotel/Boutique listings indicates integration with traditional hospitality.
- Smaller segments like others (combined 4.5%) offer potential for unique stay experiences.
Montesson Airbnb Room Capacity Analysis (2025): Bedroom Distribution
Distribution of Listings by Number of Bedrooms
Room Capacity Insights for Montesson
- The dominant room capacity in Montesson is 1 bedroom listings, making up 36.4% of the market. This suggests a strong demand for properties suitable for couples or solo travelers.
- Together, 1 bedroom and 2 bedrooms properties represent 54.6% of the active Airbnb listings in Montesson, indicating a high concentration in these sizes.
- A significant 22.6% of listings offer 3+ bedrooms, catering to larger groups and families seeking more space in Montesson.
Montesson Vacation Rental Guest Capacity Trends (2025)
Distribution of Listings by Guest Capacity
Guest Capacity Insights for Montesson
- The most common guest capacity trend in Montesson vacation rentals is listings accommodating 4 guests (27.3%). This suggests the primary traveler segment is likely small families or groups.
- Properties designed for 4 guests and 2 guests dominate the Montesson STR market, accounting for 54.6% of listings.
- 22.7% of properties accommodate 6+ guests, serving the market segment for larger families or group travel in Montesson.
- On average, properties in Montesson are equipped to host 3.5 guests.
Montesson Airbnb Booking Patterns (2025): Available vs. Booked Days
Available Days Distribution
Booked Days Distribution
Booking Pattern Insights for Montesson
- The most common availability pattern in Montesson falls within the 271-366 days range, representing 77.3% of listings. This suggests many properties have significant open periods on their calendars.
- Approximately 86.4% of listings show high availability (181+ days open annually), indicating potential for increased bookings or specific owner usage patterns.
- For booked days, the 1-30 days range is most frequent in Montesson (45.5%), reflecting common guest stay durations or potential owner blocking patterns.
- A notable 13.6% of properties secure long booking periods (181+ days booked per year), highlighting successful long-term rental strategies or significant owner usage.
Montesson Airbnb Minimum Stay Requirements Analysis
Distribution of Listings by Minimum Night Requirement
1 Night
7 listings
36.8% of total
2 Nights
6 listings
31.6% of total
4-6 Nights
2 listings
10.5% of total
7-29 Nights
1 listings
5.3% of total
30+ Nights
3 listings
15.8% of total
Key Insights
- The most prevalent minimum stay requirement in Montesson is 1 Night, adopted by 36.8% of listings. This highlights the market's preference for shorter, flexible bookings.
- A strong majority (68.4%) of the Montesson Airbnb data shows acceptance of very short stays (1-2 nights), indicating a dynamic, high-turnover market.
- A significant segment (15.8%) caters to monthly stays (30+ nights) in Montesson, pointing to opportunities in the extended-stay market.
Recommendations
- Align with the market by considering a 1 Night minimum stay, as 36.8% of Montesson hosts use this setting.
- Explore offering discounts for stays of 30+ nights to attract the 15.8% of the market seeking extended stays.
- Adjust minimum nights based on seasonality – potentially shorter during low season and longer during peak demand periods in Montesson.
Montesson Airbnb Cancellation Policy Trends Analysis (2025)
Flexible
5 listings
38.5% of total
Moderate
5 listings
38.5% of total
Firm
2 listings
15.4% of total
Strict
1 listings
7.7% of total
Cancellation Policy Insights for Montesson
- The prevailing Airbnb cancellation policy trend in Montesson is Flexible, used by 38.5% of listings.
- The market strongly favors guest-friendly terms, with 77.0% of listings offering Flexible or Moderate policies. This suggests guests in Montesson may expect booking flexibility.
- Strict cancellation policies are quite rare (7.7%), potentially making listings with this policy less competitive unless justified by high demand or property type.
Recommendations for Hosts
- Consider adopting a Flexible policy to align with the 38.5% market standard in Montesson.
- Using a Strict policy might deter some guests, as only 7.7% of listings use it. Evaluate if potential revenue protection outweighs possible lower booking rates.
- Regularly review your cancellation policy against competitors and market demand shifts in Montesson.
Montesson STR Booking Lead Time Analysis (2025)
Average Booking Lead Time by Month
Booking Lead Time Insights for Montesson
- The overall average booking lead time for vacation rentals in Montesson is 26 days.
- Guests book furthest in advance for stays during November (average 44 days), likely coinciding with peak travel demand or local events.
- The shortest booking windows occur for stays in March (average 10 days), indicating more last-minute travel plans during this time.
- Seasonally, Fall (37 days avg.) sees the longest lead times, while Summer (20 days avg.) has the shortest, reflecting typical travel planning cycles.
Recommendations for Hosts
- Use the overall average lead time (26 days) as a baseline for your pricing and availability strategy in Montesson.
- For November stays, consider implementing length-of-stay discounts or slightly higher rates for bookings made less than 44 days out to capitalize on advance planning.
- During March, focus on last-minute booking availability and promotions, as guests book with very short notice (10 days avg.).
- Target marketing efforts for the Fall season well in advance (at least 37 days) to capture early planners.
- Monitor your own booking lead times against these Montesson averages to identify opportunities for dynamic pricing adjustments.
Popular & Essential Airbnb Amenities in Montesson (2025)
Amenity Prevalence
Amenity Insights for Montesson
- Essential amenities in Montesson that guests expect include: Wifi. Lacking these (this) could significantly impact bookings.
- Popular amenities like Hot water, Heating, TV are common but not universal. Offering these can provide a competitive edge.
Recommendations for Hosts
- Ensure your listing includes all essential amenities for Montesson: Wifi.
- Consider adding popular differentiators like Hot water or Heating to increase appeal.
- Highlight unique or less common amenities you offer (e.g., hot tub, dedicated workspace, EV charger) in your listing description and photos.
- Regularly check competitor amenities in Montesson to stay competitive.
Montesson Airbnb Guest Demographics & Profile Analysis (2025)
Guest Profile Summary for Montesson
- The typical guest profile for Airbnb in Montesson consists of primarily domestic travelers (78%), often arriving from nearby Paris, typically belonging to the Post-2000s (Gen Z/Alpha) group (50%), primarily speaking French or English.
- Domestic travelers account for 77.6% of guests.
- Key international markets include France (77.6%) and United Kingdom (7.1%).
- Top languages spoken are French (41.8%) followed by English (31.6%).
- A significant demographic segment is the Post-2000s (Gen Z/Alpha) group, representing 50% of guests.
Recommendations for Hosts
- Target domestic marketing efforts towards travelers from Paris and Sartrouville.
- Tailor amenities and listing descriptions to appeal to the dominant Post-2000s (Gen Z/Alpha) demographic (e.g., highlight fast WiFi, smart home features, local guides).
- Highlight unique local experiences or amenities relevant to the primary guest profile.
- Consider seasonal promotions aligned with peak travel times for key origin markets.
Nearby Short-Term Rental Market Comparison
How does the Montesson Airbnb market stack up against its neighbors? Compare key performance metrics like average monthly revenue, ADR, and occupancy rates in surrounding areas to understand the broader regional STR landscape.
| Market | Active Properties | Monthly Revenue | Daily Rate | Avg. Occupancy |
|---|---|---|---|---|
| Morienval | 12 | $4,731 | $382.71 | 28% |
| La Couture-Boussey | 12 | $3,657 | $397.36 | 30% |
| Millançay | 11 | $3,313 | $364.98 | 36% |
| Rosoy-en-Multien | 17 | $3,290 | $340.82 | 48% |
| Unverre | 10 | $3,057 | $306.53 | 35% |
| Verdelot | 14 | $2,890 | $295.37 | 43% |
| Gommecourt | 10 | $2,873 | $266.55 | 42% |
| Trigny | 10 | $2,842 | $251.98 | 43% |
| Langon-sur-Cher | 12 | $2,826 | $416.07 | 33% |
| Achères-la-Forêt | 40 | $2,773 | $281.99 | 44% |