Saint-Léger-aux-Bois Airbnb Market Analysis 2025: Short Term Rental Data & Vacation Rental Statistics in Hauts-de-France, France
Is Airbnb profitable in Saint-Léger-aux-Bois in 2025? Explore comprehensive Airbnb analytics for Saint-Léger-aux-Bois, Hauts-de-France, France to uncover income potential. This 2025 STR market report for Saint-Léger-aux-Bois, based on AirROI data from June 2024 to May 2025, reveals key trends in the niche market of 27 active listings.
Whether you're considering an Airbnb investment in Saint-Léger-aux-Bois, optimizing your existing vacation rental, or exploring rental arbitrage opportunities, understanding the Saint-Léger-aux-Bois Airbnb data is crucial. Leveraging the low regulation environment is key to maximizing your short term rental income potential. Let's dive into the specifics.
Key Saint-Léger-aux-Bois Airbnb Performance Metrics Overview
Monthly Airbnb Revenue Variations & Income Potential in Saint-Léger-aux-Bois (2025)
Understanding the monthly revenue variations for Airbnb listings in Saint-Léger-aux-Bois is key to maximizing your short term rental income potential. Seasonality significantly impacts earnings. Our analysis, based on data from the past 12 months, shows that the peak revenue month for STRs in Saint-Léger-aux-Bois is typically May, while June often presents the lowest earnings, highlighting opportunities for strategic pricing adjustments during shoulder and low seasons. Explore the typical Airbnb income in Saint-Léger-aux-Bois across different performance tiers:
- Best-in-class properties (Top 10%) achieve $5,118+ monthly, often utilizing dynamic pricing and superior guest experiences.
- Strong performing properties (Top 25%) earn $2,649 or more, indicating effective management and desirable locations/amenities.
- Typical properties (Median) generate around $1,271 per month, representing the average market performance.
- Entry-level properties (Bottom 25%) see earnings around $825, often with potential for optimization.
Average Monthly Airbnb Earnings Trend in Saint-Léger-aux-Bois
Saint-Léger-aux-Bois Airbnb Occupancy Rate Trends (2025)
Maximize your bookings by understanding the Saint-Léger-aux-Bois STR occupancy trends. Seasonal demand shifts significantly influence how often properties are booked. Typically, Decembersees the highest demand (peak season occupancy), while June experiences the lowest (low season). Effective strategies, like adjusting minimum stays or offering promotions, can boost occupancy during slower periods. Here's how different property tiers perform in Saint-Léger-aux-Bois:
- Best-in-class properties (Top 10%) achieve 59%+ occupancy, indicating high desirability and potentially optimized availability.
- Strong performing properties (Top 25%) maintain 45% or higher occupancy, suggesting good market fit and guest satisfaction.
- Typical properties (Median) have an occupancy rate around 27%.
- Entry-level properties (Bottom 25%) average 19% occupancy, potentially facing higher vacancy.
Average Monthly Occupancy Rate Trend in Saint-Léger-aux-Bois
Average Daily Rate (ADR) Airbnb Trends in Saint-Léger-aux-Bois (2025)
Effective short term rental pricing strategy in Saint-Léger-aux-Bois involves understanding monthly ADR fluctuations. The Average Daily Rate (ADR) for Airbnb in Saint-Léger-aux-Bois typically peaks in May and dips lowest during December. Leveraging Airbnb dynamic pricing tools or strategies based on this seasonality can significantly boost revenue. Here's a look at the typical nightly rates achieved:
- Best-in-class properties (Top 10%) command rates of $401+ per night, often due to premium features or locations.
- Strong performing properties (Top 25%) achieve nightly rates of $377 or more.
- Typical properties (Median) charge around $367 per night.
- Entry-level properties (Bottom 25%) earn around $281 per night.
Average Daily Rate (ADR) Trend by Month in Saint-Léger-aux-Bois
Get Live Saint-Léger-aux-Bois Market Intelligence 👇

Explore Real-time Analytics
Airbnb Seasonality Analysis & Trends in Saint-Léger-aux-Bois (2025)
Peak Season (May, July, February)
- Revenue averages $3,291 per month
- Occupancy rates average 33.8%
- Daily rates average $321
Shoulder Season
- Revenue averages $2,203 per month
- Occupancy maintains around 32.0%
- Daily rates hold near $313
Low Season (June, September, December)
- Revenue drops to average $704 per month
- Occupancy decreases to average 38.3%
- Daily rates adjust to average $299
Seasonality Insights for Saint-Léger-aux-Bois
- The Airbnb seasonality in Saint-Léger-aux-Bois shows highly seasonal trends requiring careful strategy. While the sections above show seasonal averages, it's also insightful to look at the extremes:
- During the high season, the absolute peak month showcases Saint-Léger-aux-Bois's highest earning potential, with monthly revenues capable of climbing to $3,566, occupancy reaching a high of 71.0%, and ADRs peaking at $331.
- Conversely, the slowest single month of the year, typically falling within the low season, marks the market's lowest point. In this month, revenue might dip to $185, occupancy could drop to 18.3%, and ADRs may adjust down to $297.
- Understanding both the seasonal averages and these monthly peaks and troughs in revenue, occupancy, and ADR is crucial for maximizing your Airbnb profit potential in Saint-Léger-aux-Bois.
Seasonal Strategies for Maximizing Profit
- Peak Season: Maximize revenue through premium pricing and potentially longer minimum stays. Ensure high availability.
- Low Season: Offer competitive pricing, special promotions (e.g., extended stay discounts), and flexible cancellation policies. Target off-season travelers like remote workers or budget-conscious guests.
- Shoulder Seasons: Implement dynamic pricing that balances peak and low rates. Target weekend travelers or specific events. Offer slightly more flexible terms than peak season.
- Regularly analyze your own performance against these Saint-Léger-aux-Bois seasonality benchmarks and adjust your pricing and availability strategy accordingly.
Best Areas for Airbnb Investment in Saint-Léger-aux-Bois (2025)
Exploring the top neighborhoods for short-term rentals in Saint-Léger-aux-Bois? This section highlights key areas, outlining why they are attractive for hosts and guests, along with notable local attractions. Consider these locations based on your target guest profile and investment strategy.
| Neighborhood / Area | Why Host Here? (Target Guests & Appeal) | Key Attractions & Landmarks |
|---|---|---|
| Saint-Léger-aux-Bois Centre | The heart of the village, offering access to local shops and restaurants. Great for travelers looking for an authentic rural French experience. | Local bakery, Saint-Léger Church, Nearby hiking trails |
| Parc Naturel Régional de l'Avesnois | A stunning natural park nearby, perfect for nature lovers and outdoor activities. Ideal for hosts looking to attract eco-tourists. | Hiking trails, Cycling routes, Wildlife watching, Picnic areas |
| Nearby historical sites | Proximity to historical sites makes it attractive for culture enthusiasts and history buffs. | Château de Guise, Museums, Historical squares |
| Campsites and outdoor lodges | The area offers numerous campsites and lodges, appealing to families and groups looking for outdoor experiences. | Camping facilities, Fishing spots, Natural swimming areas |
| Rural retreats | Perfect for city dwellers seeking a peaceful escape in the countryside, ideal for wellness retreats. | Spa hotels, Yoga retreats, Countryside walks |
| Local vineyards and farms | Connects guests with local agriculture, great for wine tourists and culinary experiences. | Wine tastings, Farm tours, Local markets |
| Arts and crafts villages | Attracts visitors interested in local art and culture, supporting local artists and craftspeople. | Artisan shops, Craft fairs, Local art exhibitions |
| Family-friendly attractions | Many family-oriented activities available, making it an attractive option for families traveling together. | Playgrounds, Animal farms, Carousels |
Understanding Airbnb License Requirements & STR Laws in Saint-Léger-aux-Bois (2025)
While Saint-Léger-aux-Bois, Hauts-de-France, France currently shows low STR regulations, specific Airbnb license requirements might still exist or change. Always verify the latest short term rental regulations and Airbnb license requirements directly with local government authorities for Saint-Léger-aux-Bois to ensure full compliance before hosting.
(Source: AirROI data, 2025, finding no licensed listings among those analyzed)
Top Performing Airbnb Properties in Saint-Léger-aux-Bois (2025)
Benchmark your potential! Explore examples of top-performing Airbnb properties in Saint-Léger-aux-Boisbased on Trailing Twelve Month (TTM) revenue. Analyze their characteristics, revenue, occupancy rate, and ADR to understand what drives success in this market.
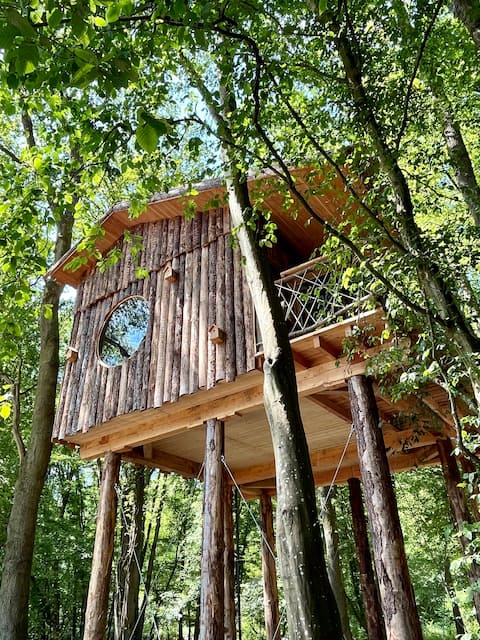
Cabane Perchée Spa Nid des Bois
Entire Place • 1 bedroom
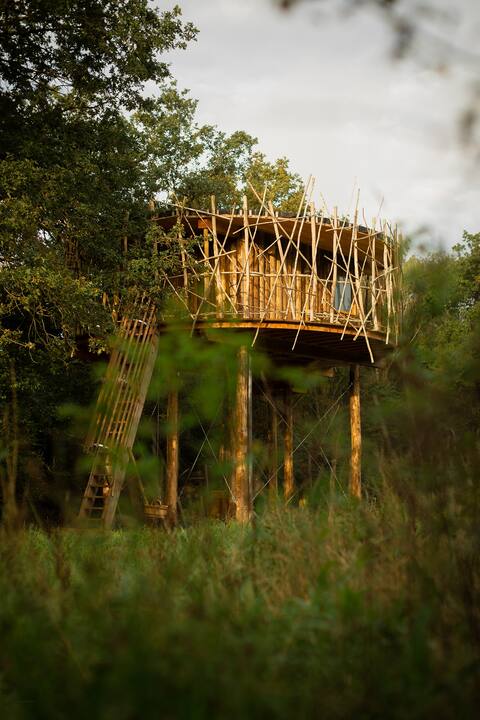
Cabane perchée Spa Havre de Paix
Entire Place • 1 bedroom
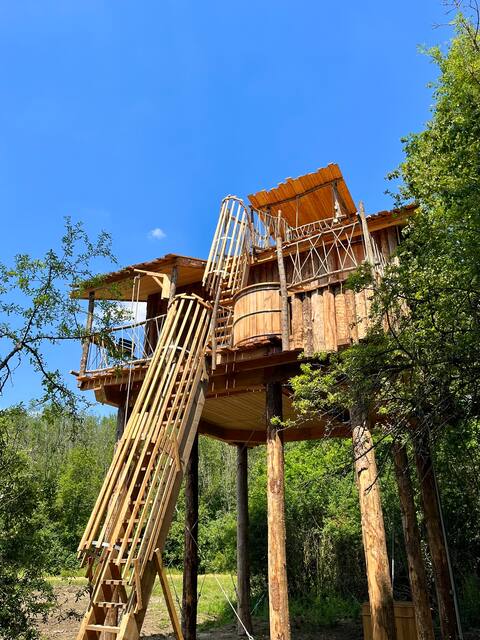
Cabane Spa Repaire du Trappeur
Entire Place • 1 bedroom
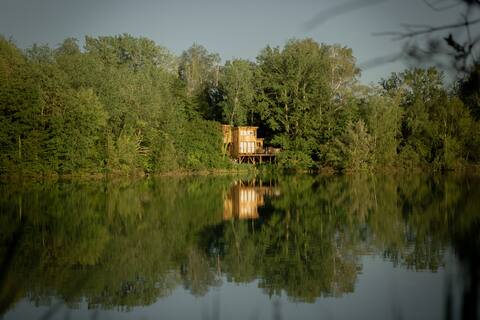
Cabane Spa Attrape Rêves - Coucoo La Réserve
Entire Place • 1 bedroom
Cabane Reflets Bleus - Coucoo La Réserve
Entire Place • 1 bedroom
Cabane Perchée Spa Haut Perchoir
Entire Place • 1 bedroom
Note: Performance varies based on location, size, amenities, seasonality, and management quality. Data reflects the past 12 months.
Top Performing Airbnb Hosts in Saint-Léger-aux-Bois (2025)
Learn from the best! This table showcases top-performing Airbnb hosts in Saint-Léger-aux-Bois based on the number of properties managed and estimated total revenue over the past year. Analyze their scale and performance metrics.
| Host Name | Properties | Grossing Revenue | Stay Reviews | Avg Rating |
|---|---|---|---|---|
| Emmanuel | 24 | $387,338 | 6 | N/A/5.0 |
| Monique | 3 | $10,169 | 29 | 4.54/5.0 |
Analyzing the strategies of top hosts, such as their property selection, pricing, and guest communication, can offer valuable lessons for optimizing your own Airbnb operations in Saint-Léger-aux-Bois.
Dive Deeper: Advanced Saint-Léger-aux-Bois STR Market Data (2025)
Ready to unlock more insights? AirROI provides access to advanced metrics and comprehensive Airbnb data for Saint-Léger-aux-Bois. Explore detailed analytics beyond this report to refine your investment strategy, optimize pricing, and maximize your vacation rental profits.
Explore Advanced MetricsSaint-Léger-aux-Bois Short-Term Rental Market Composition (2025): Property & Room Types
Room Type Distribution
Property Type Distribution
Market Composition Insights for Saint-Léger-aux-Bois
- The Saint-Léger-aux-Bois Airbnb market composition is heavily skewed towards Entire Home/Apt listings, which make up 88.9% of the 27 active rentals. This indicates strong guest preference for privacy and space.
- Looking at the property type distribution in Saint-Léger-aux-Bois, Unique Stays properties are the most common (85.2%), reflecting the local real estate landscape.
- Smaller segments like outdoor/unique (combined 3.7%) offer potential for unique stay experiences.
Saint-Léger-aux-Bois Airbnb Room Capacity Analysis (2025): Bedroom Distribution
Distribution of Listings by Number of Bedrooms
Room Capacity Insights for Saint-Léger-aux-Bois
- The dominant room capacity in Saint-Léger-aux-Bois is 1 bedroom listings, making up 77.8% of the market. This suggests a strong demand for properties suitable for couples or solo travelers.
- Together, 1 bedroom and 2 bedrooms properties represent 85.2% of the active Airbnb listings in Saint-Léger-aux-Bois, indicating a high concentration in these sizes.
- With over half the market (77.8%) consisting of studios or 1-bedroom units, Saint-Léger-aux-Bois is particularly well-suited for individuals or couples.
- Listings with 3+ bedrooms (3.7%) represent a smaller niche, potentially indicating an underserved market for larger group accommodations in Saint-Léger-aux-Bois.
Saint-Léger-aux-Bois Vacation Rental Guest Capacity Trends (2025)
Distribution of Listings by Guest Capacity
Guest Capacity Insights for Saint-Léger-aux-Bois
- The most common guest capacity trend in Saint-Léger-aux-Bois vacation rentals is listings accommodating 2 guests (63%). This suggests the primary traveler segment is likely couples or solo travelers.
- Properties designed for 2 guests and 4 guests dominate the Saint-Léger-aux-Bois STR market, accounting for 74.1% of listings.
- A significant 63.0% of listings cater specifically to 1-2 guests, highlighting strong demand from couples and solo travelers in Saint-Léger-aux-Bois.
- Listings for large groups (6+ guests) are relatively rare (3.7%), potentially indicating an opportunity for hosts targeting this segment in Saint-Léger-aux-Bois.
- On average, properties in Saint-Léger-aux-Bois are equipped to host 2.5 guests.
Saint-Léger-aux-Bois Airbnb Booking Patterns (2025): Available vs. Booked Days
Available Days Distribution
Booked Days Distribution
Booking Pattern Insights for Saint-Léger-aux-Bois
- The most common availability pattern in Saint-Léger-aux-Bois falls within the 271-366 days range, representing 88.9% of listings. This suggests many properties have significant open periods on their calendars.
- Approximately 96.3% of listings show high availability (181+ days open annually), indicating potential for increased bookings or specific owner usage patterns.
- For booked days, the 31-90 days range is most frequent in Saint-Léger-aux-Bois (70.4%), reflecting common guest stay durations or potential owner blocking patterns.
- A notable 3.7% of properties secure long booking periods (181+ days booked per year), highlighting successful long-term rental strategies or significant owner usage.
Saint-Léger-aux-Bois Airbnb Minimum Stay Requirements Analysis
Distribution of Listings by Minimum Night Requirement
1 Night
24 listings
88.9% of total
2 Nights
3 listings
11.1% of total
Key Insights
- The most prevalent minimum stay requirement in Saint-Léger-aux-Bois is 1 Night, adopted by 88.9% of listings. This highlights the market's preference for shorter, flexible bookings.
- A strong majority (100.0%) of the Saint-Léger-aux-Bois Airbnb data shows acceptance of very short stays (1-2 nights), indicating a dynamic, high-turnover market.
Recommendations
- Align with the market by considering a 1 Night minimum stay, as 88.9% of Saint-Léger-aux-Bois hosts use this setting.
- Adjust minimum nights based on seasonality – potentially shorter during low season and longer during peak demand periods in Saint-Léger-aux-Bois.
Saint-Léger-aux-Bois Airbnb Cancellation Policy Trends Analysis (2025)
Firm
1 listings
16.7% of total
Strict
5 listings
83.3% of total
Cancellation Policy Insights for Saint-Léger-aux-Bois
- The prevailing Airbnb cancellation policy trend in Saint-Léger-aux-Bois is Strict, used by 83.3% of listings.
- A majority (100.0%) of hosts in Saint-Léger-aux-Bois utilize Firm or Strict policies, indicating a market where hosts prioritize booking security.
Recommendations for Hosts
- Consider adopting a Strict policy to align with the 83.3% market standard in Saint-Léger-aux-Bois.
- With 83.3% using Strict terms, this is a viable option in Saint-Léger-aux-Bois, particularly for high-value properties or during peak demand periods.
- Regularly review your cancellation policy against competitors and market demand shifts in Saint-Léger-aux-Bois.
Saint-Léger-aux-Bois STR Booking Lead Time Analysis (2025)
Average Booking Lead Time by Month
Booking Lead Time Insights for Saint-Léger-aux-Bois
- The overall average booking lead time for vacation rentals in Saint-Léger-aux-Bois is 50 days.
- Guests book furthest in advance for stays during June (average 251 days), likely coinciding with peak travel demand or local events.
- The shortest booking windows occur for stays in July (average 11 days), indicating more last-minute travel plans during this time.
- Seasonally, Summer (98 days avg.) sees the longest lead times, while Fall (34 days avg.) has the shortest, reflecting typical travel planning cycles.
Recommendations for Hosts
- Use the overall average lead time (50 days) as a baseline for your pricing and availability strategy in Saint-Léger-aux-Bois.
- For June stays, consider implementing length-of-stay discounts or slightly higher rates for bookings made less than 251 days out to capitalize on advance planning.
- During July, focus on last-minute booking availability and promotions, as guests book with very short notice (11 days avg.).
- Target marketing efforts for the Summer season well in advance (at least 98 days) to capture early planners.
- Monitor your own booking lead times against these Saint-Léger-aux-Bois averages to identify opportunities for dynamic pricing adjustments.
Popular & Essential Airbnb Amenities in Saint-Léger-aux-Bois (2025)
Amenity Prevalence
Amenity Insights for Saint-Léger-aux-Bois
- Essential amenities in Saint-Léger-aux-Bois that guests expect include: Free parking on premises, Heating. Lacking these (any) could significantly impact bookings.
- Popular amenities like Hot water, Air conditioning, Outdoor dining area are common but not universal. Offering these can provide a competitive edge.
- Warning: Wifi is not universally provided but is considered essential globally. Ensure reliable Wifi is offered.
Recommendations for Hosts
- Ensure your listing includes all essential amenities for Saint-Léger-aux-Bois: Free parking on premises, Heating.
- Consider adding popular differentiators like Hot water or Air conditioning to increase appeal.
- Highlight unique or less common amenities you offer (e.g., hot tub, dedicated workspace, EV charger) in your listing description and photos.
- Regularly check competitor amenities in Saint-Léger-aux-Bois to stay competitive.
Saint-Léger-aux-Bois Airbnb Guest Demographics & Profile Analysis (2025)
Guest Profile Summary for Saint-Léger-aux-Bois
- The typical guest profile for Airbnb in Saint-Léger-aux-Bois consists of primarily domestic travelers (86%), often arriving from nearby Paris, typically belonging to the Post-2000s (Gen Z/Alpha) group (50%), primarily speaking French or Spanish.
- Domestic travelers account for 85.7% of guests.
- Key international markets include France (85.7%) and Belgium (7.1%).
- Top languages spoken are French (50%) followed by Spanish (20%).
- A significant demographic segment is the Post-2000s (Gen Z/Alpha) group, representing 50% of guests.
Recommendations for Hosts
- Target domestic marketing efforts towards travelers from Paris and Guignes.
- Tailor amenities and listing descriptions to appeal to the dominant Post-2000s (Gen Z/Alpha) demographic (e.g., highlight fast WiFi, smart home features, local guides).
- Highlight unique local experiences or amenities relevant to the primary guest profile.
- Consider seasonal promotions aligned with peak travel times for key origin markets.
Nearby Short-Term Rental Market Comparison
How does the Saint-Léger-aux-Bois Airbnb market stack up against its neighbors? Compare key performance metrics like average monthly revenue, ADR, and occupancy rates in surrounding areas to understand the broader regional STR landscape.
| Market | Active Properties | Monthly Revenue | Daily Rate | Avg. Occupancy |
|---|---|---|---|---|
| Mont-de-l'Enclus | 10 | $5,756 | $378.03 | 42% |
| Morienval | 12 | $4,731 | $382.71 | 28% |
| Lo-Reninge | 16 | $4,729 | $435.11 | 40% |
| La Couture-Boussey | 12 | $3,657 | $397.36 | 30% |
| Kluisbergen | 17 | $3,444 | $378.89 | 42% |
| Ellezelles | 14 | $3,299 | $268.41 | 44% |
| Rosoy-en-Multien | 17 | $3,290 | $340.82 | 48% |
| Unverre | 10 | $3,057 | $306.53 | 35% |
| Aix-en-Issart | 10 | $3,009 | $272.14 | 40% |
| Ronse - Renaix | 27 | $2,900 | $370.39 | 32% |