al maadi Airbnb Market Analysis 2025: Short Term Rental Data & Vacation Rental Statistics in Matruh, Egypt
Is Airbnb profitable in al maadi in 2025? Explore comprehensive Airbnb analytics for al maadi, Matruh, Egypt to uncover income potential. This 2025 STR market report for al maadi, based on AirROI data from April 2024 to March 2025, reveals key trends in the niche market of 17 active listings.
Whether you're considering an Airbnb investment in al maadi, optimizing your existing vacation rental, or exploring rental arbitrage opportunities, understanding the al maadi Airbnb data is crucial. Leveraging the low regulation environment is key to maximizing your short term rental income potential. Let's dive into the specifics.
Key al maadi Airbnb Performance Metrics Overview
Monthly Airbnb Revenue Variations & Income Potential in al maadi (2025)
Understanding the monthly revenue variations for Airbnb listings in al maadi is key to maximizing your short term rental income potential. Seasonality significantly impacts earnings. Our analysis, based on data from the past 12 months, shows that the peak revenue month for STRs in al maadi is typically October, while December often presents the lowest earnings, highlighting opportunities for strategic pricing adjustments during shoulder and low seasons. Explore the typical Airbnb income in al maadi across different performance tiers:
- Best-in-class properties (Top 10%) achieve $1,573+ monthly, often utilizing dynamic pricing and superior guest experiences.
- Strong performing properties (Top 25%) earn $1,213 or more, indicating effective management and desirable locations/amenities.
- Typical properties (Median) generate around $481 per month, representing the average market performance.
- Entry-level properties (Bottom 25%) see earnings around $368, often with potential for optimization.
Average Monthly Airbnb Earnings Trend in al maadi
al maadi Airbnb Occupancy Rate Trends (2025)
Maximize your bookings by understanding the al maadi STR occupancy trends. Seasonal demand shifts significantly influence how often properties are booked. Typically, Octobersees the highest demand (peak season occupancy), while April experiences the lowest (low season). Effective strategies, like adjusting minimum stays or offering promotions, can boost occupancy during slower periods. Here's how different property tiers perform in al maadi:
- Best-in-class properties (Top 10%) achieve 50%+ occupancy, indicating high desirability and potentially optimized availability.
- Strong performing properties (Top 25%) maintain 38% or higher occupancy, suggesting good market fit and guest satisfaction.
- Typical properties (Median) have an occupancy rate around 22%.
- Entry-level properties (Bottom 25%) average 18% occupancy, potentially facing higher vacancy.
Average Monthly Occupancy Rate Trend in al maadi
Average Daily Rate (ADR) Airbnb Trends in al maadi (2025)
Effective short term rental pricing strategy in al maadi involves understanding monthly ADR fluctuations. The Average Daily Rate (ADR) for Airbnb in al maadi typically peaks in July and dips lowest during December. Leveraging Airbnb dynamic pricing tools or strategies based on this seasonality can significantly boost revenue. Here's a look at the typical nightly rates achieved:
- Best-in-class properties (Top 10%) command rates of $177+ per night, often due to premium features or locations.
- Strong performing properties (Top 25%) achieve nightly rates of $117 or more.
- Typical properties (Median) charge around $78 per night.
- Entry-level properties (Bottom 25%) earn around $53 per night.
Average Daily Rate (ADR) Trend by Month in al maadi
Get Live al maadi Market Intelligence 👇

Explore Real-time Analytics
Airbnb Seasonality Analysis & Trends in al maadi (2025)
Peak Season (October, June, April)
- Revenue averages $1,164 per month
- Occupancy rates average 35.8%
- Daily rates average $105
Shoulder Season
- Revenue averages $557 per month
- Occupancy maintains around 20.7%
- Daily rates hold near $95
Low Season (February, March, November)
- Revenue drops to average $0 per month
- Occupancy decreases to average 0.0%
- Daily rates adjust to average $74
Seasonality Insights for al maadi
- The Airbnb seasonality in al maadi shows highly seasonal trends requiring careful strategy. While the sections above show seasonal averages, it's also insightful to look at the extremes:
- During the high season, the absolute peak month showcases al maadi's highest earning potential, with monthly revenues capable of climbing to $1,292, occupancy reaching a high of 77.4%, and ADRs peaking at $107.
- Conversely, the slowest single month of the year, typically falling within the low season, marks the market's lowest point. In this month, revenue might dip to $0, occupancy could drop to 0.0%, and ADRs may adjust down to $73.
- Understanding both the seasonal averages and these monthly peaks and troughs in revenue, occupancy, and ADR is crucial for maximizing your Airbnb profit potential in al maadi.
Seasonal Strategies for Maximizing Profit
- Peak Season: Maximize revenue through premium pricing and potentially longer minimum stays. Ensure high availability.
- Low Season: Offer competitive pricing, special promotions (e.g., extended stay discounts), and flexible cancellation policies. Target off-season travelers like remote workers or budget-conscious guests.
- Shoulder Seasons: Implement dynamic pricing that balances peak and low rates. Target weekend travelers or specific events. Offer slightly more flexible terms than peak season.
- Regularly analyze your own performance against these al maadi seasonality benchmarks and adjust your pricing and availability strategy accordingly.
Best Areas for Airbnb Investment in al maadi (2025)
Exploring the top neighborhoods for short-term rentals in al maadi? This section highlights key areas, outlining why they are attractive for hosts and guests, along with notable local attractions. Consider these locations based on your target guest profile and investment strategy.
| Neighborhood / Area | Why Host Here? (Target Guests & Appeal) | Key Attractions & Landmarks |
|---|---|---|
| Al Maadi | A serene, green neighborhood in Cairo, popular with expats and families. Known for its quiet streets, parks, and cafes. Proximity to the Nile River makes it attractive for both short and long-term stays. | Nile Corniche, Maadi Island, Tahrir Square, Al Maadi Community Church, Local cafes and restaurants |
| Sharm El Sheikh | A world-renowned resort town on the Sinai Peninsula, famous for its beautiful beaches and coral reefs. Ideal for travelers seeking luxury, diving, and relaxation. | Naama Bay, Ras Mohammed National Park, Tiran Island, Sharm El Sheikh Marina, Local markets and bazaars |
| Matruh Corniche | A beautiful coastal area in Matruh, known for its stunning beaches and scenic views. Great for tourists looking for beach holidays and family outings. | Agiba Beach, The White Beach, Matrouh Museum, Local seafood restaurants, Sunset views |
| North Coast | An emerging destination in Egypt, the North Coast offers beautiful summer resorts and beach homes. Perfect for families looking for vacation rentals. | Sidi Abdel Rahman Beach, Marassi Resort, El Alamein Memorial, Coastal restaurants, Beach clubs |
| Alamein | Rich in history, Alamein is known for its World War II sites, beaches, and resorts. Attracts history buffs and beachgoers alike. | El Alamein War Museum, World War II memorials, Beach resorts, Local history tours, Water sports |
| Dahab | A laid-back beach town popular with divers and backpackers. Offers a unique cultural experience with a vibrant community and stunning natural beauty. | Blue Hole, Dahab Canyon, Local shops and cafes, Bedouin desert tours, Wadi Zaghara |
| Hurghada | A popular Red Sea resort town known for its clear waters and coral reefs. Attracts tourists for diving and all-inclusive hotel experiences. | Giftun Islands, Desert Safari tours, Marina Boulevard, Water sports activities, Local seafood markets |
| Ismailia | A historical city on the Suez Canal known for its gardens and British colonial architecture. Great for cultural tourism and short stays. | Ismailia Museum, Lake Timsah, Cultural festivals, Local parks, Historically significant buildings |
Understanding Airbnb License Requirements & STR Laws in al maadi (2025)
While al maadi, Matruh, Egypt currently shows low STR regulations, specific Airbnb license requirements might still exist or change. Always verify the latest short term rental regulations and Airbnb license requirements directly with local government authorities for al maadi to ensure full compliance before hosting.
(Source: AirROI data, 2025, finding no licensed listings among those analyzed)
Top Performing Airbnb Properties in al maadi (2025)
Benchmark your potential! Explore examples of top-performing Airbnb properties in al maadibased on Trailing Twelve Month (TTM) revenue. Analyze their characteristics, revenue, occupancy rate, and ADR to understand what drives success in this market.
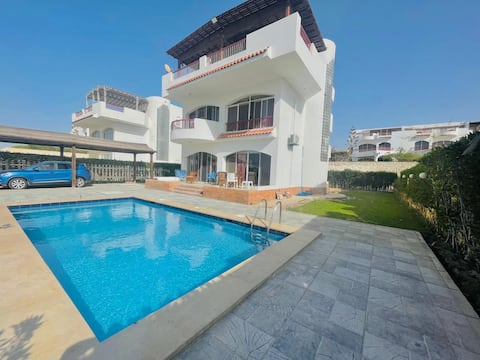
Villa with private pool 4 Rooms-10 pax in panorama
Entire Place • 4 bedrooms

Chalet in Reem elfala (sea view)
Entire Place • 2 bedrooms
Della’s Beach house
Entire Place • 3 bedrooms
First floor with roof, Reem Elfala
Entire Place • 2 bedrooms

Blue villa _ see the sea_ 5 min walk from sea
Entire Place • 3 bedrooms

The Pool Houseستوديو
Entire Place • 1 bedroom
Note: Performance varies based on location, size, amenities, seasonality, and management quality. Data reflects the past 12 months.
Top Performing Airbnb Hosts in al maadi (2025)
Learn from the best! This table showcases top-performing Airbnb hosts in al maadi based on the number of properties managed and estimated total revenue over the past year. Analyze their scale and performance metrics.
| Host Name | Properties | Grossing Revenue | Stay Reviews | Avg Rating |
|---|---|---|---|---|
| Host #380176663 | 1 | $16,474 | 1 | 0.00/5.0 |
| Ahmed | 1 | $4,744 | 4 | 5.00/5.0 |
| Dalal | 1 | $4,678 | 6 | 5.00/5.0 |
| Amr | 1 | $4,294 | 6 | 4.50/5.0 |
| Sarah | 1 | $2,785 | 24 | 4.50/5.0 |
| Aliaa | 1 | $2,514 | 12 | 4.67/5.0 |
| Host #260983782 | 1 | $1,942 | 0 | 0.00/5.0 |
| Host #205326419 | 1 | $1,305 | 1 | 0.00/5.0 |
| Host #491555072 | 1 | $1,047 | 0 | 0.00/5.0 |
| Host #211750393 | 1 | $996 | 0 | 0.00/5.0 |
Analyzing the strategies of top hosts, such as their property selection, pricing, and guest communication, can offer valuable lessons for optimizing your own Airbnb operations in al maadi.
Dive Deeper: Advanced al maadi STR Market Data (2025)
Ready to unlock more insights? AirROI provides access to advanced metrics and comprehensive Airbnb data for al maadi. Explore detailed analytics beyond this report to refine your investment strategy, optimize pricing, and maximize your vacation rental profits.
Explore Advanced Metricsal maadi Short-Term Rental Market Composition (2025): Property & Room Types
Room Type Distribution
Property Type Distribution
Market Composition Insights for al maadi
- The al maadi Airbnb market composition is heavily skewed towards Entire Home/Apt listings, which make up 94.1% of the 17 active rentals. This indicates strong guest preference for privacy and space.
- Looking at the property type distribution in al maadi, Apartment/Condo properties are the most common (64.7%), reflecting the local real estate landscape.
- Houses represent a significant 35.3% portion, catering likely to families or larger groups.
al maadi Airbnb Room Capacity Analysis (2025): Bedroom Distribution
Distribution of Listings by Number of Bedrooms
Room Capacity Insights for al maadi
- The dominant room capacity in al maadi is 2 bedrooms listings, making up 47.1% of the market. This suggests a strong demand for properties suitable for couples or solo travelers.
- Together, 2 bedrooms and 3 bedrooms properties represent 76.5% of the active Airbnb listings in al maadi, indicating a high concentration in these sizes.
- A significant 35.3% of listings offer 3+ bedrooms, catering to larger groups and families seeking more space in al maadi.
al maadi Vacation Rental Guest Capacity Trends (2025)
Distribution of Listings by Guest Capacity
Guest Capacity Insights for al maadi
- The most common guest capacity trend in al maadi vacation rentals is listings accommodating 6 guests (41.2%). This suggests the primary traveler segment is likely larger groups.
- Properties designed for 6 guests and 8+ guests dominate the al maadi STR market, accounting for 58.8% of listings.
- 70.6% of properties accommodate 6+ guests, serving the market segment for larger families or group travel in al maadi.
- On average, properties in al maadi are equipped to host 5.9 guests.
al maadi Airbnb Booking Patterns (2025): Available vs. Booked Days
Available Days Distribution
Booked Days Distribution
Booking Pattern Insights for al maadi
- The most common availability pattern in al maadi falls within the 271-366 days range, representing 94.1% of listings. This suggests many properties have significant open periods on their calendars.
- Approximately 100.0% of listings show high availability (181+ days open annually), indicating potential for increased bookings or specific owner usage patterns.
- For booked days, the 1-30 days range is most frequent in al maadi (64.7%), reflecting common guest stay durations or potential owner blocking patterns.
al maadi Airbnb Minimum Stay Requirements Analysis
Distribution of Listings by Minimum Night Requirement
1 Night
10 listings
62.5% of total
2 Nights
4 listings
25% of total
3 Nights
2 listings
12.5% of total
Key Insights
- The most prevalent minimum stay requirement in al maadi is 1 Night, adopted by 62.5% of listings. This highlights the market's preference for shorter, flexible bookings.
- A strong majority (87.5%) of the al maadi Airbnb data shows acceptance of very short stays (1-2 nights), indicating a dynamic, high-turnover market.
Recommendations
- Align with the market by considering a 1 Night minimum stay, as 62.5% of al maadi hosts use this setting.
- Adjust minimum nights based on seasonality – potentially shorter during low season and longer during peak demand periods in al maadi.
al maadi Airbnb Cancellation Policy Trends Analysis (2025)
Flexible
1 listings
14.3% of total
Moderate
3 listings
42.9% of total
Strict
3 listings
42.9% of total
Cancellation Policy Insights for al maadi
- The prevailing Airbnb cancellation policy trend in al maadi is Moderate, used by 42.9% of listings.
- There's a relatively balanced mix between guest-friendly (57.2%) and stricter (42.9%) policies, offering choices for different guest needs.
Recommendations for Hosts
- Consider adopting a Moderate policy to align with the 42.9% market standard in al maadi.
- With 42.9% using Strict terms, this is a viable option in al maadi, particularly for high-value properties or during peak demand periods.
- Regularly review your cancellation policy against competitors and market demand shifts in al maadi.
al maadi STR Booking Lead Time Analysis (2025)
Average Booking Lead Time by Month
Booking Lead Time Insights for al maadi
- The overall average booking lead time for vacation rentals in al maadi is 16 days.
- Guests book furthest in advance for stays during August (average 30 days), likely coinciding with peak travel demand or local events.
- The shortest booking windows occur for stays in December (average 0 days), indicating more last-minute travel plans during this time.
- Seasonally, Summer (21 days avg.) sees the longest lead times, while Winter (0 days avg.) has the shortest, reflecting typical travel planning cycles.
Recommendations for Hosts
- Use the overall average lead time (16 days) as a baseline for your pricing and availability strategy in al maadi.
- For August stays, consider implementing length-of-stay discounts or slightly higher rates for bookings made less than 30 days out to capitalize on advance planning.
- During December, focus on last-minute booking availability and promotions, as guests book with very short notice (0 days avg.).
- Target marketing efforts for the Summer season well in advance (at least 21 days) to capture early planners.
- Monitor your own booking lead times against these al maadi averages to identify opportunities for dynamic pricing adjustments.
Popular & Essential Airbnb Amenities in al maadi (2025)
Amenity Prevalence
Amenity Insights for al maadi
- Essential amenities in al maadi that guests expect include: Kitchen, TV. Lacking these (any) could significantly impact bookings.
- Popular amenities like Hot water, Air conditioning, Free parking on premises are common but not universal. Offering these can provide a competitive edge.
- A pool is a highly desired but not standard amenity, making it a key feature for attracting guests seeking leisure in al maadi.
Recommendations for Hosts
- Ensure your listing includes all essential amenities for al maadi: Kitchen, TV.
- Consider adding popular differentiators like Hot water or Air conditioning to increase appeal.
- Highlight unique or less common amenities you offer (e.g., hot tub, dedicated workspace, EV charger) in your listing description and photos.
- Regularly check competitor amenities in al maadi to stay competitive.
al maadi Airbnb Guest Demographics & Profile Analysis (2025)
Guest Profile Summary for al maadi
- The typical guest profile for Airbnb in al maadi consists of a mix of domestic (55%) and international guests, often arriving from nearby Cairo, typically belonging to the 1990s (Older Gen Z) group (50%), primarily speaking English or Arabic.
- Domestic travelers account for 54.5% of guests.
- Key international markets include Egypt (54.5%) and France (9.1%).
- Top languages spoken are English (42.9%) followed by Arabic (33.3%).
- A significant demographic segment is the Post-2000s (Gen Z/Alpha) group, representing 50% of guests.
Recommendations for Hosts
- Balance marketing efforts between domestic and international channels based on the guest mix.
- Tailor amenities and listing descriptions to appeal to the dominant 1990s (Older Gen Z) demographic (e.g., highlight fast WiFi, smart home features, local guides).
- Highlight unique local experiences or amenities relevant to the primary guest profile.
- Consider seasonal promotions aligned with peak travel times for key origin markets.
Nearby Short-Term Rental Market Comparison
How does the al maadi Airbnb market stack up against its neighbors? Compare key performance metrics like average monthly revenue, ADR, and occupancy rates in surrounding areas to understand the broader regional STR landscape.
| Market | Active Properties | Monthly Revenue | Daily Rate | Avg. Occupancy |
|---|---|---|---|---|
| Seashell | 14 | $1,208 | $328.05 | 38% |
| La Hacienda Bay - Sidi AbdelRahman | 23 | $1,176 | $367.33 | 32% |
| October Hills | 16 | $1,023 | $111.93 | 41% |
| Orchidia | 10 | $910 | $314.26 | 31% |
| مراسي | 216 | $884 | $368.52 | 30% |
| Mountainview Ras El Hekma | 18 | $794 | $289.82 | 36% |
| Ekeingy Maryout (Sharq WA Gharb) | 10 | $780 | $90.60 | 41% |
| Amwaj Village | 34 | $740 | $167.08 | 37% |
| Sidi Abdel Rahman | 62 | $637 | $189.24 | 33% |
| Youssef Al Sediq City | 61 | $592 | $98.32 | 24% |