Kafrat Nassar Airbnb Market Analysis 2025: Short Term Rental Data & Vacation Rental Statistics in Giza, Egypt
Is Airbnb profitable in Kafrat Nassar in 2025? Explore comprehensive Airbnb analytics for Kafrat Nassar, Giza, Egypt to uncover income potential. This 2025 STR market report for Kafrat Nassar, based on AirROI data from June 2024 to May 2025, reveals key trends in the niche market of 23 active listings.
Whether you're considering an Airbnb investment in Kafrat Nassar, optimizing your existing vacation rental, or exploring rental arbitrage opportunities, understanding the Kafrat Nassar Airbnb data is crucial. Understanding the local regulations is key to maximizing your short term rental income potential. Let's dive into the specifics.
Key Kafrat Nassar Airbnb Performance Metrics Overview
Monthly Airbnb Revenue Variations & Income Potential in Kafrat Nassar (2025)
Understanding the monthly revenue variations for Airbnb listings in Kafrat Nassar is key to maximizing your short term rental income potential. Seasonality significantly impacts earnings. Our analysis, based on data from the past 12 months, shows that the peak revenue month for STRs in Kafrat Nassar is typically March, while June often presents the lowest earnings, highlighting opportunities for strategic pricing adjustments during shoulder and low seasons. Explore the typical Airbnb income in Kafrat Nassar across different performance tiers:
- Best-in-class properties (Top 10%) achieve $954+ monthly, often utilizing dynamic pricing and superior guest experiences.
- Strong performing properties (Top 25%) earn $546 or more, indicating effective management and desirable locations/amenities.
- Typical properties (Median) generate around $227 per month, representing the average market performance.
- Entry-level properties (Bottom 25%) see earnings around $118, often with potential for optimization.
Average Monthly Airbnb Earnings Trend in Kafrat Nassar
Kafrat Nassar Airbnb Occupancy Rate Trends (2025)
Maximize your bookings by understanding the Kafrat Nassar STR occupancy trends. Seasonal demand shifts significantly influence how often properties are booked. Typically, Augustsees the highest demand (peak season occupancy), while June experiences the lowest (low season). Effective strategies, like adjusting minimum stays or offering promotions, can boost occupancy during slower periods. Here's how different property tiers perform in Kafrat Nassar:
- Best-in-class properties (Top 10%) achieve 42%+ occupancy, indicating high desirability and potentially optimized availability.
- Strong performing properties (Top 25%) maintain 33% or higher occupancy, suggesting good market fit and guest satisfaction.
- Typical properties (Median) have an occupancy rate around 22%.
- Entry-level properties (Bottom 25%) average 14% occupancy, potentially facing higher vacancy.
Average Monthly Occupancy Rate Trend in Kafrat Nassar
Average Daily Rate (ADR) Airbnb Trends in Kafrat Nassar (2025)
Effective short term rental pricing strategy in Kafrat Nassar involves understanding monthly ADR fluctuations. The Average Daily Rate (ADR) for Airbnb in Kafrat Nassar typically peaks in January and dips lowest during November. Leveraging Airbnb dynamic pricing tools or strategies based on this seasonality can significantly boost revenue. Here's a look at the typical nightly rates achieved:
- Best-in-class properties (Top 10%) command rates of $153+ per night, often due to premium features or locations.
- Strong performing properties (Top 25%) achieve nightly rates of $70 or more.
- Typical properties (Median) charge around $39 per night.
- Entry-level properties (Bottom 25%) earn around $24 per night.
Average Daily Rate (ADR) Trend by Month in Kafrat Nassar
Get Live Kafrat Nassar Market Intelligence 👇
Explore Real-time Analytics
Airbnb Seasonality Analysis & Trends in Kafrat Nassar (2025)
Peak Season (March, May, April)
- Revenue averages $573 per month
- Occupancy rates average 23.9%
- Daily rates average $61
Shoulder Season
- Revenue averages $391 per month
- Occupancy maintains around 27.6%
- Daily rates hold near $61
Low Season (June, September, October)
- Revenue drops to average $204 per month
- Occupancy decreases to average 18.8%
- Daily rates adjust to average $62
Seasonality Insights for Kafrat Nassar
- The Airbnb seasonality in Kafrat Nassar shows highly seasonal trends requiring careful strategy. While the sections above show seasonal averages, it's also insightful to look at the extremes:
- During the high season, the absolute peak month showcases Kafrat Nassar's highest earning potential, with monthly revenues capable of climbing to $691, occupancy reaching a high of 44.7%, and ADRs peaking at $63.
- Conversely, the slowest single month of the year, typically falling within the low season, marks the market's lowest point. In this month, revenue might dip to $54, occupancy could drop to 5.0%, and ADRs may adjust down to $58.
- Understanding both the seasonal averages and these monthly peaks and troughs in revenue, occupancy, and ADR is crucial for maximizing your Airbnb profit potential in Kafrat Nassar.
Seasonal Strategies for Maximizing Profit
- Peak Season: Maximize revenue through premium pricing and potentially longer minimum stays. Ensure high availability.
- Low Season: Offer competitive pricing, special promotions (e.g., extended stay discounts), and flexible cancellation policies. Target off-season travelers like remote workers or budget-conscious guests.
- Shoulder Seasons: Implement dynamic pricing that balances peak and low rates. Target weekend travelers or specific events. Offer slightly more flexible terms than peak season.
- Regularly analyze your own performance against these Kafrat Nassar seasonality benchmarks and adjust your pricing and availability strategy accordingly.
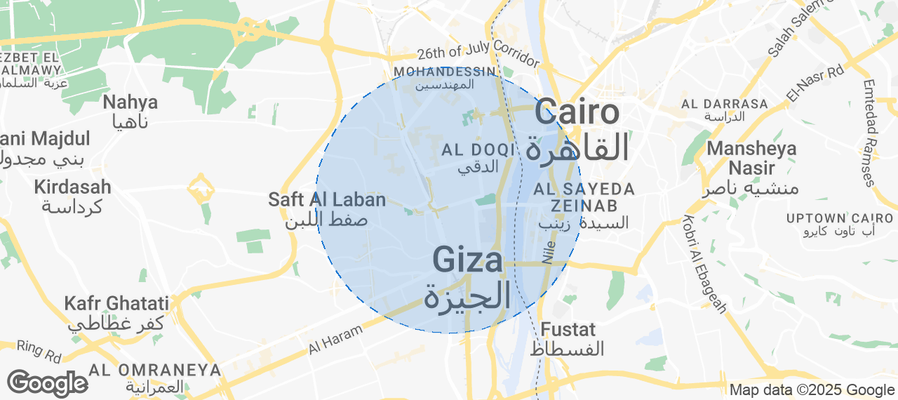
Best Areas for Airbnb Investment in Kafrat Nassar (2025)
Exploring the top neighborhoods for short-term rentals in Kafrat Nassar? This section highlights key areas, outlining why they are attractive for hosts and guests, along with notable local attractions. Consider these locations based on your target guest profile and investment strategy.
| Neighborhood / Area | Why Host Here? (Target Guests & Appeal) | Key Attractions & Landmarks |
|---|---|---|
| Kafrat Nassar | A growing neighborhood in Giza, attracting both business travelers and tourists due to its proximity to key historical sites and urban amenities. Ideal for budget-conscious travelers looking for convenient accommodations. | Pyramids of Giza, Sphinx, Cairo Opera House, Giza Plateau, Khan El Khalili Bazaar, Tahrir Square |
| Giza Plateau | Home to the iconic Pyramids and the Sphinx, this area is a must-visit for tourists worldwide. Ideal for short-term rentals given the high influx of visitors seeking unique experiences | Great Pyramid of Giza, Sphinx, Giza Solar Boat Museum, Osiris Temple, Pyramid of Khafre, Sound and Light Show |
| Al Haram | Close to the Pyramids and rich in historical significance, Al Haram caters to tourists looking for affordable accommodations near top attractions. It's bustling with shops and restaurants. | Al Haram Street, Pyramids panorama view, Falconry shows, Egyptian Museum, Local restaurants |
| Dokki | A central area in Giza with a mix of residential and commercial spaces, it provides a great balance of city life and access to cultural sites. Popular among business travelers and families. | Dokki Garden, El-Mezala Park, Shopping centers, Cairo University, Abdeen Palace |
| Zamalek | An upscale neighborhood on an island in the Nile, known for its leafy streets and foreign embassies. Ideal for luxury travelers and tourists looking for a unique experience. | Zamalek Art Gallery, Cairo Opera House, Nile view restaurants, Gezira Sporting Club |
| Mohandessin | A vibrant urban area with great access to restaurants and shopping, it's popular among young professionals and tourists looking for a local experience. | Seventh District Mall, Shopping streets, Local cafes, Cairo Metro stations |
| 6th of October City | A satellite city to Cairo and Giza, it offers modern amenities and shopping centers. Ideal for longer stays and families looking for a suburban feel. | Mall of Arabia, 6th of October University, Giza Pyramids |
| New Giza | A luxurious and well-planned community offering modern housing and facilities. Suitable for high-end tourists and expatriates wanting a quiet stay close to the city. | New Giza Club, Golf courses, Shopping outlets, Local restaurants |
Understanding Airbnb License Requirements & STR Laws in Kafrat Nassar (2025)
With 22% of listings showing registration in 2025, understanding potential Airbnb license requirements is crucial in Kafrat Nassar. Always verify the latest short term rental regulations and Airbnb license requirements directly with local government authorities for Kafrat Nassar to ensure full compliance before hosting.
(Source: AirROI data, 2025, based on 22% licensed listings)
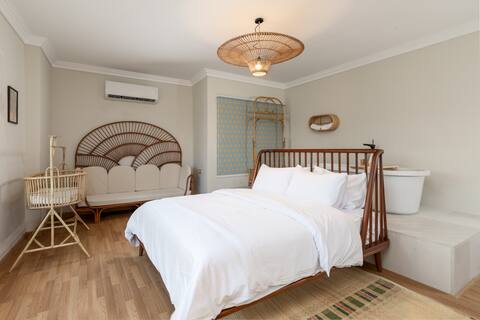
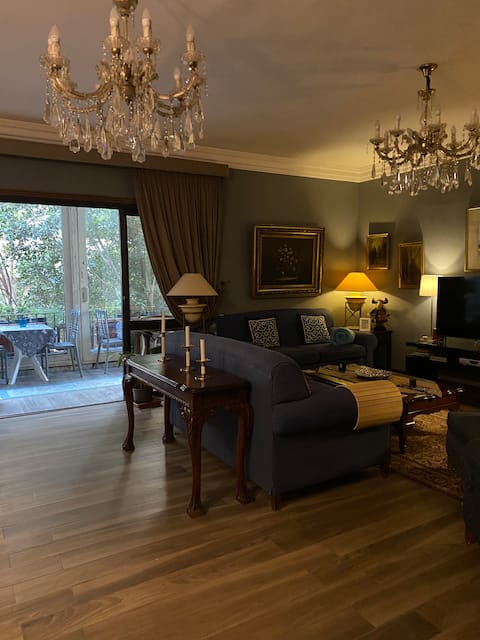
Top Performing Airbnb Properties in Kafrat Nassar (2025)
Benchmark your potential! Explore examples of top-performing Airbnb properties in Kafrat Nassarbased on Trailing Twelve Month (TTM) revenue. Analyze their characteristics, revenue, occupancy rate, and ADR to understand what drives success in this market.
"Pyramid's Stylish Apt: Explore Multicultures"
Entire Place • 3 bedrooms
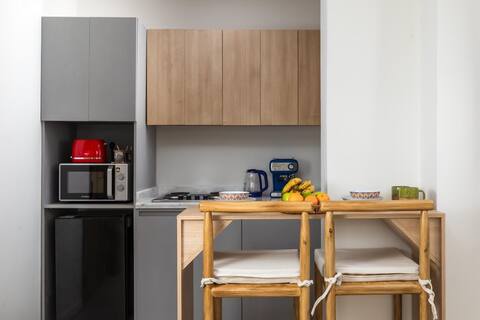
pyramid's 2 studios, full equipped apt
Entire Place • 2 bedrooms

Lovely 3-Bed Pyramids viewApartment in Kafr Nassar
Entire Place • 3 bedrooms
Nefertiti Pyramids boutique hotel
Entire Place • 5 bedrooms
Jacuzzi Paradise: Pyramids Panoramic View 504
Entire Place • 1 bedroom

Near Giza pyramids, modern furnished new Apartment
Entire Place ��• 2 bedrooms
Note: Performance varies based on location, size, amenities, seasonality, and management quality. Data reflects the past 12 months.
Top Performing Airbnb Hosts in Kafrat Nassar (2025)
Learn from the best! This table showcases top-performing Airbnb hosts in Kafrat Nassar based on the number of properties managed and estimated total revenue over the past year. Analyze their scale and performance metrics.
| Host Name | Properties | Grossing Revenue | Stay Reviews | Avg Rating |
|---|---|---|---|---|
| Host #376867839 | 2 | $14,100 | 0 | N/A/5.0 |
| Yasser | 2 | $8,569 | 29 | 4.90/5.0 |
| Mahal | 2 | $6,876 | 13 | 5.00/5.0 |
| Host #544377226 | 1 | $6,292 | 0 | N/A/5.0 |
| Terry | 1 | $4,741 | 8 | 5.00/5.0 |
| Host #233618327 | 5 | $3,501 | 2 | N/A/5.0 |
| Madonna | 1 | $2,898 | 4 | 5.00/5.0 |
| Host #472024267 | 1 | $1,827 | 0 | N/A/5.0 |
| Host #540664014 | 1 | $1,160 | 0 | N/A/5.0 |
| Host #472368857 | 1 | $816 | 0 | N/A/5.0 |
Analyzing the strategies of top hosts, such as their property selection, pricing, and guest communication, can offer valuable lessons for optimizing your own Airbnb operations in Kafrat Nassar.
Dive Deeper: Advanced Kafrat Nassar STR Market Data (2025)
Ready to unlock more insights? AirROI provides access to advanced metrics and comprehensive Airbnb data for Kafrat Nassar. Explore detailed analytics beyond this report to refine your investment strategy, optimize pricing, and maximize your vacation rental profits.
Explore Advanced MetricsKafrat Nassar Short-Term Rental Market Composition (2025): Property & Room Types
Room Type Distribution
Property Type Distribution
Market Composition Insights for Kafrat Nassar
- The Kafrat Nassar Airbnb market composition is heavily skewed towards Private Room listings, which make up 52.2% of the 23 active rentals. This indicates strong guest preference for privacy and space.
- Looking at the property type distribution in Kafrat Nassar, Apartment/Condo properties are the most common (91.3%), reflecting the local real estate landscape.
- The presence of 8.7% Hotel/Boutique listings indicates integration with traditional hospitality.
Kafrat Nassar Airbnb Room Capacity Analysis (2025): Bedroom Distribution
Distribution of Listings by Number of Bedrooms
Room Capacity Insights for Kafrat Nassar
- The dominant room capacity in Kafrat Nassar is 1 bedroom listings, making up 56.5% of the market. This suggests a strong demand for properties suitable for couples or solo travelers.
- Together, 1 bedroom and 3 bedrooms properties represent 73.9% of the active Airbnb listings in Kafrat Nassar, indicating a high concentration in these sizes.
- With over half the market (56.5%) consisting of studios or 1-bedroom units, Kafrat Nassar is particularly well-suited for individuals or couples.
- A significant 21.7% of listings offer 3+ bedrooms, catering to larger groups and families seeking more space in Kafrat Nassar.
Kafrat Nassar Vacation Rental Guest Capacity Trends (2025)
Distribution of Listings by Guest Capacity
Guest Capacity Insights for Kafrat Nassar
- The most common guest capacity trend in Kafrat Nassar vacation rentals is listings accommodating 2 guests (26.1%). This suggests the primary traveler segment is likely couples or solo travelers.
- Properties designed for 2 guests and 3 guests dominate the Kafrat Nassar STR market, accounting for 47.8% of listings.
- 12.9% of properties accommodate 6+ guests, serving the market segment for larger families or group travel in Kafrat Nassar.
- On average, properties in Kafrat Nassar are equipped to host 3.4 guests.
Kafrat Nassar Airbnb Booking Patterns (2025): Available vs. Booked Days
Available Days Distribution
Booked Days Distribution
Booking Pattern Insights for Kafrat Nassar
- The most common availability pattern in Kafrat Nassar falls within the 271-366 days range, representing 82.6% of listings. This suggests many properties have significant open periods on their calendars.
- Approximately 100.0% of listings show high availability (181+ days open annually), indicating potential for increased bookings or specific owner usage patterns.
- For booked days, the 1-30 days range is most frequent in Kafrat Nassar (60.9%), reflecting common guest stay durations or potential owner blocking patterns.
Kafrat Nassar Airbnb Minimum Stay Requirements Analysis
Distribution of Listings by Minimum Night Requirement
1 Night
14 listings
60.9% of total
2 Nights
2 listings
8.7% of total
3 Nights
2 listings
8.7% of total
4-6 Nights
1 listings
4.3% of total
7-29 Nights
1 listings
4.3% of total
30+ Nights
3 listings
13% of total
Key Insights
- The most prevalent minimum stay requirement in Kafrat Nassar is 1 Night, adopted by 60.9% of listings. This highlights the market's preference for shorter, flexible bookings.
- A strong majority (69.6%) of the Kafrat Nassar Airbnb data shows acceptance of very short stays (1-2 nights), indicating a dynamic, high-turnover market.
- A significant segment (13%) caters to monthly stays (30+ nights) in Kafrat Nassar, pointing to opportunities in the extended-stay market.
Recommendations
- Align with the market by considering a 1 Night minimum stay, as 60.9% of Kafrat Nassar hosts use this setting.
- Explore offering discounts for stays of 30+ nights to attract the 13% of the market seeking extended stays.
- Adjust minimum nights based on seasonality – potentially shorter during low season and longer during peak demand periods in Kafrat Nassar.
Kafrat Nassar Airbnb Cancellation Policy Trends Analysis (2025)
Flexible
10 listings
71.4% of total
Moderate
2 listings
14.3% of total
Firm
2 listings
14.3% of total
Cancellation Policy Insights for Kafrat Nassar
- The prevailing Airbnb cancellation policy trend in Kafrat Nassar is Flexible, used by 71.4% of listings.
- The market strongly favors guest-friendly terms, with 85.7% of listings offering Flexible or Moderate policies. This suggests guests in Kafrat Nassar may expect booking flexibility.
Recommendations for Hosts
- Consider adopting a Flexible policy to align with the 71.4% market standard in Kafrat Nassar.
- Given the high prevalence of Flexible policies (71.4%), offering this can enhance booking appeal, especially during shoulder seasons.
- Regularly review your cancellation policy against competitors and market demand shifts in Kafrat Nassar.
Kafrat Nassar STR Booking Lead Time Analysis (2025)
Average Booking Lead Time by Month
Booking Lead Time Insights for Kafrat Nassar
- The overall average booking lead time for vacation rentals in Kafrat Nassar is 17 days.
- Guests book furthest in advance for stays during September (average 43 days), likely coinciding with peak travel demand or local events.
- The shortest booking windows occur for stays in June (average 1 days), indicating more last-minute travel plans during this time.
- Seasonally, Fall (23 days avg.) sees the longest lead times, while Summer (6 days avg.) has the shortest, reflecting typical travel planning cycles.
Recommendations for Hosts
- Use the overall average lead time (17 days) as a baseline for your pricing and availability strategy in Kafrat Nassar.
- For September stays, consider implementing length-of-stay discounts or slightly higher rates for bookings made less than 43 days out to capitalize on advance planning.
- During June, focus on last-minute booking availability and promotions, as guests book with very short notice (1 days avg.).
- Target marketing efforts for the Fall season well in advance (at least 23 days) to capture early planners.
- Monitor your own booking lead times against these Kafrat Nassar averages to identify opportunities for dynamic pricing adjustments.
Popular & Essential Airbnb Amenities in Kafrat Nassar (2025)
Amenity Prevalence
Amenity Insights for Kafrat Nassar
- Essential amenities in Kafrat Nassar that guests expect include: Hot water, Air conditioning, Wifi, Washer, Heating, Kitchen, TV. Lacking these (any) could significantly impact bookings.
- Popular amenities like Free parking on premises, Iron, Essentials are common but not universal. Offering these can provide a competitive edge.
Recommendations for Hosts
- Ensure your listing includes all essential amenities for Kafrat Nassar: Hot water, Air conditioning, Wifi, Washer, Heating, Kitchen, TV.
- Prioritize adding missing essentials: Heating, Kitchen, TV.
- Consider adding popular differentiators like Free parking on premises or Iron to increase appeal.
- Highlight unique or less common amenities you offer (e.g., hot tub, dedicated workspace, EV charger) in your listing description and photos.
- Regularly check competitor amenities in Kafrat Nassar to stay competitive.
Kafrat Nassar Airbnb Guest Demographics & Profile Analysis (2025)
Guest Profile Summary for Kafrat Nassar
- The typical guest profile for Airbnb in Kafrat Nassar consists of predominantly international visitors (91%), with top international origins including United States, typically belonging to the Post-2000s (Gen Z/Alpha) group (50%), primarily speaking English or Arabic.
- Domestic travelers account for 9.4% of guests.
- Key international markets include Saudi Arabia (15.6%) and United States (12.5%).
- Top languages spoken are English (47.9%) followed by Arabic (27.1%).
- A significant demographic segment is the Post-2000s (Gen Z/Alpha) group, representing 50% of guests.
Recommendations for Hosts
- Focus marketing internationally, particularly towards travelers from United States.
- Tailor amenities and listing descriptions to appeal to the dominant Post-2000s (Gen Z/Alpha) demographic (e.g., highlight fast WiFi, smart home features, local guides).
- Highlight unique local experiences or amenities relevant to the primary guest profile.
- Consider seasonal promotions aligned with peak travel times for key origin markets.
Nearby Short-Term Rental Market Comparison
How does the Kafrat Nassar Airbnb market stack up against its neighbors? Compare key performance metrics like average monthly revenue, ADR, and occupancy rates in surrounding areas to understand the broader regional STR landscape.
| Market | Active Properties | Monthly Revenue | Daily Rate | Avg. Occupancy |
|---|---|---|---|---|
| Abu Sir | 14 | $1,989 | $192.06 | 20% |
| Al Gabalayah | 41 | $1,013 | $87.84 | 39% |
| Abu Al Feda | 126 | $973 | $108.45 | 44% |
| Mohammed Mazhar | 141 | $863 | $99.84 | 40% |
| Omar Al Khayam | 26 | $827 | $105.68 | 42% |
| Abu Al Feda | 38 | $802 | $99.09 | 39% |
| Zamalek | 84 | $710 | $82.90 | 41% |
| El Ain Bay Resort | 31 | $629 | $165.50 | 23% |
| October Hills | 40 | $608 | $113.98 | 32% |
| El Nada Compound | 10 | $528 | $109.28 | 29% |