Østerby Havn Airbnb Market Analysis 2025: Short Term Rental Data & Vacation Rental Statistics in North Denmark Region, Denmark
Is Airbnb profitable in Østerby Havn in 2025? Explore comprehensive Airbnb analytics for Østerby Havn, North Denmark Region, Denmark to uncover income potential. This 2025 STR market report for Østerby Havn, based on AirROI data from June 2024 to May 2025, reveals key trends in the niche market of 30 active listings.
Whether you're considering an Airbnb investment in Østerby Havn, optimizing your existing vacation rental, or exploring rental arbitrage opportunities, understanding the Østerby Havn Airbnb data is crucial. Leveraging the low regulation environment is key to maximizing your short term rental income potential. Let's dive into the specifics.
Key Østerby Havn Airbnb Performance Metrics Overview
Monthly Airbnb Revenue Variations & Income Potential in Østerby Havn (2025)
Understanding the monthly revenue variations for Airbnb listings in Østerby Havn is key to maximizing your short term rental income potential. Seasonality significantly impacts earnings. Our analysis, based on data from the past 12 months, shows that the peak revenue month for STRs in Østerby Havn is typically July, while June often presents the lowest earnings, highlighting opportunities for strategic pricing adjustments during shoulder and low seasons. Explore the typical Airbnb income in Østerby Havn across different performance tiers:
- Best-in-class properties (Top 10%) achieve $5,497+ monthly, often utilizing dynamic pricing and superior guest experiences.
- Strong performing properties (Top 25%) earn $4,131 or more, indicating effective management and desirable locations/amenities.
- Typical properties (Median) generate around $2,728 per month, representing the average market performance.
- Entry-level properties (Bottom 25%) see earnings around $1,284, often with potential for optimization.
Average Monthly Airbnb Earnings Trend in Østerby Havn
Østerby Havn Airbnb Occupancy Rate Trends (2025)
Maximize your bookings by understanding the Østerby Havn STR occupancy trends. Seasonal demand shifts significantly influence how often properties are booked. Typically, Julysees the highest demand (peak season occupancy), while January experiences the lowest (low season). Effective strategies, like adjusting minimum stays or offering promotions, can boost occupancy during slower periods. Here's how different property tiers perform in Østerby Havn:
- Best-in-class properties (Top 10%) achieve 47%+ occupancy, indicating high desirability and potentially optimized availability.
- Strong performing properties (Top 25%) maintain 36% or higher occupancy, suggesting good market fit and guest satisfaction.
- Typical properties (Median) have an occupancy rate around 26%.
- Entry-level properties (Bottom 25%) average 17% occupancy, potentially facing higher vacancy.
Average Monthly Occupancy Rate Trend in Østerby Havn
Average Daily Rate (ADR) Airbnb Trends in Østerby Havn (2025)
Effective short term rental pricing strategy in Østerby Havn involves understanding monthly ADR fluctuations. The Average Daily Rate (ADR) for Airbnb in Østerby Havn typically peaks in May and dips lowest during June. Leveraging Airbnb dynamic pricing tools or strategies based on this seasonality can significantly boost revenue. Here's a look at the typical nightly rates achieved:
- Best-in-class properties (Top 10%) command rates of $540+ per night, often due to premium features or locations.
- Strong performing properties (Top 25%) achieve nightly rates of $338 or more.
- Typical properties (Median) charge around $201 per night.
- Entry-level properties (Bottom 25%) earn around $162 per night.
Average Daily Rate (ADR) Trend by Month in Østerby Havn
Get Live Østerby Havn Market Intelligence 👇

Explore Real-time Analytics
Airbnb Seasonality Analysis & Trends in Østerby Havn (2025)
Peak Season (July, February, April)
- Revenue averages $3,931 per month
- Occupancy rates average 36.3%
- Daily rates average $293
Shoulder Season
- Revenue averages $2,909 per month
- Occupancy maintains around 23.7%
- Daily rates hold near $282
Low Season (May, June, September)
- Revenue drops to average $1,820 per month
- Occupancy decreases to average 24.9%
- Daily rates adjust to average $289
Seasonality Insights for Østerby Havn
- The Airbnb seasonality in Østerby Havn shows highly seasonal trends requiring careful strategy. While the sections above show seasonal averages, it's also insightful to look at the extremes:
- During the high season, the absolute peak month showcases Østerby Havn's highest earning potential, with monthly revenues capable of climbing to $4,172, occupancy reaching a high of 49.5%, and ADRs peaking at $324.
- Conversely, the slowest single month of the year, typically falling within the low season, marks the market's lowest point. In this month, revenue might dip to $1,223, occupancy could drop to 16.1%, and ADRs may adjust down to $258.
- Understanding both the seasonal averages and these monthly peaks and troughs in revenue, occupancy, and ADR is crucial for maximizing your Airbnb profit potential in Østerby Havn.
Seasonal Strategies for Maximizing Profit
- Peak Season: Maximize revenue through premium pricing and potentially longer minimum stays. Ensure high availability.
- Low Season: Offer competitive pricing, special promotions (e.g., extended stay discounts), and flexible cancellation policies. Target off-season travelers like remote workers or budget-conscious guests.
- Shoulder Seasons: Implement dynamic pricing that balances peak and low rates. Target weekend travelers or specific events. Offer slightly more flexible terms than peak season.
- Regularly analyze your own performance against these Østerby Havn seasonality benchmarks and adjust your pricing and availability strategy accordingly.
Best Areas for Airbnb Investment in Østerby Havn (2025)
Exploring the top neighborhoods for short-term rentals in Østerby Havn? This section highlights key areas, outlining why they are attractive for hosts and guests, along with notable local attractions. Consider these locations based on your target guest profile and investment strategy.
| Neighborhood / Area | Why Host Here? (Target Guests & Appeal) | Key Attractions & Landmarks |
|---|---|---|
| Østerby Havn Marina | A picturesque marina offering stunning views and boat access. Ideal for guests looking to enjoy water activities and the tranquility of the harbor atmosphere. | Østerby Havn, Marina Activities, Fishing Trips, Sailing Excursions, Delicious Seafood Restaurants |
| North Sea Beach | A scenic beach area known for its sandy shores and natural beauty. Popular among families, couples, and nature lovers seeking a relaxing getaway by the sea. | North Sea Beach, Wildlife Areas, Beach Sports, Sunset Viewing Points, Dune Landscapes |
| Hirtshals | A charming coastal town famous for its ferry connections and quaint atmosphere. Attracts tourists heading to Norway and those interested in local history and culture. | Hirtshals Lighthouse, Nordsøen Oceanarium, Hirtshals Museum, Local Shops and Restaurants |
| Skagen | Known for its unique light and artistic heritage, Skagen is a favorite spot among artists and history enthusiasts, offering beautiful beaches and a vibrant cultural scene. | Grenen Beach, Skagen Museum, Anchers Hus, Skagen Odde Nature Centre |
| Børglum Abbey | A historic site with deep roots in Danish culture and history, Børglum Abbey is great for guests interested in heritage and Nordic history. | Børglum Abbey, Historic Exhibitions, Guided Tours, Cultural Events |
| Løkken | A lively beach town famous for its beach activities and summer events, attracting tourists looking for a fun and vibrant coastal vacation. | Løkken Beach, Surfing Schools, Beach Volleyball, Local Markets and Fairs |
| Blokhus | A family-friendly resort area with beautiful beaches and family-oriented attractions. Perfect for guests with children and those seeking outdoor activities. | Blokhus Beach, Family Fun Park, Cycling Trails, Beach Promenade |
| Anholt Island | An unspoiled island ideal for eco-tourism and nature experiences. Attracts guests interested in hiking, bird watching, and peaceful retreats. | Anholt Nature Reserve, Beaches, Cycling Routes, Kite Surfing, Wildlife Spotting |
Understanding Airbnb License Requirements & STR Laws in Østerby Havn (2025)
While Østerby Havn, North Denmark Region, Denmark currently shows low STR regulations, specific Airbnb license requirements might still exist or change. Always verify the latest short term rental regulations and Airbnb license requirements directly with local government authorities for Østerby Havn to ensure full compliance before hosting.
(Source: AirROI data, 2025, based on 3% licensed listings)
Top Performing Airbnb Properties in Østerby Havn (2025)
Benchmark your potential! Explore examples of top-performing Airbnb properties in Østerby Havnbased on Trailing Twelve Month (TTM) revenue. Analyze their characteristics, revenue, occupancy rate, and ADR to understand what drives success in this market.

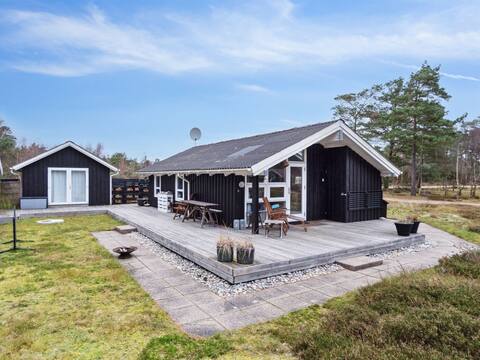
"Alf" - 200m from the sea by Interhome
Entire Place • 4 bedrooms
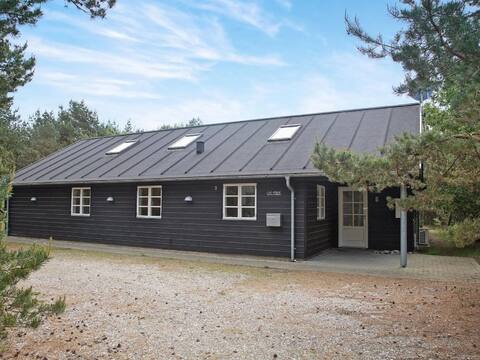
"Pauliina" - 500m from the sea by Interhome
Entire Place • 3 bedrooms

"Ellie" - 300m from the sea by Interhome
Entire Place • 3 bedrooms
"Beka" - 500m from the sea by Interhome
Entire Place • 3 bedrooms

Beautiful summerhouse in bright Nordic style, 300m from the sea
Entire Place • 3 bedrooms

"Kristiina" - 300m from the sea by Interhome
Entire Place • 2 bedrooms
Note: Performance varies based on location, size, amenities, seasonality, and management quality. Data reflects the past 12 months.
Top Performing Airbnb Hosts in Østerby Havn (2025)
Learn from the best! This table showcases top-performing Airbnb hosts in Østerby Havn based on the number of properties managed and estimated total revenue over the past year. Analyze their scale and performance metrics.
| Host Name | Properties | Grossing Revenue | Stay Reviews | Avg Rating |
|---|---|---|---|---|
| Maike - Interhome | 11 | $163,624 | 0 | N/A/5.0 |
| Daniela - Interhome | 3 | $44,777 | 0 | N/A/5.0 |
| Signe - DANCENTER | 5 | $25,223 | 17 | 4.39/5.0 |
| Bodil | 1 | $21,231 | 46 | 4.91/5.0 |
| Host #502442155 | 1 | $18,124 | 0 | N/A/5.0 |
| Host #150436424 | 6 | $14,733 | 0 | N/A/5.0 |
| Inger-Lise | 1 | $7,679 | 34 | 4.62/5.0 |
| Kirsten | 1 | $7,454 | 53 | 4.94/5.0 |
| Karsten Nørregaard | 1 | $6,531 | 18 | 4.94/5.0 |
Analyzing the strategies of top hosts, such as their property selection, pricing, and guest communication, can offer valuable lessons for optimizing your own Airbnb operations in Østerby Havn.
Dive Deeper: Advanced Østerby Havn STR Market Data (2025)
Ready to unlock more insights? AirROI provides access to advanced metrics and comprehensive Airbnb data for Østerby Havn. Explore detailed analytics beyond this report to refine your investment strategy, optimize pricing, and maximize your vacation rental profits.
Explore Advanced MetricsØsterby Havn Short-Term Rental Market Composition (2025): Property & Room Types
Room Type Distribution
Property Type Distribution
Market Composition Insights for Østerby Havn
- The Østerby Havn Airbnb market composition is heavily skewed towards Entire Home/Apt listings, which make up 100% of the 30 active rentals. This indicates strong guest preference for privacy and space.
- Looking at the property type distribution in Østerby Havn, House properties are the most common (90%), reflecting the local real estate landscape.
- Houses represent a significant 90% portion, catering likely to families or larger groups.
- Smaller segments like apartment/condo (combined 3.3%) offer potential for unique stay experiences.
Østerby Havn Airbnb Room Capacity Analysis (2025): Bedroom Distribution
Distribution of Listings by Number of Bedrooms
Room Capacity Insights for Østerby Havn
- The dominant room capacity in Østerby Havn is 3 bedrooms listings, making up 60% of the market. This suggests a strong demand for properties suitable for families or small groups.
- Together, 3 bedrooms and 2 bedrooms properties represent 86.7% of the active Airbnb listings in Østerby Havn, indicating a high concentration in these sizes.
- A significant 73.3% of listings offer 3+ bedrooms, catering to larger groups and families seeking more space in Østerby Havn.
Østerby Havn Vacation Rental Guest Capacity Trends (2025)
Distribution of Listings by Guest Capacity
Guest Capacity Insights for Østerby Havn
- The most common guest capacity trend in Østerby Havn vacation rentals is listings accommodating 6 guests (63.3%). This suggests the primary traveler segment is likely larger groups.
- Properties designed for 6 guests and 8+ guests dominate the Østerby Havn STR market, accounting for 80.0% of listings.
- 80.0% of properties accommodate 6+ guests, serving the market segment for larger families or group travel in Østerby Havn.
- On average, properties in Østerby Havn are equipped to host 5.9 guests.
Østerby Havn Airbnb Booking Patterns (2025): Available vs. Booked Days
Available Days Distribution
Booked Days Distribution
Booking Pattern Insights for Østerby Havn
- The most common availability pattern in Østerby Havn falls within the 271-366 days range, representing 96.7% of listings. This suggests many properties have significant open periods on their calendars.
- Approximately 100.0% of listings show high availability (181+ days open annually), indicating potential for increased bookings or specific owner usage patterns.
- For booked days, the 1-30 days range is most frequent in Østerby Havn (60%), reflecting common guest stay durations or potential owner blocking patterns.
Østerby Havn Airbnb Minimum Stay Requirements Analysis
Distribution of Listings by Minimum Night Requirement
1 Night
16 listings
53.3% of total
2 Nights
1 listings
3.3% of total
3 Nights
3 listings
10% of total
30+ Nights
10 listings
33.3% of total
Key Insights
- The most prevalent minimum stay requirement in Østerby Havn is 1 Night, adopted by 53.3% of listings. This highlights the market's preference for shorter, flexible bookings.
- A significant segment (33.3%) caters to monthly stays (30+ nights) in Østerby Havn, pointing to opportunities in the extended-stay market.
Recommendations
- Align with the market by considering a 1 Night minimum stay, as 53.3% of Østerby Havn hosts use this setting.
- Explore offering discounts for stays of 30+ nights to attract the 33.3% of the market seeking extended stays.
- Adjust minimum nights based on seasonality – potentially shorter during low season and longer during peak demand periods in Østerby Havn.
Østerby Havn Airbnb Cancellation Policy Trends Analysis (2025)
Super Strict 30 Days
1 listings
10% of total
Firm
6 listings
60% of total
Strict
3 listings
30% of total
Cancellation Policy Insights for Østerby Havn
- The prevailing Airbnb cancellation policy trend in Østerby Havn is Firm, used by 60% of listings.
- A majority (90.0%) of hosts in Østerby Havn utilize Firm or Strict policies, indicating a market where hosts prioritize booking security.
Recommendations for Hosts
- Consider adopting a Firm policy to align with the 60% market standard in Østerby Havn.
- Regularly review your cancellation policy against competitors and market demand shifts in Østerby Havn.
Østerby Havn STR Booking Lead Time Analysis (2025)
Average Booking Lead Time by Month
Booking Lead Time Insights for Østerby Havn
- The overall average booking lead time for vacation rentals in Østerby Havn is 57 days.
- Guests book furthest in advance for stays during August (average 112 days), likely coinciding with peak travel demand or local events.
- The shortest booking windows occur for stays in March (average 5 days), indicating more last-minute travel plans during this time.
- Seasonally, Summer (79 days avg.) sees the longest lead times, while Fall (25 days avg.) has the shortest, reflecting typical travel planning cycles.
Recommendations for Hosts
- Use the overall average lead time (57 days) as a baseline for your pricing and availability strategy in Østerby Havn.
- For August stays, consider implementing length-of-stay discounts or slightly higher rates for bookings made less than 112 days out to capitalize on advance planning.
- During March, focus on last-minute booking availability and promotions, as guests book with very short notice (5 days avg.).
- Target marketing efforts for the Summer season well in advance (at least 79 days) to capture early planners.
- Monitor your own booking lead times against these Østerby Havn averages to identify opportunities for dynamic pricing adjustments.
Popular & Essential Airbnb Amenities in Østerby Havn (2025)
Amenity Prevalence
Amenity Insights for Østerby Havn
- Essential amenities in Østerby Havn that guests expect include: Kitchen, TV, Wifi, Heating, Washer, Private entrance, Hangers. Lacking these (any) could significantly impact bookings.
- Popular amenities like Refrigerator, Dishwasher, Dryer are common but not universal. Offering these can provide a competitive edge.
Recommendations for Hosts
- Ensure your listing includes all essential amenities for Østerby Havn: Kitchen, TV, Wifi, Heating, Washer, Private entrance, Hangers.
- Prioritize adding missing essentials: Private entrance, Hangers.
- Consider adding popular differentiators like Refrigerator or Dishwasher to increase appeal.
- Highlight unique or less common amenities you offer (e.g., hot tub, dedicated workspace, EV charger) in your listing description and photos.
- Regularly check competitor amenities in Østerby Havn to stay competitive.
Østerby Havn Airbnb Guest Demographics & Profile Analysis (2025)
Guest Profile Summary for Østerby Havn
- The typical guest profile for Airbnb in Østerby Havn consists of primarily domestic travelers (65%), often arriving from nearby Copenhagen, typically belonging to the Post-2000s (Gen Z/Alpha) group (50%), primarily speaking English or Danish.
- Domestic travelers account for 65.4% of guests.
- Key international markets include Denmark (65.4%) and Germany (15.4%).
- Top languages spoken are English (38.5%) followed by Danish (25.6%).
- A significant demographic segment is the Post-2000s (Gen Z/Alpha) group, representing 50% of guests.
Recommendations for Hosts
- Target domestic marketing efforts towards travelers from Copenhagen and Frederiksberg.
- Tailor amenities and listing descriptions to appeal to the dominant Post-2000s (Gen Z/Alpha) demographic (e.g., highlight fast WiFi, smart home features, local guides).
- Highlight unique local experiences or amenities relevant to the primary guest profile.
- Consider seasonal promotions aligned with peak travel times for key origin markets.
Nearby Short-Term Rental Market Comparison
How does the Østerby Havn Airbnb market stack up against its neighbors? Compare key performance metrics like average monthly revenue, ADR, and occupancy rates in surrounding areas to understand the broader regional STR landscape.
| Market | Active Properties | Monthly Revenue | Daily Rate | Avg. Occupancy |
|---|---|---|---|---|
| Lerums kommun | 38 | $1,848 | $256.07 | 41% |
| Øster Knasborg | 16 | $1,508 | $488.18 | 29% |
| Starrkärr och Näs | 13 | $1,451 | $238.25 | 20% |
| Mölle | 45 | $1,441 | $193.62 | 39% |
| Snekkersten | 24 | $1,437 | $228.25 | 42% |
| Trönningenäs | 17 | $1,437 | $267.81 | 44% |
| Udsholt | 97 | $1,405 | $213.84 | 36% |
| Laröd | 10 | $1,349 | $323.11 | 41% |
| Borås kommun | 43 | $1,349 | $129.26 | 50% |
| Hornbæk | 86 | $1,341 | $249.00 | 41% |