Hals Airbnb Market Analysis 2025: Short Term Rental Data & Vacation Rental Statistics in North Denmark Region, Denmark
Is Airbnb profitable in Hals in 2025? Explore comprehensive Airbnb analytics for Hals, North Denmark Region, Denmark to uncover income potential. This 2025 STR market report for Hals, based on AirROI data from June 2024 to May 2025, reveals key trends in the niche market of 25 active listings.
Whether you're considering an Airbnb investment in Hals, optimizing your existing vacation rental, or exploring rental arbitrage opportunities, understanding the Hals Airbnb data is crucial. Leveraging the low regulation environment is key to maximizing your short term rental income potential. Let's dive into the specifics.
Key Hals Airbnb Performance Metrics Overview
Monthly Airbnb Revenue Variations & Income Potential in Hals (2025)
Understanding the monthly revenue variations for Airbnb listings in Hals is key to maximizing your short term rental income potential. Seasonality significantly impacts earnings. Our analysis, based on data from the past 12 months, shows that the peak revenue month for STRs in Hals is typically July, while January often presents the lowest earnings, highlighting opportunities for strategic pricing adjustments during shoulder and low seasons. Explore the typical Airbnb income in Hals across different performance tiers:
- Best-in-class properties (Top 10%) achieve $3,532+ monthly, often utilizing dynamic pricing and superior guest experiences.
- Strong performing properties (Top 25%) earn $1,959 or more, indicating effective management and desirable locations/amenities.
- Typical properties (Median) generate around $1,153 per month, representing the average market performance.
- Entry-level properties (Bottom 25%) see earnings around $562, often with potential for optimization.
Average Monthly Airbnb Earnings Trend in Hals
Hals Airbnb Occupancy Rate Trends (2025)
Maximize your bookings by understanding the Hals STR occupancy trends. Seasonal demand shifts significantly influence how often properties are booked. Typically, Julysees the highest demand (peak season occupancy), while March experiences the lowest (low season). Effective strategies, like adjusting minimum stays or offering promotions, can boost occupancy during slower periods. Here's how different property tiers perform in Hals:
- Best-in-class properties (Top 10%) achieve 52%+ occupancy, indicating high desirability and potentially optimized availability.
- Strong performing properties (Top 25%) maintain 31% or higher occupancy, suggesting good market fit and guest satisfaction.
- Typical properties (Median) have an occupancy rate around 22%.
- Entry-level properties (Bottom 25%) average 11% occupancy, potentially facing higher vacancy.
Average Monthly Occupancy Rate Trend in Hals
Average Daily Rate (ADR) Airbnb Trends in Hals (2025)
Effective short term rental pricing strategy in Hals involves understanding monthly ADR fluctuations. The Average Daily Rate (ADR) for Airbnb in Hals typically peaks in May and dips lowest during November. Leveraging Airbnb dynamic pricing tools or strategies based on this seasonality can significantly boost revenue. Here's a look at the typical nightly rates achieved:
- Best-in-class properties (Top 10%) command rates of $323+ per night, often due to premium features or locations.
- Strong performing properties (Top 25%) achieve nightly rates of $251 or more.
- Typical properties (Median) charge around $186 per night.
- Entry-level properties (Bottom 25%) earn around $115 per night.
Average Daily Rate (ADR) Trend by Month in Hals
Get Live Hals Market Intelligence 👇

Explore Real-time Analytics
Airbnb Seasonality Analysis & Trends in Hals (2025)
Peak Season (July, April, May)
- Revenue averages $2,259 per month
- Occupancy rates average 35.2%
- Daily rates average $232
Shoulder Season
- Revenue averages $1,464 per month
- Occupancy maintains around 22.7%
- Daily rates hold near $164
Low Season (January, February, December)
- Revenue drops to average $695 per month
- Occupancy decreases to average 18.6%
- Daily rates adjust to average $204
Seasonality Insights for Hals
- The Airbnb seasonality in Hals shows highly seasonal trends requiring careful strategy. While the sections above show seasonal averages, it's also insightful to look at the extremes:
- During the high season, the absolute peak month showcases Hals's highest earning potential, with monthly revenues capable of climbing to $2,429, occupancy reaching a high of 46.6%, and ADRs peaking at $278.
- Conversely, the slowest single month of the year, typically falling within the low season, marks the market's lowest point. In this month, revenue might dip to $404, occupancy could drop to 8.1%, and ADRs may adjust down to $140.
- Understanding both the seasonal averages and these monthly peaks and troughs in revenue, occupancy, and ADR is crucial for maximizing your Airbnb profit potential in Hals.
Seasonal Strategies for Maximizing Profit
- Peak Season: Maximize revenue through premium pricing and potentially longer minimum stays. Ensure high availability.
- Low Season: Offer competitive pricing, special promotions (e.g., extended stay discounts), and flexible cancellation policies. Target off-season travelers like remote workers or budget-conscious guests.
- Shoulder Seasons: Implement dynamic pricing that balances peak and low rates. Target weekend travelers or specific events. Offer slightly more flexible terms than peak season.
- Regularly analyze your own performance against these Hals seasonality benchmarks and adjust your pricing and availability strategy accordingly.
Best Areas for Airbnb Investment in Hals (2025)
Exploring the top neighborhoods for short-term rentals in Hals? This section highlights key areas, outlining why they are attractive for hosts and guests, along with notable local attractions. Consider these locations based on your target guest profile and investment strategy.
| Neighborhood / Area | Why Host Here? (Target Guests & Appeal) | Key Attractions & Landmarks |
|---|---|---|
| Hals Harbor | A picturesque harbor area great for boating enthusiasts and visitors looking for scenic views. It serves as a hub for various water activities and local dining options, making it appealing for tourists. | Hals Marina, The Fish Market, Hals Church, Hals Beach, Local restaurants and cafés |
| Hals Beach | Popular for its beautiful sandy shores and family-friendly atmosphere. Ideal for summer vacationers looking to enjoy beach activities and relaxation. | Hals Strand, Water sports and activities, Beach cafes, Walking and biking trails, Coastal nature |
| Outdoor Activities | Close to nature with plenty of options for hiking, biking, and other outdoor sports. It's a popular spot for nature lovers and adds a lot of value for eco-tourism. | The National Park, Local bike trails, Fishing spots, Nature reserves, Kayaking opportunities |
| Historical Sites | Rich in history with several landmarks and historical sites. Great for cultural tourism and attracting guests interested in history and local heritage. | Hals Museum, Local historic buildings, Cultural festivals, Guided historical tours, Nearby castles |
| Cafes and Dining | The area boasts a variety of local dining experiences from traditional Danish cuisine to modern cafes. It attracts food enthusiasts and tourists looking for local culinary experiences. | Local coffee shops, Seafood restaurants, Bakeries, Food festivals, Culinary tours |
| Shopping District | Offers unique shops and boutiques, providing both local crafts and popular Danish brands. Perfect for tourists looking to shop for souvenirs or special gifts. | Local artisan shops, Souvenir stores, Seasonal markets, Pop-up shops, Craft fairs |
| Family Activities | A great place for family-oriented activities including amusement parks, playgrounds, and excursions. Attracts families looking for fun and safe environments. | Amusement park, Play areas for kids, Family-friendly events, Outdoor sporting facilities, Cultural workshops |
| Wellness Retreats | Known for wellness and spa options, attracting guests looking for relaxation and rejuvenation. It's ideal for those seeking a tranquil getaway. | Spas and wellness centers, Yoga retreats, Nature walks, Health-focused restaurants, Meditation workshops |
Understanding Airbnb License Requirements & STR Laws in Hals (2025)
While Hals, North Denmark Region, Denmark currently shows low STR regulations, specific Airbnb license requirements might still exist or change. Always verify the latest short term rental regulations and Airbnb license requirements directly with local government authorities for Hals to ensure full compliance before hosting.
(Source: AirROI data, 2025, based on 4% licensed listings)
Top Performing Airbnb Properties in Hals (2025)
Benchmark your potential! Explore examples of top-performing Airbnb properties in Halsbased on Trailing Twelve Month (TTM) revenue. Analyze their characteristics, revenue, occupancy rate, and ADR to understand what drives success in this market.

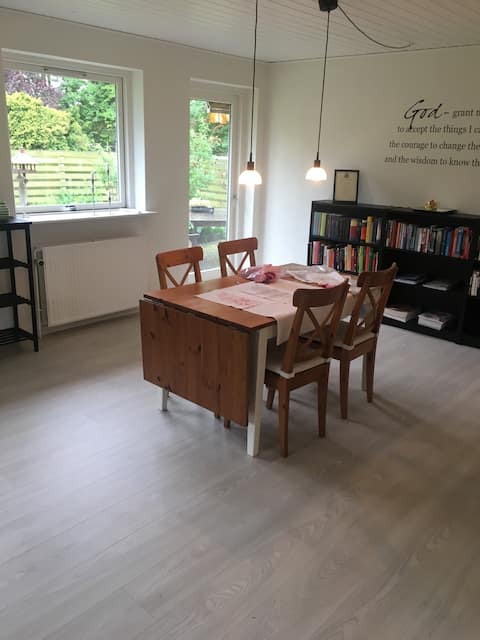
Large house with child-friendly garden
Entire Place • 6 bedrooms
House in Denmark
Entire Place • 1 bedroom

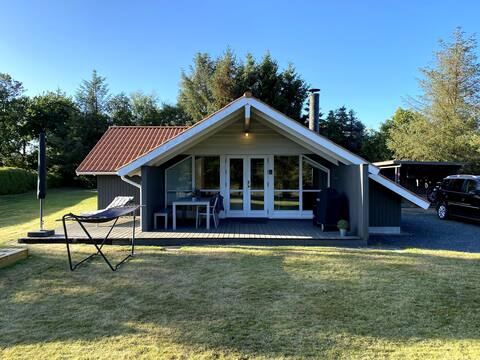
8 person holiday home in hals
Entire Place • 2 bedrooms

"Nandolf" - 650m from the sea by Interhome
Entire Place • 3 bedrooms
Cozy cottage by Hals
Entire Place • 2 bedrooms

"Franzisca" - 600m from the sea by Interhome
Entire Place • 4 bedrooms
Note: Performance varies based on location, size, amenities, seasonality, and management quality. Data reflects the past 12 months.
Top Performing Airbnb Hosts in Hals (2025)
Learn from the best! This table showcases top-performing Airbnb hosts in Hals based on the number of properties managed and estimated total revenue over the past year. Analyze their scale and performance metrics.
| Host Name | Properties | Grossing Revenue | Stay Reviews | Avg Rating |
|---|---|---|---|---|
| Nora - DANCENTER | 7 | $27,219 | 34 | 4.37/5.0 |
| Host #118498296 | 2 | $21,259 | 0 | N/A/5.0 |
| Maria | 1 | $17,797 | 14 | 4.71/5.0 |
| Ditte | 1 | $16,636 | 63 | 4.44/5.0 |
| Host #150440142 | 1 | $16,152 | 0 | N/A/5.0 |
| Anders | 1 | $14,912 | 113 | 4.88/5.0 |
| Host #118498500 | 1 | $8,532 | 0 | N/A/5.0 |
| Kristina | 1 | $8,516 | 14 | 4.50/5.0 |
| Host #33706366 | 2 | $7,366 | 0 | N/A/5.0 |
| Henrik | 1 | $4,719 | 23 | 4.48/5.0 |
Analyzing the strategies of top hosts, such as their property selection, pricing, and guest communication, can offer valuable lessons for optimizing your own Airbnb operations in Hals.
Dive Deeper: Advanced Hals STR Market Data (2025)
Ready to unlock more insights? AirROI provides access to advanced metrics and comprehensive Airbnb data for Hals. Explore detailed analytics beyond this report to refine your investment strategy, optimize pricing, and maximize your vacation rental profits.
Explore Advanced MetricsHals Short-Term Rental Market Composition (2025): Property & Room Types
Room Type Distribution
Property Type Distribution
Market Composition Insights for Hals
- The Hals Airbnb market composition is heavily skewed towards Entire Home/Apt listings, which make up 96% of the 25 active rentals. This indicates strong guest preference for privacy and space.
- Looking at the property type distribution in Hals, House properties are the most common (88%), reflecting the local real estate landscape.
- Houses represent a significant 88% portion, catering likely to families or larger groups.
- Smaller segments like apartment/condo (combined 4.0%) offer potential for unique stay experiences.
Hals Airbnb Room Capacity Analysis (2025): Bedroom Distribution
Distribution of Listings by Number of Bedrooms
Room Capacity Insights for Hals
- The dominant room capacity in Hals is 3 bedrooms listings, making up 52% of the market. This suggests a strong demand for properties suitable for families or small groups.
- Together, 3 bedrooms and 2 bedrooms properties represent 76.0% of the active Airbnb listings in Hals, indicating a high concentration in these sizes.
- A significant 72.0% of listings offer 3+ bedrooms, catering to larger groups and families seeking more space in Hals.
Hals Vacation Rental Guest Capacity Trends (2025)
Distribution of Listings by Guest Capacity
Guest Capacity Insights for Hals
- The most common guest capacity trend in Hals vacation rentals is listings accommodating 8+ guests (36%). This suggests the primary traveler segment is likely larger groups.
- Properties designed for 8+ guests and 6 guests dominate the Hals STR market, accounting for 64.0% of listings.
- 68.0% of properties accommodate 6+ guests, serving the market segment for larger families or group travel in Hals.
- On average, properties in Hals are equipped to host 6.2 guests.
Hals Airbnb Booking Patterns (2025): Available vs. Booked Days
Available Days Distribution
Booked Days Distribution
Booking Pattern Insights for Hals
- The most common availability pattern in Hals falls within the 271-366 days range, representing 88% of listings. This suggests many properties have significant open periods on their calendars.
- Approximately 96.0% of listings show high availability (181+ days open annually), indicating potential for increased bookings or specific owner usage patterns.
- For booked days, the 1-30 days range is most frequent in Hals (56%), reflecting common guest stay durations or potential owner blocking patterns.
- A notable 4.0% of properties secure long booking periods (181+ days booked per year), highlighting successful long-term rental strategies or significant owner usage.
Hals Airbnb Minimum Stay Requirements Analysis
Distribution of Listings by Minimum Night Requirement
1 Night
7 listings
30.4% of total
2 Nights
6 listings
26.1% of total
3 Nights
3 listings
13% of total
4-6 Nights
1 listings
4.3% of total
30+ Nights
6 listings
26.1% of total
Key Insights
- The most prevalent minimum stay requirement in Hals is 1 Night, adopted by 30.4% of listings. This highlights the market's preference for shorter, flexible bookings.
- A significant segment (26.1%) caters to monthly stays (30+ nights) in Hals, pointing to opportunities in the extended-stay market.
Recommendations
- Align with the market by considering a 1 Night minimum stay, as 30.4% of Hals hosts use this setting.
- Explore offering discounts for stays of 30+ nights to attract the 26.1% of the market seeking extended stays.
- Adjust minimum nights based on seasonality – potentially shorter during low season and longer during peak demand periods in Hals.
Hals Airbnb Cancellation Policy Trends Analysis (2025)
Flexible
4 listings
22.2% of total
Moderate
4 listings
22.2% of total
Firm
9 listings
50% of total
Strict
1 listings
5.6% of total
Cancellation Policy Insights for Hals
- The prevailing Airbnb cancellation policy trend in Hals is Firm, used by 50% of listings.
- A majority (55.6%) of hosts in Hals utilize Firm or Strict policies, indicating a market where hosts prioritize booking security.
- Strict cancellation policies are quite rare (5.6%), potentially making listings with this policy less competitive unless justified by high demand or property type.
Recommendations for Hosts
- Consider adopting a Firm policy to align with the 50% market standard in Hals.
- Using a Strict policy might deter some guests, as only 5.6% of listings use it. Evaluate if potential revenue protection outweighs possible lower booking rates.
- Regularly review your cancellation policy against competitors and market demand shifts in Hals.
Hals STR Booking Lead Time Analysis (2025)
Average Booking Lead Time by Month
Booking Lead Time Insights for Hals
- The overall average booking lead time for vacation rentals in Hals is 42 days.
- Guests book furthest in advance for stays during June (average 79 days), likely coinciding with peak travel demand or local events.
- The shortest booking windows occur for stays in October (average 30 days), indicating more last-minute travel plans during this time.
- Seasonally, Summer (74 days avg.) sees the longest lead times, while Fall (36 days avg.) has the shortest, reflecting typical travel planning cycles.
Recommendations for Hosts
- Use the overall average lead time (42 days) as a baseline for your pricing and availability strategy in Hals.
- For June stays, consider implementing length-of-stay discounts or slightly higher rates for bookings made less than 79 days out to capitalize on advance planning.
- Target marketing efforts for the Summer season well in advance (at least 74 days) to capture early planners.
- Monitor your own booking lead times against these Hals averages to identify opportunities for dynamic pricing adjustments.
Popular & Essential Airbnb Amenities in Hals (2025)
Amenity Prevalence
Amenity Insights for Hals
- Essential amenities in Hals that guests expect include: Wifi, TV, Kitchen. Lacking these (any) could significantly impact bookings.
- Popular amenities like Heating, Washer, Dishwasher are common but not universal. Offering these can provide a competitive edge.
Recommendations for Hosts
- Ensure your listing includes all essential amenities for Hals: Wifi, TV, Kitchen.
- Prioritize adding missing essentials: Kitchen.
- Consider adding popular differentiators like Heating or Washer to increase appeal.
- Highlight unique or less common amenities you offer (e.g., hot tub, dedicated workspace, EV charger) in your listing description and photos.
- Regularly check competitor amenities in Hals to stay competitive.
Hals Airbnb Guest Demographics & Profile Analysis (2025)
Guest Profile Summary for Hals
- The typical guest profile for Airbnb in Hals consists of a mix of domestic (38%) and international guests, with top international origins including Germany, typically belonging to the Post-2000s (Gen Z/Alpha) group (50%), primarily speaking English or German.
- Domestic travelers account for 37.8% of guests.
- Key international markets include Denmark (37.8%) and Germany (27%).
- Top languages spoken are English (36.4%) followed by German (21.2%).
- A significant demographic segment is the Post-2000s (Gen Z/Alpha) group, representing 50% of guests.
Recommendations for Hosts
- Focus marketing internationally, particularly towards travelers from Germany.
- Tailor amenities and listing descriptions to appeal to the dominant Post-2000s (Gen Z/Alpha) demographic (e.g., highlight fast WiFi, smart home features, local guides).
- Highlight unique local experiences or amenities relevant to the primary guest profile.
- Consider seasonal promotions aligned with peak travel times for key origin markets.
Nearby Short-Term Rental Market Comparison
How does the Hals Airbnb market stack up against its neighbors? Compare key performance metrics like average monthly revenue, ADR, and occupancy rates in surrounding areas to understand the broader regional STR landscape.
| Market | Active Properties | Monthly Revenue | Daily Rate | Avg. Occupancy |
|---|---|---|---|---|
| Sunds | 16 | $1,571 | $159.90 | 45% |
| Øster Knasborg | 16 | $1,508 | $488.18 | 29% |
| Starrkärr och Näs | 13 | $1,451 | $238.25 | 20% |
| Nederby | 15 | $1,397 | $251.96 | 29% |
| Blokhus | 77 | $1,383 | $343.63 | 31% |
| Skagen | 437 | $1,331 | $316.19 | 31% |
| Løkken | 213 | $1,310 | $276.99 | 33% |
| Hagryd-Dala | 12 | $1,265 | $162.56 | 49% |
| Syddjurs Municipality | 614 | $1,231 | $266.42 | 34% |
| Aarhus Municipality | 13 | $1,228 | $174.13 | 43% |