Vrist Airbnb Market Analysis 2025: Short Term Rental Data & Vacation Rental Statistics in Central Denmark Region, Denmark
Is Airbnb profitable in Vrist in 2025? Explore comprehensive Airbnb analytics for Vrist, Central Denmark Region, Denmark to uncover income potential. This 2025 STR market report for Vrist, based on AirROI data from June 2024 to May 2025, reveals key trends in the niche market of 34 active listings.
Whether you're considering an Airbnb investment in Vrist, optimizing your existing vacation rental, or exploring rental arbitrage opportunities, understanding the Vrist Airbnb data is crucial. Leveraging the low regulation environment is key to maximizing your short term rental income potential. Let's dive into the specifics.
Key Vrist Airbnb Performance Metrics Overview
Monthly Airbnb Revenue Variations & Income Potential in Vrist (2025)
Understanding the monthly revenue variations for Airbnb listings in Vrist is key to maximizing your short term rental income potential. Seasonality significantly impacts earnings. Our analysis, based on data from the past 12 months, shows that the peak revenue month for STRs in Vrist is typically July, while November often presents the lowest earnings, highlighting opportunities for strategic pricing adjustments during shoulder and low seasons. Explore the typical Airbnb income in Vrist across different performance tiers:
- Best-in-class properties (Top 10%) achieve $4,476+ monthly, often utilizing dynamic pricing and superior guest experiences.
- Strong performing properties (Top 25%) earn $3,089 or more, indicating effective management and desirable locations/amenities.
- Typical properties (Median) generate around $1,743 per month, representing the average market performance.
- Entry-level properties (Bottom 25%) see earnings around $964, often with potential for optimization.
Average Monthly Airbnb Earnings Trend in Vrist
Vrist Airbnb Occupancy Rate Trends (2025)
Maximize your bookings by understanding the Vrist STR occupancy trends. Seasonal demand shifts significantly influence how often properties are booked. Typically, Junesees the highest demand (peak season occupancy), while November experiences the lowest (low season). Effective strategies, like adjusting minimum stays or offering promotions, can boost occupancy during slower periods. Here's how different property tiers perform in Vrist:
- Best-in-class properties (Top 10%) achieve 66%+ occupancy, indicating high desirability and potentially optimized availability.
- Strong performing properties (Top 25%) maintain 46% or higher occupancy, suggesting good market fit and guest satisfaction.
- Typical properties (Median) have an occupancy rate around 27%.
- Entry-level properties (Bottom 25%) average 18% occupancy, potentially facing higher vacancy.
Average Monthly Occupancy Rate Trend in Vrist
Average Daily Rate (ADR) Airbnb Trends in Vrist (2025)
Effective short term rental pricing strategy in Vrist involves understanding monthly ADR fluctuations. The Average Daily Rate (ADR) for Airbnb in Vrist typically peaks in May and dips lowest during October. Leveraging Airbnb dynamic pricing tools or strategies based on this seasonality can significantly boost revenue. Here's a look at the typical nightly rates achieved:
- Best-in-class properties (Top 10%) command rates of $472+ per night, often due to premium features or locations.
- Strong performing properties (Top 25%) achieve nightly rates of $353 or more.
- Typical properties (Median) charge around $207 per night.
- Entry-level properties (Bottom 25%) earn around $137 per night.
Average Daily Rate (ADR) Trend by Month in Vrist
Get Live Vrist Market Intelligence 👇

Explore Real-time Analytics
Airbnb Seasonality Analysis & Trends in Vrist (2025)
Peak Season (July, March, June)
- Revenue averages $3,126 per month
- Occupancy rates average 58.8%
- Daily rates average $257
Shoulder Season
- Revenue averages $2,369 per month
- Occupancy maintains around 28.7%
- Daily rates hold near $266
Low Season (April, October, November)
- Revenue drops to average $1,463 per month
- Occupancy decreases to average 22.9%
- Daily rates adjust to average $253
Seasonality Insights for Vrist
- The Airbnb seasonality in Vrist shows highly seasonal trends requiring careful strategy. While the sections above show seasonal averages, it's also insightful to look at the extremes:
- During the high season, the absolute peak month showcases Vrist's highest earning potential, with monthly revenues capable of climbing to $3,702, occupancy reaching a high of 73.3%, and ADRs peaking at $296.
- Conversely, the slowest single month of the year, typically falling within the low season, marks the market's lowest point. In this month, revenue might dip to $936, occupancy could drop to 16.2%, and ADRs may adjust down to $235.
- Understanding both the seasonal averages and these monthly peaks and troughs in revenue, occupancy, and ADR is crucial for maximizing your Airbnb profit potential in Vrist.
Seasonal Strategies for Maximizing Profit
- Peak Season: Maximize revenue through premium pricing and potentially longer minimum stays. Ensure high availability.
- Low Season: Offer competitive pricing, special promotions (e.g., extended stay discounts), and flexible cancellation policies. Target off-season travelers like remote workers or budget-conscious guests.
- Shoulder Seasons: Implement dynamic pricing that balances peak and low rates. Target weekend travelers or specific events. Offer slightly more flexible terms than peak season.
- Regularly analyze your own performance against these Vrist seasonality benchmarks and adjust your pricing and availability strategy accordingly.
Best Areas for Airbnb Investment in Vrist (2025)
Exploring the top neighborhoods for short-term rentals in Vrist? This section highlights key areas, outlining why they are attractive for hosts and guests, along with notable local attractions. Consider these locations based on your target guest profile and investment strategy.
| Neighborhood / Area | Why Host Here? (Target Guests & Appeal) | Key Attractions & Landmarks |
|---|---|---|
| Vrist Strand | Vrist Strand is a picturesque beach location known for its sandy shores and family-friendly atmosphere. It is ideal for summer vacations and attracts tourists looking for a relaxing seaside experience. | Vrist Beach, Klitmøller Surf Spot, Thy National Park, Hanstholm Fisheries and Seaside, Kystmuseum Thy |
| Thyborøn | A charming coastal town with a rich fishing history and access to beautiful beaches. It is popular for families and beach lovers, with various activities available. | Thyborøn Lighthouse, Junkerdal Strand, Thyborøn Havn, Kystcentret, Aqua Nordsø |
| Norsminde | A quaint village with a scenic harbor, perfect for those looking to experience local Danish culture and access to beautiful landscapes and sea views. | Norsminde Kro, Norsminde Harbor, Søndervig Beach, Mols Bjerge National Park, Ferry to Samsø |
| Løkken | A bustling seaside town with a lively beach atmosphere, famous for its beach huts and vibrant summer events. It attracts a large number of tourists every year looking for fun and relaxation. | Løkken Beach, Løkken Rådhus, Rubjerg Knude Lighthouse, Fårup Sommerland, Skallerup Seaside Resort |
| Hirtshals | Known for its ferry connections to Norway and rich maritime culture, Hirtshals offers beautiful beaches and outdoor activities, making it an attractive location for tourists. | Hirtshals Lighthouse, Tropical Oasis, Nordsøen Oceanarium, Hirtshals Beach, Vennebjerg Strand |
| Blokhus | A popular resort town for both relaxation and activities, Blokhus has beautiful beaches and a thriving tourism community, with plenty of restaurants and shops. | Blokhus Beach, Blokhus Aquarium, Fårup Sommerland, Blokhus Sandskulptur Festival, Hune Bunker Museum |
| Skanderborg | A larger town known for Skanderborg Festival, it offers a vibrant cultural scene and recreational activities around the scenic Skanderborg Lake. | Skanderborg Lake, Skanderborg Festival, Lyngsø Strand, Bøgeskov, Skanderborg Museum |
| Aarhus | As the second largest city in Denmark, Aarhus is vibrant and full of life, appealing to business travelers and tourists alike with its mix of old and new attractions. | ARoS Aarhus Art Museum, Den Gamle By, Aarhus Botanical Gardens, Moesgaard Museum, Tivoli Friheden |
Understanding Airbnb License Requirements & STR Laws in Vrist (2025)
While Vrist, Central Denmark Region, Denmark currently shows low STR regulations, specific Airbnb license requirements might still exist or change. Always verify the latest short term rental regulations and Airbnb license requirements directly with local government authorities for Vrist to ensure full compliance before hosting.
(Source: AirROI data, 2025, finding no licensed listings among those analyzed)
Top Performing Airbnb Properties in Vrist (2025)
Benchmark your potential! Explore examples of top-performing Airbnb properties in Vristbased on Trailing Twelve Month (TTM) revenue. Analyze their characteristics, revenue, occupancy rate, and ADR to understand what drives success in this market.

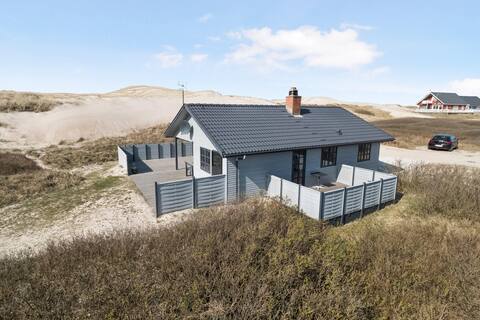
"Damaskin" - 300m from the sea by Interhome
Entire Place • 3 bedrooms
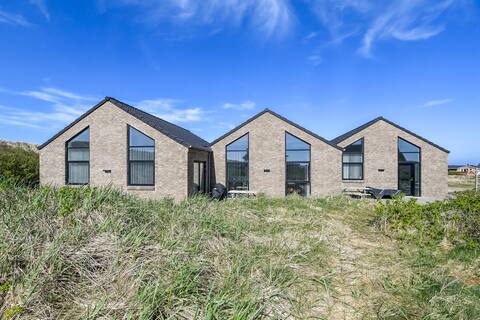
Live right next to the beach at the north sea!
Entire Place • 4 bedrooms

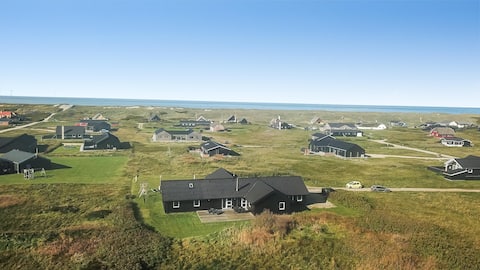
Lovely holiday home in a good location. Close to sea
Entire Place • 3 bedrooms
Newly built luxury house right by the sea - SJ560
Entire Place • 5 bedrooms

"Markku" - 400m from the sea by Interhome
Entire Place • 3 bedrooms
House with pool, spa, and sauna by the sea - SJ220
Entire Place • 9 bedrooms
Note: Performance varies based on location, size, amenities, seasonality, and management quality. Data reflects the past 12 months.
Top Performing Airbnb Hosts in Vrist (2025)
Learn from the best! This table showcases top-performing Airbnb hosts in Vrist based on the number of properties managed and estimated total revenue over the past year. Analyze their scale and performance metrics.
| Host Name | Properties | Grossing Revenue | Stay Reviews | Avg Rating |
|---|---|---|---|---|
| Tommas Reinhold | 8 | $68,950 | 1 | N/A/5.0 |
| Annika - Interhome | 4 | $66,444 | 0 | N/A/5.0 |
| Morten | 1 | $34,725 | 79 | 4.91/5.0 |
| Host #150440142 | 3 | $29,820 | 0 | N/A/5.0 |
| Dima | 1 | $27,532 | 11 | 4.73/5.0 |
| Ella - DANCENTER | 9 | $26,414 | 10 | 4.00/5.0 |
| Uta - Interhome Group | 1 | $13,590 | 0 | N/A/5.0 |
| Martina - Interhome | 2 | $11,339 | 0 | N/A/5.0 |
| Host #100841206 | 1 | $10,188 | 0 | N/A/5.0 |
| Maike - Interhome | 3 | $6,280 | 0 | N/A/5.0 |
Analyzing the strategies of top hosts, such as their property selection, pricing, and guest communication, can offer valuable lessons for optimizing your own Airbnb operations in Vrist.
Dive Deeper: Advanced Vrist STR Market Data (2025)
Ready to unlock more insights? AirROI provides access to advanced metrics and comprehensive Airbnb data for Vrist. Explore detailed analytics beyond this report to refine your investment strategy, optimize pricing, and maximize your vacation rental profits.
Explore Advanced MetricsVrist Short-Term Rental Market Composition (2025): Property & Room Types
Room Type Distribution
Property Type Distribution
Market Composition Insights for Vrist
- The Vrist Airbnb market composition is heavily skewed towards Entire Home/Apt listings, which make up 100% of the 34 active rentals. This indicates strong guest preference for privacy and space.
- Looking at the property type distribution in Vrist, House properties are the most common (97.1%), reflecting the local real estate landscape.
- Houses represent a significant 97.1% portion, catering likely to families or larger groups.
- Smaller segments like outdoor/unique (combined 2.9%) offer potential for unique stay experiences.
Vrist Airbnb Room Capacity Analysis (2025): Bedroom Distribution
Distribution of Listings by Number of Bedrooms
Room Capacity Insights for Vrist
- The dominant room capacity in Vrist is 3 bedrooms listings, making up 47.1% of the market. This suggests a strong demand for properties suitable for families or small groups.
- Together, 3 bedrooms and 4 bedrooms properties represent 70.6% of the active Airbnb listings in Vrist, indicating a high concentration in these sizes.
- A significant 88.2% of listings offer 3+ bedrooms, catering to larger groups and families seeking more space in Vrist.
Vrist Vacation Rental Guest Capacity Trends (2025)
Distribution of Listings by Guest Capacity
Guest Capacity Insights for Vrist
- The most common guest capacity trend in Vrist vacation rentals is listings accommodating 8+ guests (52.9%). This suggests the primary traveler segment is likely larger groups.
- Properties designed for 8+ guests and 6 guests dominate the Vrist STR market, accounting for 82.3% of listings.
- 85.2% of properties accommodate 6+ guests, serving the market segment for larger families or group travel in Vrist.
- On average, properties in Vrist are equipped to host 6.9 guests.
Vrist Airbnb Booking Patterns (2025): Available vs. Booked Days
Available Days Distribution
Booked Days Distribution
Booking Pattern Insights for Vrist
- The most common availability pattern in Vrist falls within the 271-366 days range, representing 88.2% of listings. This suggests many properties have significant open periods on their calendars.
- Approximately 94.1% of listings show high availability (181+ days open annually), indicating potential for increased bookings or specific owner usage patterns.
- For booked days, the 1-30 days range is most frequent in Vrist (67.6%), reflecting common guest stay durations or potential owner blocking patterns.
- A notable 5.9% of properties secure long booking periods (181+ days booked per year), highlighting successful long-term rental strategies or significant owner usage.
Vrist Airbnb Minimum Stay Requirements Analysis
Distribution of Listings by Minimum Night Requirement
1 Night
14 listings
42.4% of total
2 Nights
7 listings
21.2% of total
3 Nights
1 listings
3% of total
4-6 Nights
1 listings
3% of total
7-29 Nights
1 listings
3% of total
30+ Nights
9 listings
27.3% of total
Key Insights
- The most prevalent minimum stay requirement in Vrist is 1 Night, adopted by 42.4% of listings. This highlights the market's preference for shorter, flexible bookings.
- A strong majority (63.6%) of the Vrist Airbnb data shows acceptance of very short stays (1-2 nights), indicating a dynamic, high-turnover market.
- A significant segment (27.3%) caters to monthly stays (30+ nights) in Vrist, pointing to opportunities in the extended-stay market.
Recommendations
- Align with the market by considering a 1 Night minimum stay, as 42.4% of Vrist hosts use this setting.
- Explore offering discounts for stays of 30+ nights to attract the 27.3% of the market seeking extended stays.
- Adjust minimum nights based on seasonality – potentially shorter during low season and longer during peak demand periods in Vrist.
Vrist Airbnb Cancellation Policy Trends Analysis (2025)
Firm
9 listings
90% of total
Strict
1 listings
10% of total
Cancellation Policy Insights for Vrist
- The prevailing Airbnb cancellation policy trend in Vrist is Firm, used by 90% of listings.
- A majority (100.0%) of hosts in Vrist utilize Firm or Strict policies, indicating a market where hosts prioritize booking security.
Recommendations for Hosts
- Consider adopting a Firm policy to align with the 90% market standard in Vrist.
- Using a Strict policy might deter some guests, as only 10% of listings use it. Evaluate if potential revenue protection outweighs possible lower booking rates.
- Regularly review your cancellation policy against competitors and market demand shifts in Vrist.
Vrist STR Booking Lead Time Analysis (2025)
Average Booking Lead Time by Month
Booking Lead Time Insights for Vrist
- The overall average booking lead time for vacation rentals in Vrist is 50 days.
- Guests book furthest in advance for stays during May (average 104 days), likely coinciding with peak travel demand or local events.
- The shortest booking windows occur for stays in July (average 22 days), indicating more last-minute travel plans during this time.
- Seasonally, Spring (71 days avg.) sees the longest lead times, while Winter (35 days avg.) has the shortest, reflecting typical travel planning cycles.
Recommendations for Hosts
- Use the overall average lead time (50 days) as a baseline for your pricing and availability strategy in Vrist.
- For May stays, consider implementing length-of-stay discounts or slightly higher rates for bookings made less than 104 days out to capitalize on advance planning.
- Target marketing efforts for the Spring season well in advance (at least 71 days) to capture early planners.
- Monitor your own booking lead times against these Vrist averages to identify opportunities for dynamic pricing adjustments.
Popular & Essential Airbnb Amenities in Vrist (2025)
Amenity Prevalence
Amenity Insights for Vrist
- Essential amenities in Vrist that guests expect include: Kitchen, Wifi, Heating, Washer. Lacking these (any) could significantly impact bookings.
- Popular amenities like TV, Dryer, Dishwasher are common but not universal. Offering these can provide a competitive edge.
Recommendations for Hosts
- Ensure your listing includes all essential amenities for Vrist: Kitchen, Wifi, Heating, Washer.
- Prioritize adding missing essentials: Washer.
- Consider adding popular differentiators like TV or Dryer to increase appeal.
- Highlight unique or less common amenities you offer (e.g., hot tub, dedicated workspace, EV charger) in your listing description and photos.
- Regularly check competitor amenities in Vrist to stay competitive.
Vrist Airbnb Guest Demographics & Profile Analysis (2025)
Guest Profile Summary for Vrist
- The typical guest profile for Airbnb in Vrist consists of predominantly international visitors (86%), with top international origins including Denmark, typically belonging to the Post-2000s (Gen Z/Alpha) group (50%), primarily speaking English or German.
- Domestic travelers account for 13.9% of guests.
- Key international markets include Germany (72.2%) and Denmark (13.9%).
- Top languages spoken are English (40.7%) followed by German (35.6%).
- A significant demographic segment is the Post-2000s (Gen Z/Alpha) group, representing 50% of guests.
Recommendations for Hosts
- Focus marketing internationally, particularly towards travelers from Denmark.
- Tailor amenities and listing descriptions to appeal to the dominant Post-2000s (Gen Z/Alpha) demographic (e.g., highlight fast WiFi, smart home features, local guides).
- Highlight unique local experiences or amenities relevant to the primary guest profile.
- Consider seasonal promotions aligned with peak travel times for key origin markets.
Nearby Short-Term Rental Market Comparison
How does the Vrist Airbnb market stack up against its neighbors? Compare key performance metrics like average monthly revenue, ADR, and occupancy rates in surrounding areas to understand the broader regional STR landscape.
| Market | Active Properties | Monthly Revenue | Daily Rate | Avg. Occupancy |
|---|---|---|---|---|
| Husum-Ballum | 18 | $3,657 | $499.10 | 42% |
| Billund | 94 | $1,835 | $181.31 | 49% |
| Sunds | 16 | $1,571 | $159.90 | 45% |
| Fjaltring | 13 | $1,497 | $173.41 | 50% |
| Søndervig | 75 | $1,410 | $316.61 | 29% |
| Nederby | 15 | $1,397 | $251.96 | 29% |
| Blokhus | 77 | $1,383 | $343.63 | 31% |
| Vejle Municipality | 16 | $1,335 | $176.87 | 44% |
| Kelstrup Strand | 28 | $1,324 | $235.52 | 35% |
| Løkken | 213 | $1,310 | $276.99 | 33% |