Tempate Airbnb Market Analysis 2025: Short Term Rental Data & Vacation Rental Statistics in Provincia Guanacaste, Costa Rica
Is Airbnb profitable in Tempate in 2025? Explore comprehensive Airbnb analytics for Tempate, Provincia Guanacaste, Costa Rica to uncover income potential. This 2025 STR market report for Tempate, based on AirROI data from April 2024 to March 2025, reveals key trends in the market of 638 active listings.
Whether you're considering an Airbnb investment in Tempate, optimizing your existing vacation rental, or exploring rental arbitrage opportunities, understanding the Tempate Airbnb data is crucial. Leveraging the low regulation environment is key to maximizing your short term rental income potential. Let's dive into the specifics.
Key Tempate Airbnb Performance Metrics Overview
Monthly Airbnb Revenue Variations & Income Potential in Tempate (2025)
Understanding the monthly revenue variations for Airbnb listings in Tempate is key to maximizing your short term rental income potential. Seasonality significantly impacts earnings. Our analysis, based on data from the past 12 months, shows that the peak revenue month for STRs in Tempate is typically January, while September often presents the lowest earnings, highlighting opportunities for strategic pricing adjustments during shoulder and low seasons. Explore the typical Airbnb income in Tempate across different performance tiers:
- Best-in-class properties (Top 10%) achieve $10,294+ monthly, often utilizing dynamic pricing and superior guest experiences.
- Strong performing properties (Top 25%) earn $5,594 or more, indicating effective management and desirable locations/amenities.
- Typical properties (Median) generate around $2,648 per month, representing the average market performance.
- Entry-level properties (Bottom 25%) see earnings around $1,159, often with potential for optimization.
Average Monthly Airbnb Earnings Trend in Tempate
Tempate Airbnb Occupancy Rate Trends (2025)
Maximize your bookings by understanding the Tempate STR occupancy trends. Seasonal demand shifts significantly influence how often properties are booked. Typically, Januarysees the highest demand (peak season occupancy), while September experiences the lowest (low season). Effective strategies, like adjusting minimum stays or offering promotions, can boost occupancy during slower periods. Here's how different property tiers perform in Tempate:
- Best-in-class properties (Top 10%) achieve 73%+ occupancy, indicating high desirability and potentially optimized availability.
- Strong performing properties (Top 25%) maintain 54% or higher occupancy, suggesting good market fit and guest satisfaction.
- Typical properties (Median) have an occupancy rate around 33%.
- Entry-level properties (Bottom 25%) average 17% occupancy, potentially facing higher vacancy.
Average Monthly Occupancy Rate Trend in Tempate
Average Daily Rate (ADR) Airbnb Trends in Tempate (2025)
Effective short term rental pricing strategy in Tempate involves understanding monthly ADR fluctuations. The Average Daily Rate (ADR) for Airbnb in Tempate typically peaks in December and dips lowest during September. Leveraging Airbnb dynamic pricing tools or strategies based on this seasonality can significantly boost revenue. Here's a look at the typical nightly rates achieved:
- Best-in-class properties (Top 10%) command rates of $855+ per night, often due to premium features or locations.
- Strong performing properties (Top 25%) achieve nightly rates of $403 or more.
- Typical properties (Median) charge around $219 per night.
- Entry-level properties (Bottom 25%) earn around $123 per night.
Average Daily Rate (ADR) Trend by Month in Tempate
Get Live Tempate Market Intelligence 👇

Explore Real-time Analytics
Airbnb Seasonality Analysis & Trends in Tempate (2025)
Peak Season (January, December, February)
- Revenue averages $6,130 per month
- Occupancy rates average 48.4%
- Daily rates average $446
Shoulder Season
- Revenue averages $4,614 per month
- Occupancy maintains around 36.3%
- Daily rates hold near $375
Low Season (August, September, October)
- Revenue drops to average $2,833 per month
- Occupancy decreases to average 28.0%
- Daily rates adjust to average $343
Seasonality Insights for Tempate
- The Airbnb seasonality in Tempate shows highly seasonal trends requiring careful strategy. While the sections above show seasonal averages, it's also insightful to look at the extremes:
- During the high season, the absolute peak month showcases Tempate's highest earning potential, with monthly revenues capable of climbing to $6,794, occupancy reaching a high of 54.9%, and ADRs peaking at $459.
- Conversely, the slowest single month of the year, typically falling within the low season, marks the market's lowest point. In this month, revenue might dip to $2,379, occupancy could drop to 25.9%, and ADRs may adjust down to $341.
- Understanding both the seasonal averages and these monthly peaks and troughs in revenue, occupancy, and ADR is crucial for maximizing your Airbnb profit potential in Tempate.
Seasonal Strategies for Maximizing Profit
- Peak Season: Maximize revenue through premium pricing and potentially longer minimum stays. Ensure high availability.
- Low Season: Offer competitive pricing, special promotions (e.g., extended stay discounts), and flexible cancellation policies. Target off-season travelers like remote workers or budget-conscious guests.
- Shoulder Seasons: Implement dynamic pricing that balances peak and low rates. Target weekend travelers or specific events. Offer slightly more flexible terms than peak season.
- Regularly analyze your own performance against these Tempate seasonality benchmarks and adjust your pricing and availability strategy accordingly.
Best Areas for Airbnb Investment in Tempate (2025)
Exploring the top neighborhoods for short-term rentals in Tempate? This section highlights key areas, outlining why they are attractive for hosts and guests, along with notable local attractions. Consider these locations based on your target guest profile and investment strategy.
| Neighborhood / Area | Why Host Here? (Target Guests & Appeal) | Key Attractions & Landmarks |
|---|---|---|
| Tamarindo | A popular beach town known for surfing, lively nightlife, and beautiful sunsets. It attracts a large number of tourists and is ideal for vacation rentals. | Tamarindo Beach, Playa Grande, Las Baulas National Marine Park, Tamarindo Golf Club, Nightlife and restaurants |
| Playas del Coco | A vibrant beach community with a laid-back atmosphere, popular among locals and expats. Its proximity to the coast makes it a top choice for Airbnb hosting. | Playas del Coco Beach, Diving and snorkeling, Coco Bay, Coco Beach nightlife, Restaurants and shopping |
| Lavarseca | A less-commercialized beach area known for safety and serenity, making it attractive for families seeking peaceful getaways. | Quiet beaches, Natural parks, Local cuisine, Wildlife watching, Cultural experiences |
| Nosara | Famous for its yoga retreats and wellness centers, Nosara draws a health-conscious crowd and surfers alike, enhancing potential for Airbnb rentals. | Nosara Beach, Yoga retreats, Guitar Beach, National Wildlife Refuge, Surfing spots |
| Big Nicoya Peninsula | Blending beaches, jungle, and friendly local communities, this area appeals to tourists looking for adventure and relaxation. | Playa Samara, Playa Carrillo, Wildlife watching, Surf schools, Eco-tourism options |
| Santa Teresa | A bohemian beach town known for surfing, yoga, and wellness retreats, attracting a diverse crowd seeking a laid-back lifestyle. | Santa Teresa Beach, Cabo Blanco Nature Reserve, Surfing spots, Yoga studios, Beachfront restaurants |
| Guanacaste National Park | Rich in biodiversity and scenic views, it attracts nature lovers and adventure seekers, ideal for eco-friendly accommodations. | Hiking trails, Wildlife spotting, Scenic vistas, Eco-tours, Natural hot springs |
| Rincón de la Vieja | An area known for its volcanic activity and rich nature, it attracts tourists looking for adventure and natural beauty, enhancing the potential for rental opportunities. | Rincón de la Vieja Volcano, Hiking and waterfalls, Natural hot springs, Wildlife encounters, Cabins and lodges |
Understanding Airbnb License Requirements & STR Laws in Tempate (2025)
While Tempate, Provincia Guanacaste, Costa Rica currently shows low STR regulations, specific Airbnb license requirements might still exist or change. Always verify the latest short term rental regulations and Airbnb license requirements directly with local government authorities for Tempate to ensure full compliance before hosting.
(Source: AirROI data, 2025, finding no licensed listings among those analyzed)
Top Performing Airbnb Properties in Tempate (2025)
Benchmark your potential! Explore examples of top-performing Airbnb properties in Tempatebased on Trailing Twelve Month (TTM) revenue. Analyze their characteristics, revenue, occupancy rate, and ADR to understand what drives success in this market.
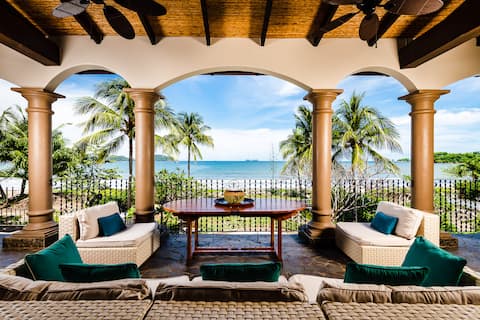
Playa Potrero - impressive 9 Br beachfront villa:
Entire Place • 9 bedrooms
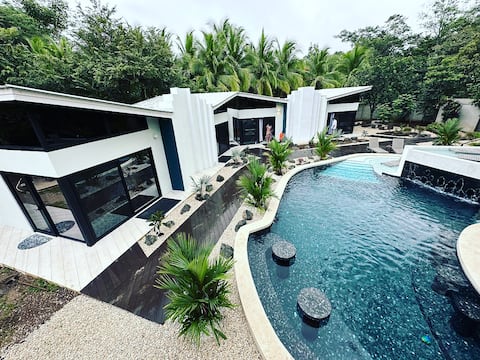
Walk to beach-3 pools-11 bedrooms, tranquil
Entire Place • 11 bedrooms
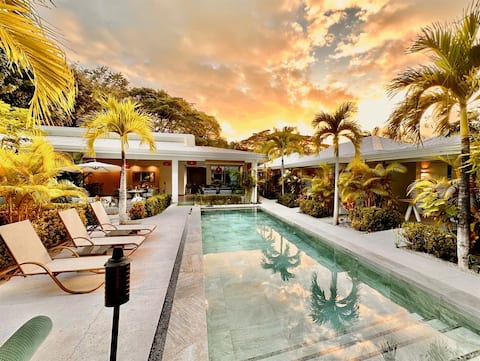
Exclusive Retreats 8 Bedroom Private Resort Villa
Entire Place • 8 bedrooms
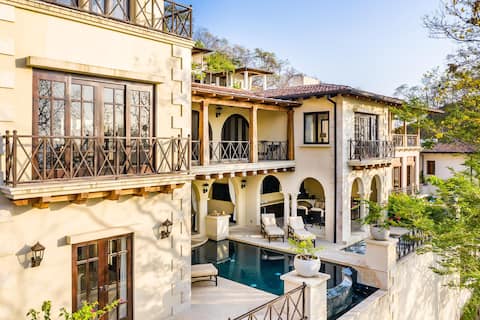
Casa Carolina at Las Catalinas
Entire Place • 5 bedrooms
Beachfront luxe villa, 2 pools 7 BR
Entire Place • 7 bedrooms
Luxury Villa, Pool, Tennis & Pickleball Court
Entire Place • 6 bedrooms
Note: Performance varies based on location, size, amenities, seasonality, and management quality. Data reflects the past 12 months.
Top Performing Airbnb Hosts in Tempate (2025)
Learn from the best! This table showcases top-performing Airbnb hosts in Tempate based on the number of properties managed and estimated total revenue over the past year. Analyze their scale and performance metrics.
| Host Name | Properties | Grossing Revenue | Stay Reviews | Avg Rating |
|---|---|---|---|---|
| Rosa | 63 | $3,549,248 | 515 | 3.27/5.0 |
| Alejandro | 26 | $2,017,381 | 247 | 2.95/5.0 |
| Britta | 23 | $1,855,843 | 189 | 3.56/5.0 |
| Krain Vacation Rentals | 36 | $1,508,336 | 895 | 4.51/5.0 |
| Special Places | 24 | $1,024,154 | 287 | 3.63/5.0 |
| Ocean Lyrics By Five Star | 16 | $664,895 | 668 | 4.73/5.0 |
| Mango | 10 | $463,144 | 180 | 4.41/5.0 |
| Lilian | 9 | $402,734 | 345 | 4.82/5.0 |
| Greg | 3 | $397,749 | 22 | 3.27/5.0 |
| Exclusive | 1 | $317,376 | 15 | 5.00/5.0 |
Analyzing the strategies of top hosts, such as their property selection, pricing, and guest communication, can offer valuable lessons for optimizing your own Airbnb operations in Tempate.
Dive Deeper: Advanced Tempate STR Market Data (2025)
Ready to unlock more insights? AirROI provides access to advanced metrics and comprehensive Airbnb data for Tempate. Explore detailed analytics beyond this report to refine your investment strategy, optimize pricing, and maximize your vacation rental profits.
Explore Advanced MetricsTempate Short-Term Rental Market Composition (2025): Property & Room Types
Room Type Distribution
Property Type Distribution
Market Composition Insights for Tempate
- The Tempate Airbnb market composition is heavily skewed towards Entire Home/Apt listings, which make up 91.7% of the 638 active rentals. This indicates strong guest preference for privacy and space.
- Looking at the property type distribution in Tempate, House properties are the most common (54.9%), reflecting the local real estate landscape.
- Houses represent a significant 54.9% portion, catering likely to families or larger groups.
- Smaller segments like hotel/boutique, outdoor/unique, others, unique stays (combined 10.1%) offer potential for unique stay experiences.
Tempate Airbnb Room Capacity Analysis (2025): Bedroom Distribution
Distribution of Listings by Number of Bedrooms
Room Capacity Insights for Tempate
- The dominant room capacity in Tempate is 1 bedroom listings, making up 28.4% of the market. This suggests a strong demand for properties suitable for couples or solo travelers.
- Together, 1 bedroom and 2 bedrooms properties represent 56.0% of the active Airbnb listings in Tempate, indicating a high concentration in these sizes.
- A significant 40.4% of listings offer 3+ bedrooms, catering to larger groups and families seeking more space in Tempate.
Tempate Vacation Rental Guest Capacity Trends (2025)
Distribution of Listings by Guest Capacity
Guest Capacity Insights for Tempate
- The most common guest capacity trend in Tempate vacation rentals is listings accommodating 8+ guests (26.6%). This suggests the primary traveler segment is likely larger groups.
- Properties designed for 8+ guests and 4 guests dominate the Tempate STR market, accounting for 49.8% of listings.
- 47.4% of properties accommodate 6+ guests, serving the market segment for larger families or group travel in Tempate.
- On average, properties in Tempate are equipped to host 5.1 guests.
Tempate Airbnb Booking Patterns (2025): Available vs. Booked Days
Available Days Distribution
Booked Days Distribution
Booking Pattern Insights for Tempate
- The most common availability pattern in Tempate falls within the 271-366 days range, representing 53.8% of listings. This suggests many properties have significant open periods on their calendars.
- Approximately 82.6% of listings show high availability (181+ days open annually), indicating potential for increased bookings or specific owner usage patterns.
- For booked days, the 31-90 days range is most frequent in Tempate (36.1%), reflecting common guest stay durations or potential owner blocking patterns.
- A notable 18.2% of properties secure long booking periods (181+ days booked per year), highlighting successful long-term rental strategies or significant owner usage.
Tempate Airbnb Minimum Stay Requirements Analysis
Distribution of Listings by Minimum Night Requirement
1 Night
97 listings
16.1% of total
2 Nights
163 listings
27.1% of total
3 Nights
98 listings
16.3% of total
4-6 Nights
27 listings
4.5% of total
7-29 Nights
3 listings
0.5% of total
30+ Nights
213 listings
35.4% of total
Key Insights
- The most prevalent minimum stay requirement in Tempate is 30+ Nights, adopted by 35.4% of listings. This highlights the market's preference for longer commitments.
- A significant segment (35.4%) caters to monthly stays (30+ nights) in Tempate, pointing to opportunities in the extended-stay market.
Recommendations
- Align with the market by considering a 30+ Nights minimum stay, as 35.4% of Tempate hosts use this setting.
- If feasible, allowing 1-night stays, especially midweek or during low season, could capture last-minute bookings, as only 16.1% currently do.
- Explore offering discounts for stays of 30+ nights to attract the 35.4% of the market seeking extended stays.
- Adjust minimum nights based on seasonality – potentially shorter during low season and longer during peak demand periods in Tempate.
Tempate Airbnb Cancellation Policy Trends Analysis (2025)
Refundable
19 listings
3.7% of total
Super Strict 30 Days
22 listings
4.3% of total
Super Strict 60 Days
20 listings
3.9% of total
Non-refundable
21 listings
4.1% of total
Flexible
49 listings
9.6% of total
Moderate
77 listings
15.2% of total
Firm
143 listings
28.1% of total
Strict
157 listings
30.9% of total
Cancellation Policy Insights for Tempate
- The prevailing Airbnb cancellation policy trend in Tempate is Strict, used by 30.9% of listings.
- A majority (59.0%) of hosts in Tempate utilize Firm or Strict policies, indicating a market where hosts prioritize booking security.
Recommendations for Hosts
- Consider adopting a Strict policy to align with the 30.9% market standard in Tempate.
- With 30.9% using Strict terms, this is a viable option in Tempate, particularly for high-value properties or during peak demand periods.
- Regularly review your cancellation policy against competitors and market demand shifts in Tempate.
Tempate STR Booking Lead Time Analysis (2025)
Average Booking Lead Time by Month
Booking Lead Time Insights for Tempate
- The overall average booking lead time for vacation rentals in Tempate is 69 days.
- Guests book furthest in advance for stays during February (average 90 days), likely coinciding with peak travel demand or local events.
- The shortest booking windows occur for stays in September (average 48 days), indicating more last-minute travel plans during this time.
- Seasonally, Winter (83 days avg.) sees the longest lead times, while Fall (59 days avg.) has the shortest, reflecting typical travel planning cycles.
Recommendations for Hosts
- Use the overall average lead time (69 days) as a baseline for your pricing and availability strategy in Tempate.
- For February stays, consider implementing length-of-stay discounts or slightly higher rates for bookings made less than 90 days out to capitalize on advance planning.
- Target marketing efforts for the Winter season well in advance (at least 83 days) to capture early planners.
- Monitor your own booking lead times against these Tempate averages to identify opportunities for dynamic pricing adjustments.
Popular & Essential Airbnb Amenities in Tempate (2025)
Amenity Prevalence
Amenity Insights for Tempate
- Essential amenities in Tempate that guests expect include: Air conditioning, Wifi, TV. Lacking these (any) could significantly impact bookings.
- Popular amenities like Kitchen, Free parking on premises, Essentials are common but not universal. Offering these can provide a competitive edge.
Recommendations for Hosts
- Ensure your listing includes all essential amenities for Tempate: Air conditioning, Wifi, TV.
- Prioritize adding missing essentials: Air conditioning, Wifi, TV.
- Consider adding popular differentiators like Kitchen or Free parking on premises to increase appeal.
- Highlight unique or less common amenities you offer (e.g., hot tub, dedicated workspace, EV charger) in your listing description and photos.
- Regularly check competitor amenities in Tempate to stay competitive.
Tempate Airbnb Guest Demographics & Profile Analysis (2025)
Guest Profile Summary for Tempate
- The typical guest profile for Airbnb in Tempate consists of predominantly international visitors (66%), with top international origins including Costa Rica, typically belonging to the Post-2000s (Gen Z/Alpha) group (50%), primarily speaking English or Spanish.
- Domestic travelers account for 34.3% of guests.
- Key international markets include United States (44.8%) and Costa Rica (34.3%).
- Top languages spoken are English (50.5%) followed by Spanish (33.9%).
- A significant demographic segment is the Post-2000s (Gen Z/Alpha) group, representing 50% of guests.
Recommendations for Hosts
- Focus marketing internationally, particularly towards travelers from Costa Rica.
- Tailor amenities and listing descriptions to appeal to the dominant Post-2000s (Gen Z/Alpha) demographic (e.g., highlight fast WiFi, smart home features, local guides).
- Highlight unique local experiences or amenities relevant to the primary guest profile.
- Consider seasonal promotions aligned with peak travel times for key origin markets.
Nearby Short-Term Rental Market Comparison
How does the Tempate Airbnb market stack up against its neighbors? Compare key performance metrics like average monthly revenue, ADR, and occupancy rates in surrounding areas to understand the broader regional STR landscape.
| Market | Active Properties | Monthly Revenue | Daily Rate | Avg. Occupancy |
|---|---|---|---|---|
| Pinilla | 49 | $6,647 | $580.89 | 37% |
| Tamarindo | 136 | $5,073 | $462.37 | 41% |
| Punta Islita | 30 | $4,595 | $537.15 | 36% |
| Nacascolo | 34 | $4,475 | $1256.07 | 30% |
| Playa Langosta | 154 | $4,432 | $472.13 | 43% |
| Playa Tamarindo | 23 | $4,370 | $365.55 | 44% |
| Tamarindo | 1,021 | $4,120 | $345.13 | 44% |
| Cabo Velas | 852 | $3,462 | $356.16 | 41% |
| Pochomil Viejo | 10 | $3,118 | $356.11 | 26% |
| Nosara | 851 | $3,112 | $380.78 | 40% |