Nosara Airbnb Market Analysis 2025: Short Term Rental Data & Vacation Rental Statistics in Provincia Guanacaste, Costa Rica
Is Airbnb profitable in Nosara in 2025? Explore comprehensive Airbnb analytics for Nosara, Provincia Guanacaste, Costa Rica to uncover income potential. This 2025 STR market report for Nosara, based on AirROI data from April 2024 to March 2025, reveals key trends in the market of 851 active listings.
Whether you're considering an Airbnb investment in Nosara, optimizing your existing vacation rental, or exploring rental arbitrage opportunities, understanding the Nosara Airbnb data is crucial. Leveraging the low regulation environment is key to maximizing your short term rental income potential. Let's dive into the specifics.
Key Nosara Airbnb Performance Metrics Overview
Monthly Airbnb Revenue Variations & Income Potential in Nosara (2025)
Understanding the monthly revenue variations for Airbnb listings in Nosara is key to maximizing your short term rental income potential. Seasonality significantly impacts earnings. Our analysis, based on data from the past 12 months, shows that the peak revenue month for STRs in Nosara is typically January, while September often presents the lowest earnings, highlighting opportunities for strategic pricing adjustments during shoulder and low seasons. Explore the typical Airbnb income in Nosara across different performance tiers:
- Best-in-class properties (Top 10%) achieve $11,933+ monthly, often utilizing dynamic pricing and superior guest experiences.
- Strong performing properties (Top 25%) earn $6,228 or more, indicating effective management and desirable locations/amenities.
- Typical properties (Median) generate around $2,981 per month, representing the average market performance.
- Entry-level properties (Bottom 25%) see earnings around $1,318, often with potential for optimization.
Average Monthly Airbnb Earnings Trend in Nosara
Nosara Airbnb Occupancy Rate Trends (2025)
Maximize your bookings by understanding the Nosara STR occupancy trends. Seasonal demand shifts significantly influence how often properties are booked. Typically, Januarysees the highest demand (peak season occupancy), while September experiences the lowest (low season). Effective strategies, like adjusting minimum stays or offering promotions, can boost occupancy during slower periods. Here's how different property tiers perform in Nosara:
- Best-in-class properties (Top 10%) achieve 78%+ occupancy, indicating high desirability and potentially optimized availability.
- Strong performing properties (Top 25%) maintain 61% or higher occupancy, suggesting good market fit and guest satisfaction.
- Typical properties (Median) have an occupancy rate around 39%.
- Entry-level properties (Bottom 25%) average 19% occupancy, potentially facing higher vacancy.
Average Monthly Occupancy Rate Trend in Nosara
Average Daily Rate (ADR) Airbnb Trends in Nosara (2025)
Effective short term rental pricing strategy in Nosara involves understanding monthly ADR fluctuations. The Average Daily Rate (ADR) for Airbnb in Nosara typically peaks in December and dips lowest during September. Leveraging Airbnb dynamic pricing tools or strategies based on this seasonality can significantly boost revenue. Here's a look at the typical nightly rates achieved:
- Best-in-class properties (Top 10%) command rates of $870+ per night, often due to premium features or locations.
- Strong performing properties (Top 25%) achieve nightly rates of $457 or more.
- Typical properties (Median) charge around $231 per night.
- Entry-level properties (Bottom 25%) earn around $124 per night.
Average Daily Rate (ADR) Trend by Month in Nosara
Get Live Nosara Market Intelligence 👇

Explore Real-time Analytics
Airbnb Seasonality Analysis & Trends in Nosara (2025)
Peak Season (January, December, February)
- Revenue averages $7,061 per month
- Occupancy rates average 53.2%
- Daily rates average $454
Shoulder Season
- Revenue averages $5,030 per month
- Occupancy maintains around 40.3%
- Daily rates hold near $370
Low Season (August, September, October)
- Revenue drops to average $2,709 per month
- Occupancy decreases to average 31.3%
- Daily rates adjust to average $326
Seasonality Insights for Nosara
- The Airbnb seasonality in Nosara shows highly seasonal trends requiring careful strategy. While the sections above show seasonal averages, it's also insightful to look at the extremes:
- During the high season, the absolute peak month showcases Nosara's highest earning potential, with monthly revenues capable of climbing to $7,709, occupancy reaching a high of 56.2%, and ADRs peaking at $470.
- Conversely, the slowest single month of the year, typically falling within the low season, marks the market's lowest point. In this month, revenue might dip to $2,157, occupancy could drop to 28.6%, and ADRs may adjust down to $323.
- Understanding both the seasonal averages and these monthly peaks and troughs in revenue, occupancy, and ADR is crucial for maximizing your Airbnb profit potential in Nosara.
Seasonal Strategies for Maximizing Profit
- Peak Season: Maximize revenue through premium pricing and potentially longer minimum stays. Ensure high availability.
- Low Season: Offer competitive pricing, special promotions (e.g., extended stay discounts), and flexible cancellation policies. Target off-season travelers like remote workers or budget-conscious guests.
- Shoulder Seasons: Implement dynamic pricing that balances peak and low rates. Target weekend travelers or specific events. Offer slightly more flexible terms than peak season.
- Regularly analyze your own performance against these Nosara seasonality benchmarks and adjust your pricing and availability strategy accordingly.
Best Areas for Airbnb Investment in Nosara (2025)
Exploring the top neighborhoods for short-term rentals in Nosara? This section highlights key areas, outlining why they are attractive for hosts and guests, along with notable local attractions. Consider these locations based on your target guest profile and investment strategy.
| Neighborhood / Area | Why Host Here? (Target Guests & Appeal) | Key Attractions & Landmarks |
|---|---|---|
| Playa Guiones | A famous surf beach known for its consistent waves and beautiful sunsets. A hotspot for surfers and beachgoers looking for a relaxed and vibrant atmosphere. | Surfing schools, Yoga retreats, Natural hot springs, Wildlife refuge, Beaches for swimming and sunbathing |
| Playa Pelada | A quieter and less crowded beach compared to its neighbor Playa Guiones. Ideal for families and those seeking tranquility in a picturesque setting. | Secluded beaches, Tide pools, Nature walks, Local eateries, Sunset views |
| Nosara town center | The heart of the Nosara community, offering local shops, restaurants, and access to various amenities. Great for those who want to experience local culture and lifestyle. | Nosara Wildlife Rescue, Local markets, Art galleries, Restaurants and cafes, Cultural events |
| Ostional | Known for the nesting of Olive Ridley sea turtles, attracting ecotourism and nature lovers. A unique and important natural area preserving marine biodiversity. | Turtle nesting tours, Ecotourism activities, Wildlife observation, Stunning beaches, Protected wildlife reserves |
| San Juanillo | A beautiful beach town with pristine waters and an unspoiled atmosphere. It draws those looking for a local vibe and natural beauty. | Beaches for swimming and snorkeling, Local seafood restaurants, Scenic viewpoints, Calm waters, Nature hikes |
| Sámara | A picturesque beach town offering good surf and a family-friendly atmosphere. Known for its vibrant community and array of beach activities. | Surfing and paddleboarding, Beachfront restaurants, Sámara Park, Natural beauty, Wildlife tours |
| Cabo Velas | A tranquil locale surrounded by nature that offers stunning ocean views and opportunities for outdoor activities. Ideal for those seeking relaxation away from the bustle. | Beautiful beaches, Nature reserves, Scenic hiking trails, Fishing activities, Secluded coves |
| Garza | A small fishing village that offers a glimpse into local life. Popular for its laid-back vibe and great for fishing and marine activities. | Fishing and boat tours, Beach relaxation, Local cultural experiences, Scenic views, Restaurants serving fresh seafood |
Understanding Airbnb License Requirements & STR Laws in Nosara (2025)
While Nosara, Provincia Guanacaste, Costa Rica currently shows low STR regulations, specific Airbnb license requirements might still exist or change. Always verify the latest short term rental regulations and Airbnb license requirements directly with local government authorities for Nosara to ensure full compliance before hosting.
(Source: AirROI data, 2025, based on 0% licensed listings)
Top Performing Airbnb Properties in Nosara (2025)
Benchmark your potential! Explore examples of top-performing Airbnb properties in Nosarabased on Trailing Twelve Month (TTM) revenue. Analyze their characteristics, revenue, occupancy rate, and ADR to understand what drives success in this market.
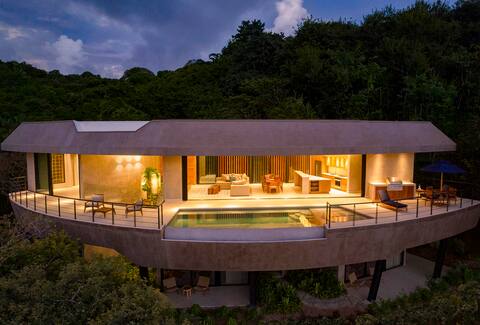
Ansui House Nosara
Entire Place • 4 bedrooms
Exclusive Modern Luxurious villa w/ infinity pool!
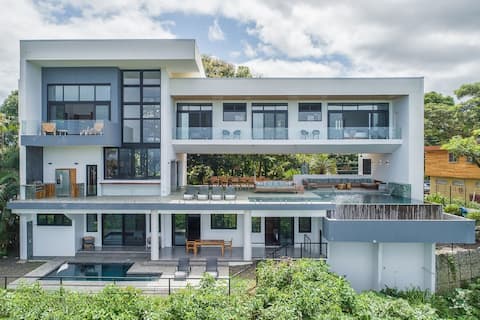
Entire Place • 7 bedrooms

Perfect for large groups - Ocean Breeze Nosara
Entire Place • 10 bedrooms

Villa CXC Luxury Sanctuary
Entire Place • 5 bedrooms

Beachfront Nosara Villa
Entire Place • 7 bedrooms

La Musa de la Jungla K Section
Entire Place • 5 bedrooms
Note: Performance varies based on location, size, amenities, seasonality, and management quality. Data reflects the past 12 months.
Top Performing Airbnb Hosts in Nosara (2025)
Learn from the best! This table showcases top-performing Airbnb hosts in Nosara based on the number of properties managed and estimated total revenue over the past year. Analyze their scale and performance metrics.
| Host Name | Properties | Grossing Revenue | Stay Reviews | Avg Rating |
|---|---|---|---|---|
| Vacation Nosara | 44 | $1,968,119 | 889 | 3.81/5.0 |
| Alba Properties | 23 | $1,178,427 | 381 | 3.91/5.0 |
| Surfing Nosara | 28 | $1,055,742 | 111 | 1.76/5.0 |
| RentNosara | 24 | $1,017,595 | 211 | 4.65/5.0 |
| Nalu | 7 | $815,591 | 302 | 4.94/5.0 |
| Rick | 12 | $694,862 | 63 | 1.61/5.0 |
| QUIN Surf Residence Nosara | 5 | $548,285 | 25 | 3.00/5.0 |
| Surfing Nosara | 13 | $515,259 | 152 | 3.59/5.0 |
| Arun | 2 | $460,786 | 20 | 2.50/5.0 |
| Vacation Homes Nosara | 4 | $456,212 | 81 | 3.71/5.0 |
Analyzing the strategies of top hosts, such as their property selection, pricing, and guest communication, can offer valuable lessons for optimizing your own Airbnb operations in Nosara.
Dive Deeper: Advanced Nosara STR Market Data (2025)
Ready to unlock more insights? AirROI provides access to advanced metrics and comprehensive Airbnb data for Nosara. Explore detailed analytics beyond this report to refine your investment strategy, optimize pricing, and maximize your vacation rental profits.
Explore Advanced MetricsNosara Short-Term Rental Market Composition (2025): Property & Room Types
Room Type Distribution
Property Type Distribution
Market Composition Insights for Nosara
- The Nosara Airbnb market composition is heavily skewed towards Entire Home/Apt listings, which make up 86.3% of the 851 active rentals. This indicates strong guest preference for privacy and space.
- Looking at the property type distribution in Nosara, House properties are the most common (61.7%), reflecting the local real estate landscape.
- Houses represent a significant 61.7% portion, catering likely to families or larger groups.
- The presence of 10.3% Hotel/Boutique listings indicates integration with traditional hospitality.
- Smaller segments like outdoor/unique, others, unique stays (combined 6.6%) offer potential for unique stay experiences.
Nosara Airbnb Room Capacity Analysis (2025): Bedroom Distribution
Distribution of Listings by Number of Bedrooms
Room Capacity Insights for Nosara
- The dominant room capacity in Nosara is 1 bedroom listings, making up 33.1% of the market. This suggests a strong demand for properties suitable for couples or solo travelers.
- Together, 1 bedroom and 2 bedrooms properties represent 55.9% of the active Airbnb listings in Nosara, indicating a high concentration in these sizes.
- A significant 34.4% of listings offer 3+ bedrooms, catering to larger groups and families seeking more space in Nosara.
Nosara Vacation Rental Guest Capacity Trends (2025)
Distribution of Listings by Guest Capacity
Guest Capacity Insights for Nosara
- The most common guest capacity trend in Nosara vacation rentals is listings accommodating 2 guests (25.9%). This suggests the primary traveler segment is likely couples or solo travelers.
- Properties designed for 2 guests and 8+ guests dominate the Nosara STR market, accounting for 50.6% of listings.
- 40.6% of properties accommodate 6+ guests, serving the market segment for larger families or group travel in Nosara.
- On average, properties in Nosara are equipped to host 4.6 guests.
Nosara Airbnb Booking Patterns (2025): Available vs. Booked Days
Available Days Distribution
Booked Days Distribution
Booking Pattern Insights for Nosara
- The most common availability pattern in Nosara falls within the 271-366 days range, representing 53.9% of listings. This suggests many properties have significant open periods on their calendars.
- Approximately 80.9% of listings show high availability (181+ days open annually), indicating potential for increased bookings or specific owner usage patterns.
- For booked days, the 31-90 days range is most frequent in Nosara (31.3%), reflecting common guest stay durations or potential owner blocking patterns.
- A notable 20.2% of properties secure long booking periods (181+ days booked per year), highlighting successful long-term rental strategies or significant owner usage.
Nosara Airbnb Minimum Stay Requirements Analysis
Distribution of Listings by Minimum Night Requirement
1 Night
119 listings
14.5% of total
2 Nights
154 listings
18.8% of total
3 Nights
150 listings
18.3% of total
4-6 Nights
183 listings
22.3% of total
7-29 Nights
27 listings
3.3% of total
30+ Nights
187 listings
22.8% of total
Key Insights
- The most prevalent minimum stay requirement in Nosara is 30+ Nights, adopted by 22.8% of listings. This highlights the market's preference for longer commitments.
- A significant segment (22.8%) caters to monthly stays (30+ nights) in Nosara, pointing to opportunities in the extended-stay market.
Recommendations
- Align with the market by considering a 30+ Nights minimum stay, as 22.8% of Nosara hosts use this setting.
- If feasible, allowing 1-night stays, especially midweek or during low season, could capture last-minute bookings, as only 14.5% currently do.
- Explore offering discounts for stays of 30+ nights to attract the 22.8% of the market seeking extended stays.
- Adjust minimum nights based on seasonality – potentially shorter during low season and longer during peak demand periods in Nosara.
Nosara Airbnb Cancellation Policy Trends Analysis (2025)
Super Strict 60 Days
41 listings
5.8% of total
Super Strict 30 Days
62 listings
8.8% of total
Flexible
58 listings
8.3% of total
Moderate
97 listings
13.8% of total
Firm
190 listings
27.1% of total
Strict
254 listings
36.2% of total
Cancellation Policy Insights for Nosara
- The prevailing Airbnb cancellation policy trend in Nosara is Strict, used by 36.2% of listings.
- A majority (63.3%) of hosts in Nosara utilize Firm or Strict policies, indicating a market where hosts prioritize booking security.
Recommendations for Hosts
- Consider adopting a Strict policy to align with the 36.2% market standard in Nosara.
- With 36.2% using Strict terms, this is a viable option in Nosara, particularly for high-value properties or during peak demand periods.
- Regularly review your cancellation policy against competitors and market demand shifts in Nosara.
Nosara STR Booking Lead Time Analysis (2025)
Average Booking Lead Time by Month
Booking Lead Time Insights for Nosara
- The overall average booking lead time for vacation rentals in Nosara is 70 days.
- Guests book furthest in advance for stays during February (average 91 days), likely coinciding with peak travel demand or local events.
- The shortest booking windows occur for stays in September (average 45 days), indicating more last-minute travel plans during this time.
- Seasonally, Winter (88 days avg.) sees the longest lead times, while Fall (59 days avg.) has the shortest, reflecting typical travel planning cycles.
Recommendations for Hosts
- Use the overall average lead time (70 days) as a baseline for your pricing and availability strategy in Nosara.
- For February stays, consider implementing length-of-stay discounts or slightly higher rates for bookings made less than 91 days out to capitalize on advance planning.
- Target marketing efforts for the Winter season well in advance (at least 88 days) to capture early planners.
- Monitor your own booking lead times against these Nosara averages to identify opportunities for dynamic pricing adjustments.
Popular & Essential Airbnb Amenities in Nosara (2025)
Amenity Prevalence
Amenity Insights for Nosara
- Essential amenities in Nosara that guests expect include: Wifi, Air conditioning. Lacking these (any) could significantly impact bookings.
- Popular amenities like Kitchen, Free parking on premises, Essentials are common but not universal. Offering these can provide a competitive edge.
Recommendations for Hosts
- Ensure your listing includes all essential amenities for Nosara: Wifi, Air conditioning.
- Prioritize adding missing essentials: Wifi, Air conditioning.
- Consider adding popular differentiators like Kitchen or Free parking on premises to increase appeal.
- Highlight unique or less common amenities you offer (e.g., hot tub, dedicated workspace, EV charger) in your listing description and photos.
- Regularly check competitor amenities in Nosara to stay competitive.
Nosara Airbnb Guest Demographics & Profile Analysis (2025)
Guest Profile Summary for Nosara
- The typical guest profile for Airbnb in Nosara consists of predominantly international visitors (89%), with top international origins including Canada, typically belonging to the Post-2000s (Gen Z/Alpha) group (50%), primarily speaking English or Spanish.
- Domestic travelers account for 10.7% of guests.
- Key international markets include United States (58.8%) and Canada (15.5%).
- Top languages spoken are English (52.3%) followed by Spanish (22.6%).
- A significant demographic segment is the Post-2000s (Gen Z/Alpha) group, representing 50% of guests.
Recommendations for Hosts
- Focus marketing internationally, particularly towards travelers from Canada.
- Tailor amenities and listing descriptions to appeal to the dominant Post-2000s (Gen Z/Alpha) demographic (e.g., highlight fast WiFi, smart home features, local guides).
- Highlight unique local experiences or amenities relevant to the primary guest profile.
- Consider seasonal promotions aligned with peak travel times for key origin markets.
Nearby Short-Term Rental Market Comparison
How does the Nosara Airbnb market stack up against its neighbors? Compare key performance metrics like average monthly revenue, ADR, and occupancy rates in surrounding areas to understand the broader regional STR landscape.
| Market | Active Properties | Monthly Revenue | Daily Rate | Avg. Occupancy |
|---|---|---|---|---|
| Pinilla | 49 | $6,647 | $580.89 | 37% |
| Tamarindo | 136 | $5,073 | $462.37 | 41% |
| Punta Islita | 30 | $4,595 | $537.15 | 36% |
| Nacascolo | 34 | $4,475 | $1256.07 | 30% |
| Playa Langosta | 154 | $4,432 | $472.13 | 43% |
| Playa Tamarindo | 23 | $4,370 | $365.55 | 44% |
| Tamarindo | 1,021 | $4,120 | $345.13 | 44% |
| Cabo Velas | 852 | $3,462 | $356.16 | 41% |
| Tempate | 638 | $3,086 | $377.44 | 37% |
| Puerto Carrillo | 46 | $2,900 | $286.69 | 35% |