Sixaola Airbnb Market Analysis 2025: Short Term Rental Data & Vacation Rental Statistics in Limón Province, Costa Rica
Is Airbnb profitable in Sixaola in 2025? Explore comprehensive Airbnb analytics for Sixaola, Limón Province, Costa Rica to uncover income potential. This 2025 STR market report for Sixaola, based on AirROI data from June 2024 to May 2025, reveals key trends in the niche market of 24 active listings.
Whether you're considering an Airbnb investment in Sixaola, optimizing your existing vacation rental, or exploring rental arbitrage opportunities, understanding the Sixaola Airbnb data is crucial. Leveraging the low regulation environment is key to maximizing your short term rental income potential. Let's dive into the specifics.
Key Sixaola Airbnb Performance Metrics Overview
Monthly Airbnb Revenue Variations & Income Potential in Sixaola (2025)
Understanding the monthly revenue variations for Airbnb listings in Sixaola is key to maximizing your short term rental income potential. Seasonality significantly impacts earnings. Our analysis, based on data from the past 12 months, shows that the peak revenue month for STRs in Sixaola is typically August, while June often presents the lowest earnings, highlighting opportunities for strategic pricing adjustments during shoulder and low seasons. Explore the typical Airbnb income in Sixaola across different performance tiers:
- Best-in-class properties (Top 10%) achieve $5,528+ monthly, often utilizing dynamic pricing and superior guest experiences.
- Strong performing properties (Top 25%) earn $2,525 or more, indicating effective management and desirable locations/amenities.
- Typical properties (Median) generate around $1,032 per month, representing the average market performance.
- Entry-level properties (Bottom 25%) see earnings around $345, often with potential for optimization.
Average Monthly Airbnb Earnings Trend in Sixaola
Sixaola Airbnb Occupancy Rate Trends (2025)
Maximize your bookings by understanding the Sixaola STR occupancy trends. Seasonal demand shifts significantly influence how often properties are booked. Typically, Septembersees the highest demand (peak season occupancy), while November experiences the lowest (low season). Effective strategies, like adjusting minimum stays or offering promotions, can boost occupancy during slower periods. Here's how different property tiers perform in Sixaola:
- Best-in-class properties (Top 10%) achieve 70%+ occupancy, indicating high desirability and potentially optimized availability.
- Strong performing properties (Top 25%) maintain 46% or higher occupancy, suggesting good market fit and guest satisfaction.
- Typical properties (Median) have an occupancy rate around 24%.
- Entry-level properties (Bottom 25%) average 13% occupancy, potentially facing higher vacancy.
Average Monthly Occupancy Rate Trend in Sixaola
Average Daily Rate (ADR) Airbnb Trends in Sixaola (2025)
Effective short term rental pricing strategy in Sixaola involves understanding monthly ADR fluctuations. The Average Daily Rate (ADR) for Airbnb in Sixaola typically peaks in February and dips lowest during November. Leveraging Airbnb dynamic pricing tools or strategies based on this seasonality can significantly boost revenue. Here's a look at the typical nightly rates achieved:
- Best-in-class properties (Top 10%) command rates of $261+ per night, often due to premium features or locations.
- Strong performing properties (Top 25%) achieve nightly rates of $164 or more.
- Typical properties (Median) charge around $94 per night.
- Entry-level properties (Bottom 25%) earn around $65 per night.
Average Daily Rate (ADR) Trend by Month in Sixaola
Get Live Sixaola Market Intelligence 👇

Explore Real-time Analytics
Airbnb Seasonality Analysis & Trends in Sixaola (2025)
Peak Season (August, September, July)
- Revenue averages $2,561 per month
- Occupancy rates average 40.4%
- Daily rates average $114
Shoulder Season
- Revenue averages $1,928 per month
- Occupancy maintains around 31.5%
- Daily rates hold near $127
Low Season (February, March, June)
- Revenue drops to average $1,429 per month
- Occupancy decreases to average 27.7%
- Daily rates adjust to average $133
Seasonality Insights for Sixaola
- The Airbnb seasonality in Sixaola shows highly seasonal trends requiring careful strategy. While the sections above show seasonal averages, it's also insightful to look at the extremes:
- During the high season, the absolute peak month showcases Sixaola's highest earning potential, with monthly revenues capable of climbing to $2,635, occupancy reaching a high of 41.9%, and ADRs peaking at $144.
- Conversely, the slowest single month of the year, typically falling within the low season, marks the market's lowest point. In this month, revenue might dip to $1,026, occupancy could drop to 25.1%, and ADRs may adjust down to $113.
- Understanding both the seasonal averages and these monthly peaks and troughs in revenue, occupancy, and ADR is crucial for maximizing your Airbnb profit potential in Sixaola.
Seasonal Strategies for Maximizing Profit
- Peak Season: Maximize revenue through premium pricing and potentially longer minimum stays. Ensure high availability.
- Low Season: Offer competitive pricing, special promotions (e.g., extended stay discounts), and flexible cancellation policies. Target off-season travelers like remote workers or budget-conscious guests.
- Shoulder Seasons: Implement dynamic pricing that balances peak and low rates. Target weekend travelers or specific events. Offer slightly more flexible terms than peak season.
- Regularly analyze your own performance against these Sixaola seasonality benchmarks and adjust your pricing and availability strategy accordingly.
Best Areas for Airbnb Investment in Sixaola (2025)
Exploring the top neighborhoods for short-term rentals in Sixaola? This section highlights key areas, outlining why they are attractive for hosts and guests, along with notable local attractions. Consider these locations based on your target guest profile and investment strategy.
| Neighborhood / Area | Why Host Here? (Target Guests & Appeal) | Key Attractions & Landmarks |
|---|---|---|
| Sixaola Beach | A beautiful coastal area known for its pristine beaches and proximity to Tortuguero National Park. Ideal for travelers seeking relaxation and natural beauty. | Tortuguero National Park, Sixaola River, beach activities, local wildlife, eco-tourism opportunities |
| Bribri | Indigenous community with rich cultural heritage, close to stunning nature and hiking trails. Great for those interested in cultural experiences and adventure tourism. | Bribri Indigenous Reserve, waterfalls, hiking trails, local artisan markets, coffee tours |
| Cahuita | A coastal town famous for its national park, biodiversity, and Caribbean culture. Perfect for tourists interested in nature, wildlife, and vibrant local scenes. | Cahuita National Park, beach snorkeling, local cuisine, wildlife spotting, Caribbean lifestyle |
| Puerto Viejo | A popular surf town known for its laid-back atmosphere, beautiful beaches, and vibrant nightlife. Attracts a young, adventurous crowd looking for fun and relaxation. | Playa Cocles, Playa Chiquita, surfing spots, local bars, jungle tours |
| Tortuguero | Famous for its canals, turtle nesting sites, and rich wildlife, making it a top destination for eco-tourism and adventure seekers. | Tortuguero Canals, turtle nests, wildlife tours, boat excursions, local village |
| Punta Uva | Offers stunning beaches and a tranquil atmosphere, ideal for families and couples looking to escape the hustle and bustle. | Punta Uva Beach, snorkeling, sea turtle watching, jungle lodges, relaxing beaches |
| Gandoca-Manzanillo | Part of the Gandoca-Manzanillo National Wildlife Refuge, this area is great for eco-tourists and those looking to explore untouched nature. | wildlife refuge, hiking trails, untouched beaches, coral reefs, biodiversity |
| Samasati | A wellness retreat area focusing on yoga, meditation, and holistic experiences, appealing to guests seeking relaxation and rejuvenation. | yoga retreats, nature trails, wellness programs, sustainable living, tranquil environment |
Understanding Airbnb License Requirements & STR Laws in Sixaola (2025)
While Sixaola, Limón Province, Costa Rica currently shows low STR regulations, specific Airbnb license requirements might still exist or change. Always verify the latest short term rental regulations and Airbnb license requirements directly with local government authorities for Sixaola to ensure full compliance before hosting.
(Source: AirROI data, 2025, based on 4% licensed listings)
Top Performing Airbnb Properties in Sixaola (2025)
Benchmark your potential! Explore examples of top-performing Airbnb properties in Sixaolabased on Trailing Twelve Month (TTM) revenue. Analyze their characteristics, revenue, occupancy rate, and ADR to understand what drives success in this market.
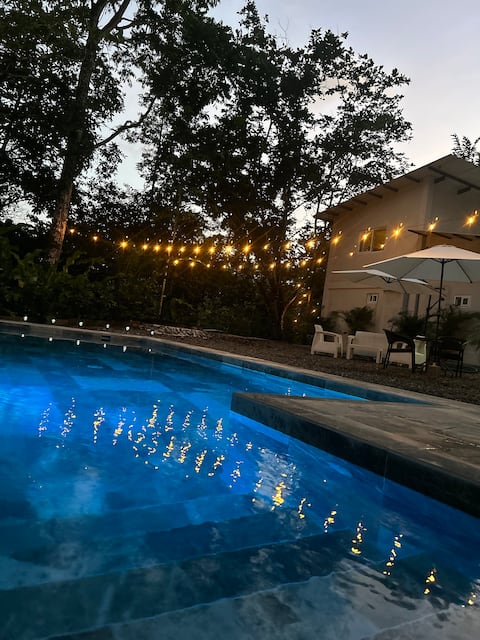
Beautiful tropical house with private pool
Entire Place • 2 bedrooms
Villa Paraíso Luxury wildlife paradise
Entire Place • 3 bedrooms

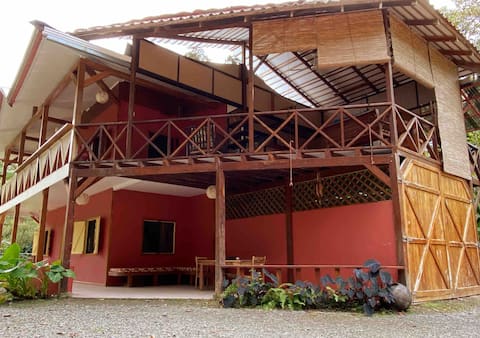
Peaceful Jungle Paradise (CASA)
Entire Place • 2 bedrooms
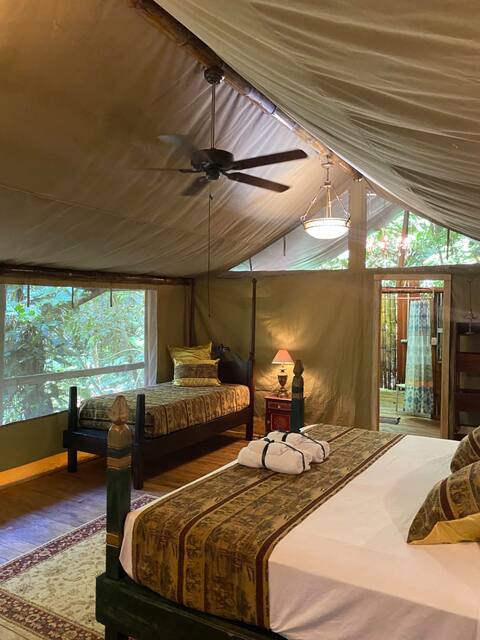
Luxury Glamping Tent Indian style
Private Room • 1 bedroom
Casa Alma Caribeña , Cocles ( Fiber Optic, Pool )
Entire Place • 4 bedrooms

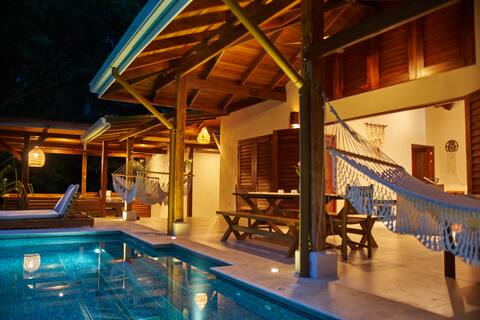
Luxury Tropical Villa with Pool and Guest House
Entire Place • 2 bedrooms
Note: Performance varies based on location, size, amenities, seasonality, and management quality. Data reflects the past 12 months.
Top Performing Airbnb Hosts in Sixaola (2025)
Learn from the best! This table showcases top-performing Airbnb hosts in Sixaola based on the number of properties managed and estimated total revenue over the past year. Analyze their scale and performance metrics.
| Host Name | Properties | Grossing Revenue | Stay Reviews | Avg Rating |
|---|---|---|---|---|
| Analaura | 1 | $81,932 | 19 | 4.95/5.0 |
| Larson | 1 | $70,029 | 15 | 4.67/5.0 |
| Terry And Tracie | 2 | $57,515 | 30 | 5.00/5.0 |
| Host #22166094 | 1 | $19,686 | 0 | N/A/5.0 |
| Carlos | 1 | $19,542 | 36 | 4.83/5.0 |
| Host #497938738 | 2 | $16,394 | 0 | N/A/5.0 |
| Mariusz | 3 | $12,355 | 16 | 4.49/5.0 |
| Host #63096701 | 1 | $11,338 | 1 | N/A/5.0 |
| Mona | 1 | $10,984 | 20 | 5.00/5.0 |
| Host #456304550 | 1 | $7,646 | 0 | N/A/5.0 |
Analyzing the strategies of top hosts, such as their property selection, pricing, and guest communication, can offer valuable lessons for optimizing your own Airbnb operations in Sixaola.
Dive Deeper: Advanced Sixaola STR Market Data (2025)
Ready to unlock more insights? AirROI provides access to advanced metrics and comprehensive Airbnb data for Sixaola. Explore detailed analytics beyond this report to refine your investment strategy, optimize pricing, and maximize your vacation rental profits.
Explore Advanced MetricsSixaola Short-Term Rental Market Composition (2025): Property & Room Types
Room Type Distribution
Property Type Distribution
Market Composition Insights for Sixaola
- The Sixaola Airbnb market composition is heavily skewed towards Entire Home/Apt listings, which make up 70.8% of the 24 active rentals. This indicates strong guest preference for privacy and space.
- Looking at the property type distribution in Sixaola, House properties are the most common (58.3%), reflecting the local real estate landscape.
- Houses represent a significant 58.3% portion, catering likely to families or larger groups.
- The presence of 20.8% Hotel/Boutique listings indicates integration with traditional hospitality.
Sixaola Airbnb Room Capacity Analysis (2025): Bedroom Distribution
Distribution of Listings by Number of Bedrooms
Room Capacity Insights for Sixaola
- The dominant room capacity in Sixaola is 1 bedroom listings, making up 54.2% of the market. This suggests a strong demand for properties suitable for couples or solo travelers.
- Together, 1 bedroom and 2 bedrooms properties represent 83.4% of the active Airbnb listings in Sixaola, indicating a high concentration in these sizes.
- With over half the market (54.2%) consisting of studios or 1-bedroom units, Sixaola is particularly well-suited for individuals or couples.
Sixaola Vacation Rental Guest Capacity Trends (2025)
Distribution of Listings by Guest Capacity
Guest Capacity Insights for Sixaola
- The most common guest capacity trend in Sixaola vacation rentals is listings accommodating 2 guests (37.5%). This suggests the primary traveler segment is likely couples or solo travelers.
- Properties designed for 2 guests and 4 guests dominate the Sixaola STR market, accounting for 66.7% of listings.
- 16.7% of properties accommodate 6+ guests, serving the market segment for larger families or group travel in Sixaola.
- On average, properties in Sixaola are equipped to host 3.7 guests.
Sixaola Airbnb Booking Patterns (2025): Available vs. Booked Days
Available Days Distribution
Booked Days Distribution
Booking Pattern Insights for Sixaola
- The most common availability pattern in Sixaola falls within the 271-366 days range, representing 79.2% of listings. This suggests many properties have significant open periods on their calendars.
- Approximately 87.5% of listings show high availability (181+ days open annually), indicating potential for increased bookings or specific owner usage patterns.
- For booked days, the 1-30 days range is most frequent in Sixaola (37.5%), reflecting common guest stay durations or potential owner blocking patterns.
- A notable 12.5% of properties secure long booking periods (181+ days booked per year), highlighting successful long-term rental strategies or significant owner usage.
Sixaola Airbnb Minimum Stay Requirements Analysis
Distribution of Listings by Minimum Night Requirement
1 Night
9 listings
37.5% of total
2 Nights
8 listings
33.3% of total
3 Nights
3 listings
12.5% of total
4-6 Nights
1 listings
4.2% of total
30+ Nights
3 listings
12.5% of total
Key Insights
- The most prevalent minimum stay requirement in Sixaola is 1 Night, adopted by 37.5% of listings. This highlights the market's preference for shorter, flexible bookings.
- A strong majority (70.8%) of the Sixaola Airbnb data shows acceptance of very short stays (1-2 nights), indicating a dynamic, high-turnover market.
- A significant segment (12.5%) caters to monthly stays (30+ nights) in Sixaola, pointing to opportunities in the extended-stay market.
Recommendations
- Align with the market by considering a 1 Night minimum stay, as 37.5% of Sixaola hosts use this setting.
- Explore offering discounts for stays of 30+ nights to attract the 12.5% of the market seeking extended stays.
- Adjust minimum nights based on seasonality – potentially shorter during low season and longer during peak demand periods in Sixaola.
Sixaola Airbnb Cancellation Policy Trends Analysis (2025)
Flexible
8 listings
50% of total
Moderate
4 listings
25% of total
Firm
3 listings
18.8% of total
Strict
1 listings
6.3% of total
Cancellation Policy Insights for Sixaola
- The prevailing Airbnb cancellation policy trend in Sixaola is Flexible, used by 50% of listings.
- The market strongly favors guest-friendly terms, with 75.0% of listings offering Flexible or Moderate policies. This suggests guests in Sixaola may expect booking flexibility.
- Strict cancellation policies are quite rare (6.3%), potentially making listings with this policy less competitive unless justified by high demand or property type.
Recommendations for Hosts
- Consider adopting a Flexible policy to align with the 50% market standard in Sixaola.
- Using a Strict policy might deter some guests, as only 6.3% of listings use it. Evaluate if potential revenue protection outweighs possible lower booking rates.
- Regularly review your cancellation policy against competitors and market demand shifts in Sixaola.
Sixaola STR Booking Lead Time Analysis (2025)
Average Booking Lead Time by Month
Booking Lead Time Insights for Sixaola
- The overall average booking lead time for vacation rentals in Sixaola is 37 days.
- Guests book furthest in advance for stays during December (average 70 days), likely coinciding with peak travel demand or local events.
- The shortest booking windows occur for stays in June (average 16 days), indicating more last-minute travel plans during this time.
- Seasonally, Winter (49 days avg.) sees the longest lead times, while Summer (22 days avg.) has the shortest, reflecting typical travel planning cycles.
Recommendations for Hosts
- Use the overall average lead time (37 days) as a baseline for your pricing and availability strategy in Sixaola.
- For December stays, consider implementing length-of-stay discounts or slightly higher rates for bookings made less than 70 days out to capitalize on advance planning.
- Target marketing efforts for the Winter season well in advance (at least 49 days) to capture early planners.
- Monitor your own booking lead times against these Sixaola averages to identify opportunities for dynamic pricing adjustments.
Popular & Essential Airbnb Amenities in Sixaola (2025)
Amenity Prevalence
Amenity Insights for Sixaola
- Essential amenities in Sixaola that guests expect include: Free parking on premises, Wifi, Kitchen. Lacking these (any) could significantly impact bookings.
- Popular amenities like Essentials, Hot water, Washer are common but not universal. Offering these can provide a competitive edge.
Recommendations for Hosts
- Ensure your listing includes all essential amenities for Sixaola: Free parking on premises, Wifi, Kitchen.
- Prioritize adding missing essentials: Wifi, Kitchen.
- Consider adding popular differentiators like Essentials or Hot water to increase appeal.
- Highlight unique or less common amenities you offer (e.g., hot tub, dedicated workspace, EV charger) in your listing description and photos.
- Regularly check competitor amenities in Sixaola to stay competitive.
Sixaola Airbnb Guest Demographics & Profile Analysis (2025)
Guest Profile Summary for Sixaola
- The typical guest profile for Airbnb in Sixaola consists of a mix of domestic (46%) and international guests, with top international origins including United States, typically belonging to the Post-2000s (Gen Z/Alpha) group (50%), primarily speaking Spanish or English.
- Domestic travelers account for 46.4% of guests.
- Key international markets include Costa Rica (46.4%) and United States (35.7%).
- Top languages spoken are Spanish (43.6%) followed by English (41.8%).
- A significant demographic segment is the Post-2000s (Gen Z/Alpha) group, representing 50% of guests.
Recommendations for Hosts
- Balance marketing efforts between domestic and international channels based on the guest mix.
- Tailor amenities and listing descriptions to appeal to the dominant Post-2000s (Gen Z/Alpha) demographic (e.g., highlight fast WiFi, smart home features, local guides).
- Highlight unique local experiences or amenities relevant to the primary guest profile.
- Consider seasonal promotions aligned with peak travel times for key origin markets.
Nearby Short-Term Rental Market Comparison
How does the Sixaola Airbnb market stack up against its neighbors? Compare key performance metrics like average monthly revenue, ADR, and occupancy rates in surrounding areas to understand the broader regional STR landscape.
| Market | Active Properties | Monthly Revenue | Daily Rate | Avg. Occupancy |
|---|---|---|---|---|
| Bahía Ballena | 1,328 | $2,106 | $232.10 | 38% |
| Savegre | 215 | $2,095 | $234.37 | 35% |
| Boca Chica | 25 | $1,304 | $146.44 | 35% |
| Bocas del Toro | 494 | $1,283 | $169.61 | 34% |
| Cahuita | 2,189 | $1,265 | $144.12 | 37% |
| Puerto Cortés | 224 | $1,240 | $181.34 | 33% |
| Las Lajas | 41 | $1,167 | $144.66 | 28% |
| Puerto Jiménez | 302 | $1,090 | $165.08 | 29% |
| Jaramillo | 48 | $1,083 | $120.12 | 39% |
| Bastimentos | 115 | $968 | $169.62 | 29% |