Oriental Airbnb Market Analysis 2025: Short Term Rental Data & Vacation Rental Statistics in Cartago Province, Costa Rica
Is Airbnb profitable in Oriental in 2025? Explore comprehensive Airbnb analytics for Oriental, Cartago Province, Costa Rica to uncover income potential. This 2025 STR market report for Oriental, based on AirROI data from April 2024 to March 2025, reveals key trends in the niche market of 17 active listings.
Whether you're considering an Airbnb investment in Oriental, optimizing your existing vacation rental, or exploring rental arbitrage opportunities, understanding the Oriental Airbnb data is crucial. Leveraging the low regulation environment is key to maximizing your short term rental income potential. Let's dive into the specifics.
Key Oriental Airbnb Performance Metrics Overview
Monthly Airbnb Revenue Variations & Income Potential in Oriental (2025)
Understanding the monthly revenue variations for Airbnb listings in Oriental is key to maximizing your short term rental income potential. Seasonality significantly impacts earnings. Our analysis, based on data from the past 12 months, shows that the peak revenue month for STRs in Oriental is typically April, while December often presents the lowest earnings, highlighting opportunities for strategic pricing adjustments during shoulder and low seasons. Explore the typical Airbnb income in Oriental across different performance tiers:
- Best-in-class properties (Top 10%) achieve $1,339+ monthly, often utilizing dynamic pricing and superior guest experiences.
- Strong performing properties (Top 25%) earn $973 or more, indicating effective management and desirable locations/amenities.
- Typical properties (Median) generate around $624 per month, representing the average market performance.
- Entry-level properties (Bottom 25%) see earnings around $329, often with potential for optimization.
Average Monthly Airbnb Earnings Trend in Oriental
Oriental Airbnb Occupancy Rate Trends (2025)
Maximize your bookings by understanding the Oriental STR occupancy trends. Seasonal demand shifts significantly influence how often properties are booked. Typically, Aprilsees the highest demand (peak season occupancy), while September experiences the lowest (low season). Effective strategies, like adjusting minimum stays or offering promotions, can boost occupancy during slower periods. Here's how different property tiers perform in Oriental:
- Best-in-class properties (Top 10%) achieve 74%+ occupancy, indicating high desirability and potentially optimized availability.
- Strong performing properties (Top 25%) maintain 53% or higher occupancy, suggesting good market fit and guest satisfaction.
- Typical properties (Median) have an occupancy rate around 31%.
- Entry-level properties (Bottom 25%) average 21% occupancy, potentially facing higher vacancy.
Average Monthly Occupancy Rate Trend in Oriental
Average Daily Rate (ADR) Airbnb Trends in Oriental (2025)
Effective short term rental pricing strategy in Oriental involves understanding monthly ADR fluctuations. The Average Daily Rate (ADR) for Airbnb in Oriental typically peaks in September and dips lowest during November. Leveraging Airbnb dynamic pricing tools or strategies based on this seasonality can significantly boost revenue. Here's a look at the typical nightly rates achieved:
- Best-in-class properties (Top 10%) command rates of $71+ per night, often due to premium features or locations.
- Strong performing properties (Top 25%) achieve nightly rates of $52 or more.
- Typical properties (Median) charge around $41 per night.
- Entry-level properties (Bottom 25%) earn around $30 per night.
Average Daily Rate (ADR) Trend by Month in Oriental
Get Live Oriental Market Intelligence 👇

Explore Real-time Analytics
Airbnb Seasonality Analysis & Trends in Oriental (2025)
Peak Season (April, June, May)
- Revenue averages $1,161 per month
- Occupancy rates average 50.6%
- Daily rates average $48
Shoulder Season
- Revenue averages $637 per month
- Occupancy maintains around 41.9%
- Daily rates hold near $43
Low Season (August, September, December)
- Revenue drops to average $448 per month
- Occupancy decreases to average 27.1%
- Daily rates adjust to average $47
Seasonality Insights for Oriental
- The Airbnb seasonality in Oriental shows highly seasonal trends requiring careful strategy. While the sections above show seasonal averages, it's also insightful to look at the extremes:
- During the high season, the absolute peak month showcases Oriental's highest earning potential, with monthly revenues capable of climbing to $1,258, occupancy reaching a high of 66.7%, and ADRs peaking at $53.
- Conversely, the slowest single month of the year, typically falling within the low season, marks the market's lowest point. In this month, revenue might dip to $425, occupancy could drop to 23.8%, and ADRs may adjust down to $40.
- Understanding both the seasonal averages and these monthly peaks and troughs in revenue, occupancy, and ADR is crucial for maximizing your Airbnb profit potential in Oriental.
Seasonal Strategies for Maximizing Profit
- Peak Season: Maximize revenue through premium pricing and potentially longer minimum stays. Ensure high availability.
- Low Season: Offer competitive pricing, special promotions (e.g., extended stay discounts), and flexible cancellation policies. Target off-season travelers like remote workers or budget-conscious guests.
- Shoulder Seasons: Implement dynamic pricing that balances peak and low rates. Target weekend travelers or specific events. Offer slightly more flexible terms than peak season.
- Regularly analyze your own performance against these Oriental seasonality benchmarks and adjust your pricing and availability strategy accordingly.
Best Areas for Airbnb Investment in Oriental (2025)
Exploring the top neighborhoods for short-term rentals in Oriental? This section highlights key areas, outlining why they are attractive for hosts and guests, along with notable local attractions. Consider these locations based on your target guest profile and investment strategy.
| Neighborhood / Area | Why Host Here? (Target Guests & Appeal) | Key Attractions & Landmarks |
|---|---|---|
| Turrialba | Known for its scenic views and the nearby Turrialba Volcano, this area appeals to those interested in nature, adventure, and coffee tours, making it a great investment for eco-tourism. | Turrialba Volcano National Park, Guayabo National Monument, Coffee Tours, Pacuare River Rafting, Caves of Turrialba |
| Orosi Valley | A picturesque valley with beautiful landscapes, waterfalls, and rich cultural heritage. Ideal for visitors looking for tranquility and nature. | Orosi River, Orosi Church, Catarata de La Paz, Canyoning and Waterfalls, Scenic drives through the valley |
| Guayabo | Historical site with archaeological importance attractive to history buffs and travelers interested in indigenous culture. | Guayabo National Monument, Archaeological tours, Nature trails, Local cultural experiences |
| Cachi | With its stunning views and proximity to the Reventazón River, Cachi is an emerging area for nature lovers and outdoor enthusiasts. | Cachi Dam, Reventazón River, Hiking trails, Bird watching, Cultural experiences in local villages |
| El Tejar | A growing residential area near Turrialba, El Tejar offers a local experience with easy access to attractions, appealing for budget travelers. | Local markets, Cultural festivals, Natural hot springs nearby, Coffee farm tours |
| Turrialba City | The main urban center of the area, providing accessible amenities, dining, and cultural experiences for tourists and expatriates. | Local restaurants, Cultural events, Turrialba River, Nearby adventure sports |
| Santa Rosa | A small community near Turrialba that presents a rural Costa Rican experience, ideal for visitors wanting to escape the busyness of tourist hotspots. | Local farms, Nature walks, Cultural exchanges with locals, Agricultural tours |
| Pacacua | Known for its rich biodiversity and natural landscapes, Pacacua attracts those interested in adventure and eco-friendly tourism. | Hiking trails, Bird watching, Nature reserves, Community tours |
Understanding Airbnb License Requirements & STR Laws in Oriental (2025)
While Oriental, Cartago Province, Costa Rica currently shows low STR regulations, specific Airbnb license requirements might still exist or change. Always verify the latest short term rental regulations and Airbnb license requirements directly with local government authorities for Oriental to ensure full compliance before hosting.
(Source: AirROI data, 2025, finding no licensed listings among those analyzed)
Top Performing Airbnb Properties in Oriental (2025)
Benchmark your potential! Explore examples of top-performing Airbnb properties in Orientalbased on Trailing Twelve Month (TTM) revenue. Analyze their characteristics, revenue, occupancy rate, and ADR to understand what drives success in this market.
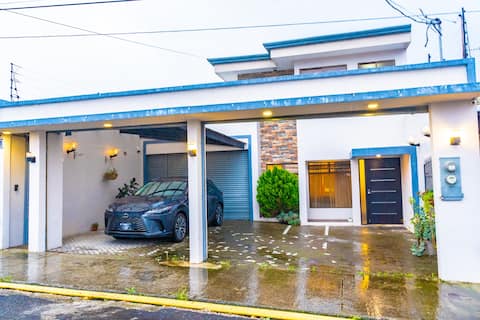
Cozy complete house in Cartago Centro
Entire Place • 2 bedrooms
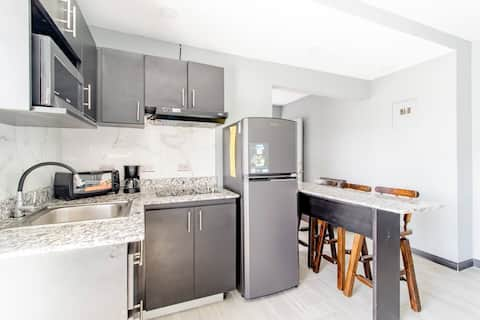
Nice apartment close to Tec & Basilica Los Angeles
Entire Place • 2 bedrooms
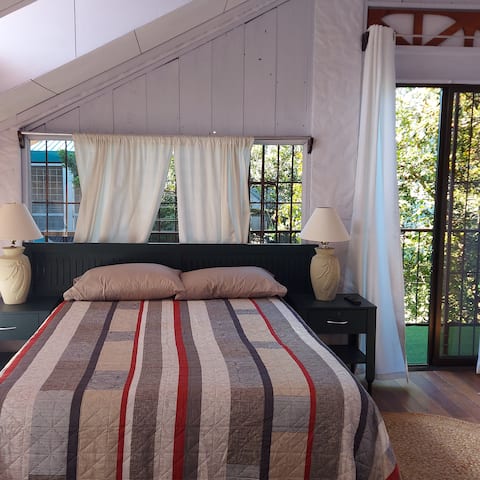
Chalet in the center of Cartago 3 beds
Entire Place • 1 bedroom
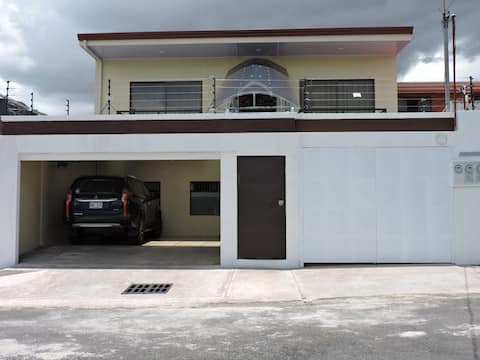
3 Apartamento Avenida 3 Basílica.Centro Cartago
Entire Place • 2 bedrooms
4 Apartamento Avenida 3 Basílica.Centro Cartago
Entire Place • 2 bedrooms

1 Apartamento Avenida 3 Basílica.Centro Cartago
Entire Place • 1 bedroom
Note: Performance varies based on location, size, amenities, seasonality, and management quality. Data reflects the past 12 months.
Top Performing Airbnb Hosts in Oriental (2025)
Learn from the best! This table showcases top-performing Airbnb hosts in Oriental based on the number of properties managed and estimated total revenue over the past year. Analyze their scale and performance metrics.
| Host Name | Properties | Grossing Revenue | Stay Reviews | Avg Rating |
|---|---|---|---|---|
| Manrique | 4 | $32,460 | 157 | 4.69/5.0 |
| Irene | 4 | $28,256 | 146 | 4.77/5.0 |
| Charlotte | 1 | $17,125 | 13 | 4.92/5.0 |
| Oscar | 1 | $13,338 | 37 | 4.92/5.0 |
| Jonathan | 1 | $5,593 | 6 | 4.83/5.0 |
| Willy | 1 | $4,006 | 16 | 5.00/5.0 |
| Host #421904331 | 2 | $3,662 | 15 | 2.50/5.0 |
| Jose Carlos | 1 | $3,403 | 21 | 4.95/5.0 |
| Raquel Leiva | 1 | $2,979 | 7 | 5.00/5.0 |
| Host #115084336 | 1 | $1,063 | 17 | 4.94/5.0 |
Analyzing the strategies of top hosts, such as their property selection, pricing, and guest communication, can offer valuable lessons for optimizing your own Airbnb operations in Oriental.
Dive Deeper: Advanced Oriental STR Market Data (2025)
Ready to unlock more insights? AirROI provides access to advanced metrics and comprehensive Airbnb data for Oriental. Explore detailed analytics beyond this report to refine your investment strategy, optimize pricing, and maximize your vacation rental profits.
Explore Advanced MetricsOriental Short-Term Rental Market Composition (2025): Property & Room Types
Room Type Distribution
Property Type Distribution
Market Composition Insights for Oriental
- The Oriental Airbnb market composition is heavily skewed towards Entire Home/Apt listings, which make up 76.5% of the 17 active rentals. This indicates strong guest preference for privacy and space.
- Looking at the property type distribution in Oriental, House properties are the most common (52.9%), reflecting the local real estate landscape.
- Houses represent a significant 52.9% portion, catering likely to families or larger groups.
Oriental Airbnb Room Capacity Analysis (2025): Bedroom Distribution
Distribution of Listings by Number of Bedrooms
Room Capacity Insights for Oriental
- The dominant room capacity in Oriental is 1 bedroom listings, making up 52.9% of the market. This suggests a strong demand for properties suitable for couples or solo travelers.
- Together, 1 bedroom and 2 bedrooms properties represent 94.1% of the active Airbnb listings in Oriental, indicating a high concentration in these sizes.
- With over half the market (52.9%) consisting of studios or 1-bedroom units, Oriental is particularly well-suited for individuals or couples.
Oriental Vacation Rental Guest Capacity Trends (2025)
Distribution of Listings by Guest Capacity
Guest Capacity Insights for Oriental
- The most common guest capacity trend in Oriental vacation rentals is listings accommodating 3 guests (23.5%). This suggests the primary traveler segment is likely small families or groups.
- Properties designed for 3 guests and 2 guests dominate the Oriental STR market, accounting for 47.0% of listings.
- On average, properties in Oriental are equipped to host 2.8 guests.
Oriental Airbnb Booking Patterns (2025): Available vs. Booked Days
Available Days Distribution
Booked Days Distribution
Booking Pattern Insights for Oriental
- The most common availability pattern in Oriental falls within the 181-270 days range, representing 82.4% of listings. This suggests many properties have significant open periods on their calendars.
- Approximately 88.3% of listings show high availability (181+ days open annually), indicating potential for increased bookings or specific owner usage patterns.
- For booked days, the 91-180 days range is most frequent in Oriental (76.5%), reflecting common guest stay durations or potential owner blocking patterns.
- A notable 17.7% of properties secure long booking periods (181+ days booked per year), highlighting successful long-term rental strategies or significant owner usage.
Oriental Airbnb Minimum Stay Requirements Analysis
Distribution of Listings by Minimum Night Requirement
1 Night
13 listings
81.3% of total
2 Nights
3 listings
18.8% of total
Key Insights
- The most prevalent minimum stay requirement in Oriental is 1 Night, adopted by 81.3% of listings. This highlights the market's preference for shorter, flexible bookings.
- A strong majority (100.1%) of the Oriental Airbnb data shows acceptance of very short stays (1-2 nights), indicating a dynamic, high-turnover market.
Recommendations
- Align with the market by considering a 1 Night minimum stay, as 81.3% of Oriental hosts use this setting.
- Adjust minimum nights based on seasonality – potentially shorter during low season and longer during peak demand periods in Oriental.
Oriental Airbnb Cancellation Policy Trends Analysis (2025)
Flexible
7 listings
46.7% of total
Firm
3 listings
20% of total
Strict
5 listings
33.3% of total
Cancellation Policy Insights for Oriental
- The prevailing Airbnb cancellation policy trend in Oriental is Flexible, used by 46.7% of listings.
- A majority (53.3%) of hosts in Oriental utilize Firm or Strict policies, indicating a market where hosts prioritize booking security.
Recommendations for Hosts
- Consider adopting a Flexible policy to align with the 46.7% market standard in Oriental.
- With 33.3% using Strict terms, this is a viable option in Oriental, particularly for high-value properties or during peak demand periods.
- Regularly review your cancellation policy against competitors and market demand shifts in Oriental.
Oriental STR Booking Lead Time Analysis (2025)
Average Booking Lead Time by Month
Booking Lead Time Insights for Oriental
- The overall average booking lead time for vacation rentals in Oriental is 23 days.
- Guests book furthest in advance for stays during December (average 75 days), likely coinciding with peak travel demand or local events.
- The shortest booking windows occur for stays in May (average 4 days), indicating more last-minute travel plans during this time.
- Seasonally, Winter (47 days avg.) sees the longest lead times, while Spring (11 days avg.) has the shortest, reflecting typical travel planning cycles.
Recommendations for Hosts
- Use the overall average lead time (23 days) as a baseline for your pricing and availability strategy in Oriental.
- For December stays, consider implementing length-of-stay discounts or slightly higher rates for bookings made less than 75 days out to capitalize on advance planning.
- During May, focus on last-minute booking availability and promotions, as guests book with very short notice (4 days avg.).
- Target marketing efforts for the Winter season well in advance (at least 47 days) to capture early planners.
- Monitor your own booking lead times against these Oriental averages to identify opportunities for dynamic pricing adjustments.
Popular & Essential Airbnb Amenities in Oriental (2025)
Amenity Prevalence
Amenity Insights for Oriental
- Essential amenities in Oriental that guests expect include: Bed linens, Kitchen, Wifi. Lacking these (any) could significantly impact bookings.
- Popular amenities like Dishes and silverware, Hot water, TV are common but not universal. Offering these can provide a competitive edge.
Recommendations for Hosts
- Ensure your listing includes all essential amenities for Oriental: Bed linens, Kitchen, Wifi.
- Consider adding popular differentiators like Dishes and silverware or Hot water to increase appeal.
- Highlight unique or less common amenities you offer (e.g., hot tub, dedicated workspace, EV charger) in your listing description and photos.
- Regularly check competitor amenities in Oriental to stay competitive.
Oriental Airbnb Guest Demographics & Profile Analysis (2025)
Guest Profile Summary for Oriental
- The typical guest profile for Airbnb in Oriental consists of a mix of domestic (48%) and international guests, with top international origins including United States, typically belonging to the Post-2000s (Gen Z/Alpha) group (50%), primarily speaking Spanish or English.
- Domestic travelers account for 48.3% of guests.
- Key international markets include Costa Rica (48.3%) and United States (11.6%).
- Top languages spoken are Spanish (42%) followed by English (36.1%).
- A significant demographic segment is the Post-2000s (Gen Z/Alpha) group, representing 50% of guests.
Recommendations for Hosts
- Balance marketing efforts between domestic and international channels based on the guest mix.
- Tailor amenities and listing descriptions to appeal to the dominant Post-2000s (Gen Z/Alpha) demographic (e.g., highlight fast WiFi, smart home features, local guides).
- Highlight unique local experiences or amenities relevant to the primary guest profile.
- Consider seasonal promotions aligned with peak travel times for key origin markets.
Nearby Short-Term Rental Market Comparison
How does the Oriental Airbnb market stack up against its neighbors? Compare key performance metrics like average monthly revenue, ADR, and occupancy rates in surrounding areas to understand the broader regional STR landscape.
| Market | Active Properties | Monthly Revenue | Daily Rate | Avg. Occupancy |
|---|---|---|---|---|
| Caldera | 35 | $2,855 | $229.64 | 37% |
| Quepos | 1,067 | $2,837 | $250.94 | 41% |
| Savegre | 186 | $2,480 | $226.45 | 38% |
| Jacó | 1,991 | $2,392 | $285.98 | 34% |
| Bahía Ballena | 1,225 | $2,217 | $216.14 | 39% |
| Tárcoles | 294 | $2,197 | $246.31 | 33% |
| Salitral | 10 | $2,188 | $218.55 | 32% |
| Monterrey | 53 | $2,101 | $133.95 | 52% |
| Sierra | 76 | $1,829 | $127.83 | 43% |
| Peñas Blancas | 413 | $1,781 | $147.12 | 40% |