San Ignacio & Santa Elena Airbnb Market Analysis 2026: Short Term Rental Data & Vacation Rental Statistics in Cayo District, Belize
Is Airbnb profitable in San Ignacio & Santa Elena in 2026? Explore comprehensive Airbnb analytics for San Ignacio & Santa Elena, Cayo District, Belize to uncover income potential. This 2026 STR market report for San Ignacio & Santa Elena, based on AirROI data from February 2025 to January 2026, reveals key trends in the niche market of 156 active listings.
Whether you're considering an Airbnb investment in San Ignacio & Santa Elena, optimizing your existing vacation rental, or exploring rental arbitrage opportunities, understanding the San Ignacio & Santa Elena Airbnb data is crucial. Leveraging the low regulation environment is key to maximizing your short term rental income potential. Let's dive into the specifics.
Key San Ignacio & Santa Elena Airbnb Performance Metrics Overview
Monthly Airbnb Revenue Variations & Income Potential in San Ignacio & Santa Elena (2026)
Understanding the monthly revenue variations for Airbnb listings in San Ignacio & Santa Elena is key to maximizing your short term rental income potential. Seasonality significantly impacts earnings. Our analysis, based on data from the past 12 months, shows that the peak revenue month for STRs in San Ignacio & Santa Elena is typically March, while October often presents the lowest earnings, highlighting opportunities for strategic pricing adjustments during shoulder and low seasons. Explore the typical Airbnb income in San Ignacio & Santa Elena across different performance tiers:
- Best-in-class properties (Top 10%) achieve $4,366+ monthly, often utilizing dynamic pricing and superior guest experiences.
- Strong performing properties (Top 25%) earn $2,188 or more, indicating effective management and desirable locations/amenities.
- Typical properties (Median) generate around $1,113 per month, representing the average market performance.
- Entry-level properties (Bottom 25%) see earnings around $510, often with potential for optimization.
Average Monthly Airbnb Earnings Trend in San Ignacio & Santa Elena
San Ignacio & Santa Elena Airbnb Occupancy Rate Trends (2026)
Maximize your bookings by understanding the San Ignacio & Santa Elena STR occupancy trends. Seasonal demand shifts significantly influence how often properties are booked. Typically, Februarysees the highest demand (peak season occupancy), while September experiences the lowest (low season). Effective strategies, like adjusting minimum stays or offering promotions, can boost occupancy during slower periods. Here's how different property tiers perform in San Ignacio & Santa Elena:
- Best-in-class properties (Top 10%) achieve 75%+ occupancy, indicating high desirability and potentially optimized availability.
- Strong performing properties (Top 25%) maintain 60% or higher occupancy, suggesting good market fit and guest satisfaction.
- Typical properties (Median) have an occupancy rate around 36%.
- Entry-level properties (Bottom 25%) average 17% occupancy, potentially facing higher vacancy.
Average Monthly Occupancy Rate Trend in San Ignacio & Santa Elena
Average Daily Rate (ADR) Airbnb Trends in San Ignacio & Santa Elena (2026)
Effective short term rental pricing strategy in San Ignacio & Santa Elena involves understanding monthly ADR fluctuations. The Average Daily Rate (ADR) for Airbnb in San Ignacio & Santa Elena typically peaks in February and dips lowest during September. Leveraging Airbnb dynamic pricing tools or strategies based on this seasonality can significantly boost revenue. Here's a look at the typical nightly rates achieved:
- Best-in-class properties (Top 10%) command rates of $283+ per night, often due to premium features or locations.
- Strong performing properties (Top 25%) achieve nightly rates of $174 or more.
- Typical properties (Median) charge around $93 per night.
- Entry-level properties (Bottom 25%) earn around $63 per night.
Average Daily Rate (ADR) Trend by Month in San Ignacio & Santa Elena
Get Live San Ignacio & Santa Elena Market Intelligence 👇

Explore Real-time Analytics
Airbnb Seasonality Analysis & Trends in San Ignacio & Santa Elena (2026)
Peak Season (March, February, December)
- Revenue averages $2,132 per month
- Occupancy rates average 50.5%
- Daily rates average $140
Shoulder Season
- Revenue averages $1,920 per month
- Occupancy maintains around 39.0%
- Daily rates hold near $137
Low Season (September, October, November)
- Revenue drops to average $1,230 per month
- Occupancy decreases to average 28.9%
- Daily rates adjust to average $130
Seasonality Insights for San Ignacio & Santa Elena
- The Airbnb seasonality in San Ignacio & Santa Elena shows moderate seasonality with distinct peak and low periods. While the sections above show seasonal averages, it's also insightful to look at the extremes:
- During the high season, the absolute peak month showcases San Ignacio & Santa Elena's highest earning potential, with monthly revenues capable of climbing to $2,209, occupancy reaching a high of 55.9%, and ADRs peaking at $141.
- Conversely, the slowest single month of the year, typically falling within the low season, marks the market's lowest point. In this month, revenue might dip to $1,068, occupancy could drop to 24.6%, and ADRs may adjust down to $127.
- Understanding both the seasonal averages and these monthly peaks and troughs in revenue, occupancy, and ADR is crucial for maximizing your Airbnb profit potential in San Ignacio & Santa Elena.
Seasonal Strategies for Maximizing Profit
- Peak Season: Maximize revenue through premium pricing and potentially longer minimum stays. Ensure high availability.
- Low Season: Offer competitive pricing, special promotions (e.g., extended stay discounts), and flexible cancellation policies. Target off-season travelers like remote workers or budget-conscious guests.
- Shoulder Seasons: Implement dynamic pricing that balances peak and low rates. Target weekend travelers or specific events. Offer slightly more flexible terms than peak season.
- Regularly analyze your own performance against these San Ignacio & Santa Elena seasonality benchmarks and adjust your pricing and availability strategy accordingly.
Best Areas for Airbnb Investment in San Ignacio & Santa Elena (2026)
Exploring the top neighborhoods for short-term rentals in San Ignacio & Santa Elena? This section highlights key areas, outlining why they are attractive for hosts and guests, along with notable local attractions. Consider these locations based on your target guest profile and investment strategy.
| Neighborhood / Area | Why Host Here? (Target Guests & Appeal) | Key Attractions & Landmarks |
|---|---|---|
| The Belize Zoo Area | Located near one of Belize's most famous attractions, The Belize Zoo offers a unique experience for tourists interested in wildlife and nature. | The Belize Zoo, Local nature reserves, Caves Branch River, Community tours |
| San Ignacio Town | The bustling center of Cayo District and a hub for adventure tourism, San Ignacio is vibrant with culture and a gateway to Mayan ruins and outdoor activities. | Cahal Pech Archaeological Site, San Ignacio Market, Xunantunich Mayan Ruins, Mopan River, ATM Cave Tours |
| Santa Elena Town | Located next to San Ignacio, Santa Elena offers a more residential feel with local amenities, making it attractive for long-term rentals and travelers looking for local experiences. | Cultural events, Local food markets, Birdwatching opportunities, Proximity to San Ignacio |
| Mountain Pine Ridge | A beautiful mountainous area ideal for nature lovers, offering hiking, waterfalls, and secluded retreats, perfect for eco-tourism. | Big Rock Waterfall, Caracol Archaeological Site, Rio On Pools, Nature trails |
| Bullet Tree Falls | A quiet village close to San Ignacio, popular for its natural swimming spots and cultural tours. This area draws visitors interested in tranquility and local traditions. | Local artisan shops, River activities, Birdwatching, Mayan village experiences |
| Lamanai | Known for its ancient ruins and unique river tours, Lamanai attracts history enthusiasts and nature lovers alike. | Lamanai Mayan Ruins, Riverboat tours, Birdwatching, Mayan cultural experiences |
| Punta Gorda | While a bit farther from San Ignacio, it's a gateway to the southern reef and unique Garifuna culture, making it ideal for diverse travel experiences. | The southern reef, Garifuna cultural sites, Local shrimp farms, Bocawina Rainforest Reserve |
| Cayo Espanto | An exclusive private island destination known for luxury and seclusion, appealing to high-end travelers seeking unique experiences. | Private beaches, Snorkeling and diving spots, Luxury amenities, Secluded ocean views |
Understanding Airbnb License Requirements & STR Laws in San Ignacio & Santa Elena (2026)
While San Ignacio & Santa Elena, Cayo District, Belize currently shows low STR regulations, specific Airbnb license requirements might still exist or change. Always verify the latest short term rental regulations and Airbnb license requirements directly with local government authorities for San Ignacio & Santa Elena to ensure full compliance before hosting.
(Source: AirROI data, 2026, finding no licensed listings among those analyzed)
Top Performing Airbnb Properties in San Ignacio & Santa Elena (2026)
Benchmark your potential! Explore examples of top-performing Airbnb properties in San Ignacio & Santa Elenabased on Trailing Twelve Month (TTM) revenue. Analyze their characteristics, revenue, occupancy rate, and ADR to understand what drives success in this market.

Alma Del Rio Eco comfort on the water
Entire Place • 4 bedrooms
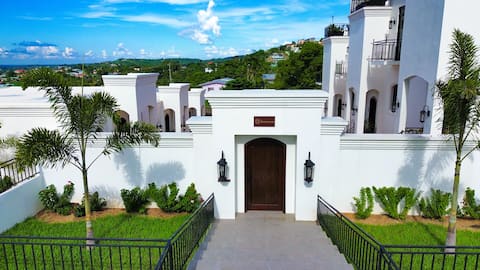
The Haciendas
Entire Place • 9 bedrooms

Rio Mantra-1 OR 2 Bedroom with a pool by the river
Entire Place • 2 bedrooms

Exotic 2 Bedroom Jungle View Penthouse in Belize
Entire Place • 2 bedrooms
Suzie's Hilltop Estate
Entire Place • 4 bedrooms

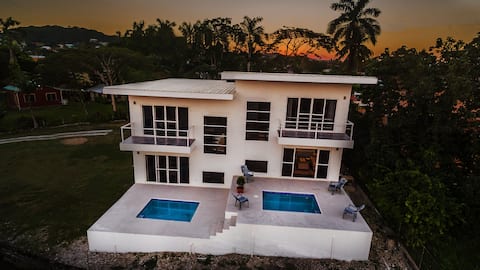
Superb modern house with pool for bird lovers
Entire Place • 3 bedrooms
Note: Performance varies based on location, size, amenities, seasonality, and management quality. Data reflects the past 12 months.
Top Performing Airbnb Hosts in San Ignacio & Santa Elena (2026)
Learn from the best! This table showcases top-performing Airbnb hosts in San Ignacio & Santa Elena based on the number of properties managed and estimated total revenue over the past year. Analyze their scale and performance metrics.
| Host Name | Properties | Grossing Revenue | Stay Reviews | Avg Rating |
|---|---|---|---|---|
| Alma | 9 | $475,837 | 684 | 4.95/5.0 |
| Laura | 7 | $376,126 | 466 | 4.99/5.0 |
| Jameli | 4 | $179,017 | 514 | 4.97/5.0 |
| Vanilla Hills | 5 | $112,089 | 130 | 5.00/5.0 |
| Larry | 1 | $78,894 | 18 | 5.00/5.0 |
| Michael | 7 | $76,299 | 427 | 4.53/5.0 |
| Juliet | 4 | $73,552 | 283 | 5.00/5.0 |
| Katia | 1 | $70,985 | 121 | 4.98/5.0 |
| Corrina | 1 | $70,949 | 16 | 4.94/5.0 |
| Pete | 4 | $59,609 | 1587 | 4.94/5.0 |
Analyzing the strategies of top hosts, such as their property selection, pricing, and guest communication, can offer valuable lessons for optimizing your own Airbnb operations in San Ignacio & Santa Elena.
Dive Deeper: Advanced San Ignacio & Santa Elena STR Market Data (2026)
Ready to unlock more insights? AirROI provides access to advanced metrics and comprehensive Airbnb data for San Ignacio & Santa Elena. Explore detailed analytics beyond this report to refine your investment strategy, optimize pricing, and maximize your vacation rental profits.
Explore Advanced MetricsSan Ignacio & Santa Elena Short-Term Rental Market Composition (2026): Property & Room Types
Room Type Distribution
Property Type Distribution
Market Composition Insights for San Ignacio & Santa Elena
- The San Ignacio & Santa Elena Airbnb market composition is heavily skewed towards Entire Home/Apt listings, which make up 73.7% of the 156 active rentals. This indicates strong guest preference for privacy and space.
- Looking at the property type distribution in San Ignacio & Santa Elena, House properties are the most common (37.8%), reflecting the local real estate landscape.
- Houses represent a significant 37.8% portion, catering likely to families or larger groups.
- The presence of 19.2% Hotel/Boutique listings indicates integration with traditional hospitality.
- Smaller segments like others (combined 0.6%) offer potential for unique stay experiences.
San Ignacio & Santa Elena Airbnb Room Capacity Analysis (2026): Bedroom Distribution
Distribution of Listings by Number of Bedrooms
Room Capacity Insights for San Ignacio & Santa Elena
- The dominant room capacity in San Ignacio & Santa Elena is 1 bedroom listings, making up 47.4% of the market. This suggests a strong demand for properties suitable for couples or solo travelers.
- Together, 1 bedroom and 2 bedrooms properties represent 71.8% of the active Airbnb listings in San Ignacio & Santa Elena, indicating a high concentration in these sizes.
San Ignacio & Santa Elena Vacation Rental Guest Capacity Trends (2026)
Distribution of Listings by Guest Capacity
Guest Capacity Insights for San Ignacio & Santa Elena
- The most common guest capacity trend in San Ignacio & Santa Elena vacation rentals is listings accommodating 2 guests (38.5%). This suggests the primary traveler segment is likely couples or solo travelers.
- Properties designed for 2 guests and 4 guests dominate the San Ignacio & Santa Elena STR market, accounting for 64.1% of listings.
- 20.5% of properties accommodate 6+ guests, serving the market segment for larger families or group travel in San Ignacio & Santa Elena.
- On average, properties in San Ignacio & Santa Elena are equipped to host 3.5 guests.
San Ignacio & Santa Elena Airbnb Booking Patterns (2026): Available vs. Booked Days
Available Days Distribution
Booked Days Distribution
Booking Pattern Insights for San Ignacio & Santa Elena
- The most common availability pattern in San Ignacio & Santa Elena falls within the 271-366 days range, representing 52.6% of listings. This suggests many properties have significant open periods on their calendars.
- Approximately 76.3% of listings show high availability (181+ days open annually), indicating potential for increased bookings or specific owner usage patterns.
- For booked days, the 31-90 days range is most frequent in San Ignacio & Santa Elena (37.2%), reflecting common guest stay durations or potential owner blocking patterns.
- A notable 25.0% of properties secure long booking periods (181+ days booked per year), highlighting successful long-term rental strategies or significant owner usage.
San Ignacio & Santa Elena Airbnb Minimum Stay Requirements Analysis
Distribution of Listings by Minimum Night Requirement
1 Night
75 listings
48.1% of total
2 Nights
61 listings
39.1% of total
3 Nights
5 listings
3.2% of total
30+ Nights
15 listings
9.6% of total
Key Insights
- The most prevalent minimum stay requirement in San Ignacio & Santa Elena is 1 Night, adopted by 48.1% of listings. This highlights the market's preference for shorter, flexible bookings.
- A strong majority (87.2%) of the San Ignacio & Santa Elena Airbnb data shows acceptance of very short stays (1-2 nights), indicating a dynamic, high-turnover market.
Recommendations
- Align with the market by considering a 1 Night minimum stay, as 48.1% of San Ignacio & Santa Elena hosts use this setting.
- Explore offering discounts for stays of 30+ nights to attract the 9.6% of the market seeking extended stays.
- Adjust minimum nights based on seasonality – potentially shorter during low season and longer during peak demand periods in San Ignacio & Santa Elena.
San Ignacio & Santa Elena Airbnb Cancellation Policy Trends Analysis (2026)
Limited
2 listings
1.3% of total
Super Strict 30 Days
6 listings
3.8% of total
Flexible
54 listings
34.6% of total
Moderate
44 listings
28.2% of total
Firm
41 listings
26.3% of total
Strict
9 listings
5.8% of total
Cancellation Policy Insights for San Ignacio & Santa Elena
- The prevailing Airbnb cancellation policy trend in San Ignacio & Santa Elena is Flexible, used by 34.6% of listings.
- There's a relatively balanced mix between guest-friendly (62.8%) and stricter (32.1%) policies, offering choices for different guest needs.
- Strict cancellation policies are quite rare (5.8%), potentially making listings with this policy less competitive unless justified by high demand or property type.
Recommendations for Hosts
- Consider adopting a Flexible policy to align with the 34.6% market standard in San Ignacio & Santa Elena.
- Using a Strict policy might deter some guests, as only 5.8% of listings use it. Evaluate if potential revenue protection outweighs possible lower booking rates.
- Regularly review your cancellation policy against competitors and market demand shifts in San Ignacio & Santa Elena.
San Ignacio & Santa Elena STR Booking Lead Time Analysis (2026)
Average Booking Lead Time by Month
Booking Lead Time Insights for San Ignacio & Santa Elena
- The overall average booking lead time for vacation rentals in San Ignacio & Santa Elena is 60 days.
- Guests book furthest in advance for stays during December (average 84 days), likely coinciding with peak travel demand or local events.
- The shortest booking windows occur for stays in October (average 47 days), indicating more last-minute travel plans during this time.
- Seasonally, Winter (76 days avg.) sees the longest lead times, while Summer (58 days avg.) has the shortest, reflecting typical travel planning cycles.
Recommendations for Hosts
- Use the overall average lead time (60 days) as a baseline for your pricing and availability strategy in San Ignacio & Santa Elena.
- For December stays, consider implementing length-of-stay discounts or slightly higher rates for bookings made less than 84 days out to capitalize on advance planning.
- Target marketing efforts for the Winter season well in advance (at least 76 days) to capture early planners.
- Monitor your own booking lead times against these San Ignacio & Santa Elena averages to identify opportunities for dynamic pricing adjustments.
Popular & Essential Airbnb Amenities in San Ignacio & Santa Elena (2026)
Amenity Prevalence
Amenity Insights for San Ignacio & Santa Elena
- Essential amenities in San Ignacio & Santa Elena that guests expect include: Wifi. Lacking these (this) could significantly impact bookings.
- Popular amenities like Smoke alarm, Fire extinguisher, Air conditioning are common but not universal. Offering these can provide a competitive edge.
Recommendations for Hosts
- Ensure your listing includes all essential amenities for San Ignacio & Santa Elena: Wifi.
- Consider adding popular differentiators like Smoke alarm or Fire extinguisher to increase appeal.
- Highlight unique or less common amenities you offer (e.g., hot tub, dedicated workspace, EV charger) in your listing description and photos.
- Regularly check competitor amenities in San Ignacio & Santa Elena to stay competitive.
San Ignacio & Santa Elena Airbnb Guest Demographics & Profile Analysis (2026)
Guest Profile Summary for San Ignacio & Santa Elena
- The typical guest profile for Airbnb in San Ignacio & Santa Elena consists of predominantly international visitors (97%), with top international origins including Canada, typically belonging to the Post-2000s (Gen Z/Alpha) group (50%), primarily speaking English or Spanish.
- Domestic travelers account for 3.1% of guests.
- Key international markets include United States (70.7%) and Canada (12.6%).
- Top languages spoken are English (59.7%) followed by Spanish (17.6%).
- A significant demographic segment is the Post-2000s (Gen Z/Alpha) group, representing 50% of guests.
Recommendations for Hosts
- Focus marketing internationally, particularly towards travelers from Canada.
- Tailor amenities and listing descriptions to appeal to the dominant Post-2000s (Gen Z/Alpha) demographic (e.g., highlight fast WiFi, smart home features, local guides).
- Highlight unique local experiences or amenities relevant to the primary guest profile.
- Consider seasonal promotions aligned with peak travel times for key origin markets.
Nearby Short-Term Rental Market Comparison
How does the San Ignacio & Santa Elena Airbnb market stack up against its neighbors? Compare key performance metrics like average monthly revenue, ADR, and occupancy rates in surrounding areas to understand the broader regional STR landscape.
| Market | Active Properties | Monthly Revenue | Daily Rate | Avg. Occupancy |
|---|---|---|---|---|
| Maya Beach | 76 | $4,346 | $421.40 | 38% |
| Seine Bight | 26 | $3,700 | $413.82 | 38% |
| Caribbean Way | 26 | $3,083 | $361.55 | 37% |
| Hopkins Village | 67 | $2,814 | $300.89 | 35% |
| Placencia | 297 | $2,167 | $296.42 | 34% |
| Caye Caulker Village | 356 | $1,975 | $173.01 | 42% |
| Hopkins | 90 | $1,547 | $193.17 | 33% |
| Buenavista | 33 | $1,203 | $261.52 | 24% |
| Bacalar | 804 | $1,157 | $138.03 | 34% |
| Dangriga Town | 16 | $1,145 | $193.34 | 27% |