Willebroek Airbnb Market Analysis 2025: Short Term Rental Data & Vacation Rental Statistics in Antwerp, Belgium
Is Airbnb profitable in Willebroek in 2025? Explore comprehensive Airbnb analytics for Willebroek, Antwerp, Belgium to uncover income potential. This 2025 STR market report for Willebroek, based on AirROI data from June 2024 to May 2025, reveals key trends in the niche market of 22 active listings.
Whether you're considering an Airbnb investment in Willebroek, optimizing your existing vacation rental, or exploring rental arbitrage opportunities, understanding the Willebroek Airbnb data is crucial. Leveraging the low regulation environment is key to maximizing your short term rental income potential. Let's dive into the specifics.
Key Willebroek Airbnb Performance Metrics Overview
Monthly Airbnb Revenue Variations & Income Potential in Willebroek (2025)
Understanding the monthly revenue variations for Airbnb listings in Willebroek is key to maximizing your short term rental income potential. Seasonality significantly impacts earnings. Our analysis, based on data from the past 12 months, shows that the peak revenue month for STRs in Willebroek is typically August, while December often presents the lowest earnings, highlighting opportunities for strategic pricing adjustments during shoulder and low seasons. Explore the typical Airbnb income in Willebroek across different performance tiers:
- Best-in-class properties (Top 10%) achieve $5,964+ monthly, often utilizing dynamic pricing and superior guest experiences.
- Strong performing properties (Top 25%) earn $3,491 or more, indicating effective management and desirable locations/amenities.
- Typical properties (Median) generate around $1,973 per month, representing the average market performance.
- Entry-level properties (Bottom 25%) see earnings around $882, often with potential for optimization.
Average Monthly Airbnb Earnings Trend in Willebroek
Willebroek Airbnb Occupancy Rate Trends (2025)
Maximize your bookings by understanding the Willebroek STR occupancy trends. Seasonal demand shifts significantly influence how often properties are booked. Typically, Octobersees the highest demand (peak season occupancy), while January experiences the lowest (low season). Effective strategies, like adjusting minimum stays or offering promotions, can boost occupancy during slower periods. Here's how different property tiers perform in Willebroek:
- Best-in-class properties (Top 10%) achieve 57%+ occupancy, indicating high desirability and potentially optimized availability.
- Strong performing properties (Top 25%) maintain 44% or higher occupancy, suggesting good market fit and guest satisfaction.
- Typical properties (Median) have an occupancy rate around 26%.
- Entry-level properties (Bottom 25%) average 15% occupancy, potentially facing higher vacancy.
Average Monthly Occupancy Rate Trend in Willebroek
Average Daily Rate (ADR) Airbnb Trends in Willebroek (2025)
Effective short term rental pricing strategy in Willebroek involves understanding monthly ADR fluctuations. The Average Daily Rate (ADR) for Airbnb in Willebroek typically peaks in February and dips lowest during November. Leveraging Airbnb dynamic pricing tools or strategies based on this seasonality can significantly boost revenue. Here's a look at the typical nightly rates achieved:
- Best-in-class properties (Top 10%) command rates of $547+ per night, often due to premium features or locations.
- Strong performing properties (Top 25%) achieve nightly rates of $347 or more.
- Typical properties (Median) charge around $227 per night.
- Entry-level properties (Bottom 25%) earn around $148 per night.
Average Daily Rate (ADR) Trend by Month in Willebroek
Get Live Willebroek Market Intelligence 👇

Explore Real-time Analytics
Airbnb Seasonality Analysis & Trends in Willebroek (2025)
Peak Season (August, February, October)
- Revenue averages $3,855 per month
- Occupancy rates average 45.0%
- Daily rates average $264
Shoulder Season
- Revenue averages $2,444 per month
- Occupancy maintains around 31.1%
- Daily rates hold near $284
Low Season (January, November, December)
- Revenue drops to average $1,751 per month
- Occupancy decreases to average 19.8%
- Daily rates adjust to average $256
Seasonality Insights for Willebroek
- The Airbnb seasonality in Willebroek shows highly seasonal trends requiring careful strategy. While the sections above show seasonal averages, it's also insightful to look at the extremes:
- During the high season, the absolute peak month showcases Willebroek's highest earning potential, with monthly revenues capable of climbing to $4,004, occupancy reaching a high of 51.6%, and ADRs peaking at $351.
- Conversely, the slowest single month of the year, typically falling within the low season, marks the market's lowest point. In this month, revenue might dip to $1,528, occupancy could drop to 16.7%, and ADRs may adjust down to $220.
- Understanding both the seasonal averages and these monthly peaks and troughs in revenue, occupancy, and ADR is crucial for maximizing your Airbnb profit potential in Willebroek.
Seasonal Strategies for Maximizing Profit
- Peak Season: Maximize revenue through premium pricing and potentially longer minimum stays. Ensure high availability.
- Low Season: Offer competitive pricing, special promotions (e.g., extended stay discounts), and flexible cancellation policies. Target off-season travelers like remote workers or budget-conscious guests.
- Shoulder Seasons: Implement dynamic pricing that balances peak and low rates. Target weekend travelers or specific events. Offer slightly more flexible terms than peak season.
- Regularly analyze your own performance against these Willebroek seasonality benchmarks and adjust your pricing and availability strategy accordingly.
Best Areas for Airbnb Investment in Willebroek (2025)
Exploring the top neighborhoods for short-term rentals in Willebroek? This section highlights key areas, outlining why they are attractive for hosts and guests, along with notable local attractions. Consider these locations based on your target guest profile and investment strategy.
| Neighborhood / Area | Why Host Here? (Target Guests & Appeal) | Key Attractions & Landmarks |
|---|---|---|
| Willebroek City Center | The heart of Willebroek with shops, restaurants, and easy access to public transport. A popular choice for tourists and business travelers due to its central location. | Willebroek Market Square, Local shops, Restaurants and cafes, Public transport access, Nearby parks |
| Mechelen | Just a short distance away, Mechelen is a historical city with a rich cultural heritage. It’s attractive for visitors who are looking for a charming stay in a nearby city. | Mechelen St. Rumbold's Cathedral, Kazerne Dossin, Mechelen Toy Museum, Historical city center, Parks and gardens |
| Antwerp | The nearby city of Antwerp is a major tourist destination with a vibrant arts scene, shopping, and historical sites. Perfect for those looking to experience the larger city while still being based in Willebroek. | Antwerp Cathedral, Museum aan de Stroom (MAS), Antwerp Zoo, Meir shopping street, Diamond District |
| Laarne | A picturesque area known for its castle and natural beauty. Attracts visitors interested in history and nature, making it an ideal spot for a quiet getaway. | Laarne Castle, Local nature parks, Cycling routes, Historical buildings |
| Dendermonde | A historic town with beautiful architecture and a lively atmosphere. It’s appealing for its quaint charm and events throughout the year. | Dendermonde Town Square, The Abbey of Our Lady, Local museums, Cinemas and theaters |
| Zemst | Close to Willebroek, Zemst offers a peaceful suburban environment. Great for families looking to visit nearby attractions in a quieter setting. | Zemst Park, Local recreation areas, Family-friendly venues, Cycling and walking paths |
| Schelle | Another nearby town that provides a relaxing atmosphere while still being close to major attractions in Antwerp and Willebroek. Ideal for travelers looking for tranquility. | Local parks, Historic sites, Cafes and restaurants |
| Bornem | Famous for its abbey and historical significance, Bornem is a charming town that attracts visitors interested in local culture and history. | Bornem Abbey, Castle of Borsbeek, Local festivals, Historical landmarks |
Understanding Airbnb License Requirements & STR Laws in Willebroek (2025)
While Willebroek, Antwerp, Belgium currently shows low STR regulations, specific Airbnb license requirements might still exist or change. Always verify the latest short term rental regulations and Airbnb license requirements directly with local government authorities for Willebroek to ensure full compliance before hosting.
(Source: AirROI data, 2025, finding no licensed listings among those analyzed)
Top Performing Airbnb Properties in Willebroek (2025)
Benchmark your potential! Explore examples of top-performing Airbnb properties in Willebroekbased on Trailing Twelve Month (TTM) revenue. Analyze their characteristics, revenue, occupancy rate, and ADR to understand what drives success in this market.
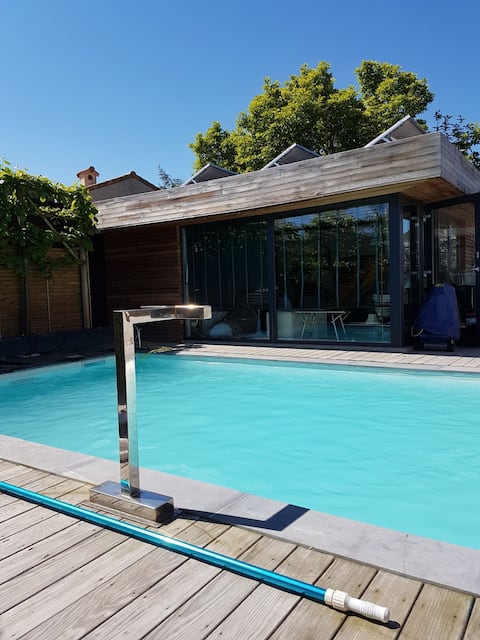
zwembadhuisje, keuken badkamer.
Entire Place • 1 bedroom
Your private stay to enjoy Tomorrowland in peace.
Entire Place • 2 bedrooms
Cosy Room 1,3 km to TML (30min. Walking)
Private Room • 1 bedroom

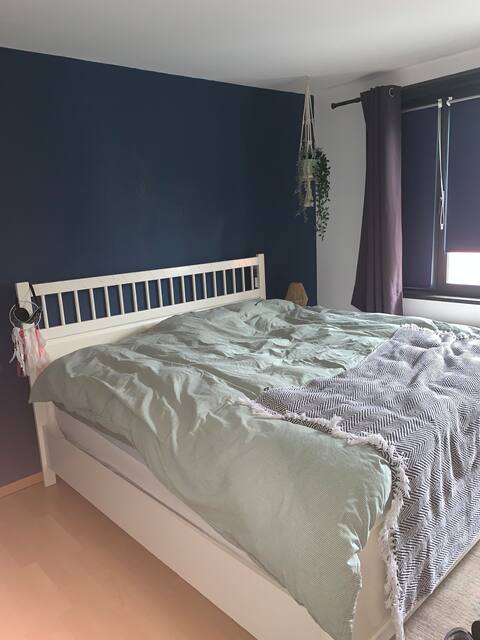
Tomorrowland - Willebroek 4p. 3 rooms - garden
Private Room • 3 bedrooms
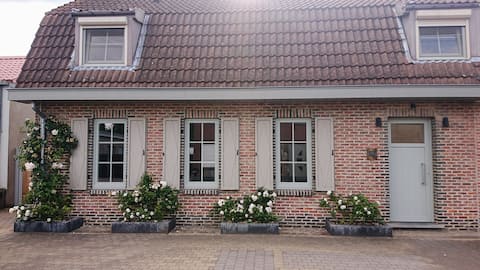
Cosy house in Willebroek-Antwerp
Entire Place • 2 bedrooms

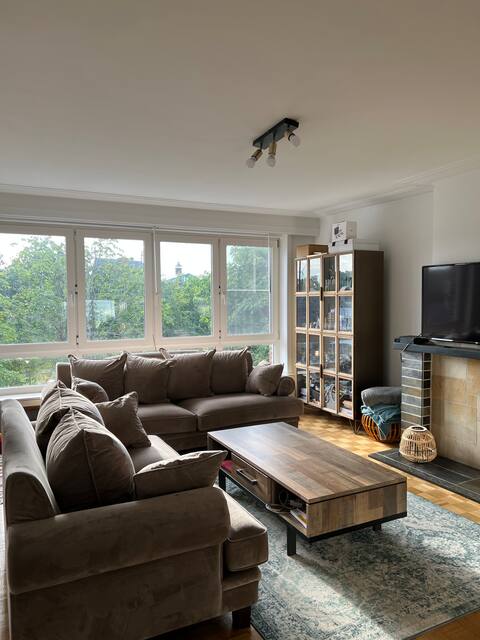
Appartement met garagebox
Entire Place • 1 bedroom
Note: Performance varies based on location, size, amenities, seasonality, and management quality. Data reflects the past 12 months.
Top Performing Airbnb Hosts in Willebroek (2025)
Learn from the best! This table showcases top-performing Airbnb hosts in Willebroek based on the number of properties managed and estimated total revenue over the past year. Analyze their scale and performance metrics.
| Host Name | Properties | Grossing Revenue | Stay Reviews | Avg Rating |
|---|---|---|---|---|
| Host #472899234 | 1 | $47,632 | 0 | N/A/5.0 |
| Bjorn | 1 | $38,702 | 4 | 5.00/5.0 |
| Host #182373644 | 1 | $30,616 | 0 | N/A/5.0 |
| Kathleen | 1 | $21,097 | 3 | 5.00/5.0 |
| Erik | 2 | $18,427 | 11 | 4.82/5.0 |
| Laetitia | 1 | $16,754 | 16 | 4.88/5.0 |
| Host #462270774 | 1 | $12,861 | 2 | N/A/5.0 |
| Karin | 1 | $10,843 | 12 | 5.00/5.0 |
| Karel | 1 | $9,308 | 3 | 5.00/5.0 |
| Wouter And Frederik | 1 | $8,118 | 39 | 4.90/5.0 |
Analyzing the strategies of top hosts, such as their property selection, pricing, and guest communication, can offer valuable lessons for optimizing your own Airbnb operations in Willebroek.
Dive Deeper: Advanced Willebroek STR Market Data (2025)
Ready to unlock more insights? AirROI provides access to advanced metrics and comprehensive Airbnb data for Willebroek. Explore detailed analytics beyond this report to refine your investment strategy, optimize pricing, and maximize your vacation rental profits.
Explore Advanced MetricsWillebroek Short-Term Rental Market Composition (2025): Property & Room Types
Room Type Distribution
Property Type Distribution
Market Composition Insights for Willebroek
- The Willebroek Airbnb market composition is heavily skewed towards Private Room listings, which make up 63.6% of the 22 active rentals. This indicates strong guest preference for privacy and space.
- Looking at the property type distribution in Willebroek, House properties are the most common (50%), reflecting the local real estate landscape.
- Houses represent a significant 50% portion, catering likely to families or larger groups.
- The presence of 31.8% Hotel/Boutique listings indicates integration with traditional hospitality.
- Smaller segments like outdoor/unique (combined 4.5%) offer potential for unique stay experiences.
Willebroek Airbnb Room Capacity Analysis (2025): Bedroom Distribution
Distribution of Listings by Number of Bedrooms
Room Capacity Insights for Willebroek
- The dominant room capacity in Willebroek is 2 bedrooms listings, making up 27.3% of the market. This suggests a strong demand for properties suitable for couples or solo travelers.
- Together, 2 bedrooms and 1 bedroom properties represent 45.5% of the active Airbnb listings in Willebroek, indicating a high concentration in these sizes.
Willebroek Vacation Rental Guest Capacity Trends (2025)
Distribution of Listings by Guest Capacity
Guest Capacity Insights for Willebroek
- The most common guest capacity trend in Willebroek vacation rentals is listings accommodating 2 guests (13.6%). This suggests the primary traveler segment is likely couples or solo travelers.
- Properties designed for 2 guests and 4 guests dominate the Willebroek STR market, accounting for 22.7% of listings.
- 13.6% of properties accommodate 6+ guests, serving the market segment for larger families or group travel in Willebroek.
- On average, properties in Willebroek are equipped to host 2.1 guests.
Willebroek Airbnb Booking Patterns (2025): Available vs. Booked Days
Available Days Distribution
Booked Days Distribution
Booking Pattern Insights for Willebroek
- The most common availability pattern in Willebroek falls within the 271-366 days range, representing 95.5% of listings. This suggests many properties have significant open periods on their calendars.
- Approximately 100.0% of listings show high availability (181+ days open annually), indicating potential for increased bookings or specific owner usage patterns.
- For booked days, the 31-90 days range is most frequent in Willebroek (50%), reflecting common guest stay durations or potential owner blocking patterns.
Willebroek Airbnb Minimum Stay Requirements Analysis
Distribution of Listings by Minimum Night Requirement
1 Night
4 listings
20% of total
2 Nights
7 listings
35% of total
3 Nights
8 listings
40% of total
30+ Nights
1 listings
5% of total
Key Insights
- The most prevalent minimum stay requirement in Willebroek is 3 Nights, adopted by 40% of listings. This highlights the market's preference for longer commitments.
Recommendations
- Align with the market by considering a 3 Nights minimum stay, as 40% of Willebroek hosts use this setting.
- If feasible, allowing 1-night stays, especially midweek or during low season, could capture last-minute bookings, as only 20% currently do.
- Adjust minimum nights based on seasonality – potentially shorter during low season and longer during peak demand periods in Willebroek.
Willebroek Airbnb Cancellation Policy Trends Analysis (2025)
Flexible
3 listings
20% of total
Moderate
6 listings
40% of total
Firm
2 listings
13.3% of total
Strict
4 listings
26.7% of total
Cancellation Policy Insights for Willebroek
- The prevailing Airbnb cancellation policy trend in Willebroek is Moderate, used by 40% of listings.
- There's a relatively balanced mix between guest-friendly (60.0%) and stricter (40.0%) policies, offering choices for different guest needs.
Recommendations for Hosts
- Consider adopting a Moderate policy to align with the 40% market standard in Willebroek.
- Regularly review your cancellation policy against competitors and market demand shifts in Willebroek.
Willebroek STR Booking Lead Time Analysis (2025)
Average Booking Lead Time by Month
Booking Lead Time Insights for Willebroek
- The overall average booking lead time for vacation rentals in Willebroek is 42 days.
- Guests book furthest in advance for stays during June (average 131 days), likely coinciding with peak travel demand or local events.
- The shortest booking windows occur for stays in September (average 7 days), indicating more last-minute travel plans during this time.
- Seasonally, Summer (78 days avg.) sees the longest lead times, while Fall (8 days avg.) has the shortest, reflecting typical travel planning cycles.
Recommendations for Hosts
- Use the overall average lead time (42 days) as a baseline for your pricing and availability strategy in Willebroek.
- For June stays, consider implementing length-of-stay discounts or slightly higher rates for bookings made less than 131 days out to capitalize on advance planning.
- During September, focus on last-minute booking availability and promotions, as guests book with very short notice (7 days avg.).
- Target marketing efforts for the Summer season well in advance (at least 78 days) to capture early planners.
- Monitor your own booking lead times against these Willebroek averages to identify opportunities for dynamic pricing adjustments.
Popular & Essential Airbnb Amenities in Willebroek (2025)
Amenity Prevalence
Amenity Insights for Willebroek
- Essential amenities in Willebroek that guests expect include: Wifi. Lacking these (this) could significantly impact bookings.
- Popular amenities like Heating, Smoke alarm, Free parking on premises are common but not universal. Offering these can provide a competitive edge.
Recommendations for Hosts
- Ensure your listing includes all essential amenities for Willebroek: Wifi.
- Prioritize adding missing essentials: Wifi.
- Consider adding popular differentiators like Heating or Smoke alarm to increase appeal.
- Highlight unique or less common amenities you offer (e.g., hot tub, dedicated workspace, EV charger) in your listing description and photos.
- Regularly check competitor amenities in Willebroek to stay competitive.
Willebroek Airbnb Guest Demographics & Profile Analysis (2025)
Guest Profile Summary for Willebroek
- The typical guest profile for Airbnb in Willebroek consists of predominantly international visitors (84%), with top international origins including France, typically belonging to the Post-2000s (Gen Z/Alpha) group (50%), primarily speaking English or French.
- Domestic travelers account for 16.2% of guests.
- Key international markets include Netherlands (21.6%) and France (18.9%).
- Top languages spoken are English (35.6%) followed by French (17.8%).
- A significant demographic segment is the Post-2000s (Gen Z/Alpha) group, representing 50% of guests.
Recommendations for Hosts
- Focus marketing internationally, particularly towards travelers from France.
- Tailor amenities and listing descriptions to appeal to the dominant Post-2000s (Gen Z/Alpha) demographic (e.g., highlight fast WiFi, smart home features, local guides).
- Highlight unique local experiences or amenities relevant to the primary guest profile.
- Consider seasonal promotions aligned with peak travel times for key origin markets.
Nearby Short-Term Rental Market Comparison
How does the Willebroek Airbnb market stack up against its neighbors? Compare key performance metrics like average monthly revenue, ADR, and occupancy rates in surrounding areas to understand the broader regional STR landscape.
| Market | Active Properties | Monthly Revenue | Daily Rate | Avg. Occupancy |
|---|---|---|---|---|
| Kockengen | 11 | $6,955 | $451.23 | 63% |
| Mont-de-l'Enclus | 10 | $5,756 | $378.03 | 42% |
| Bentveld | 13 | $5,409 | $461.67 | 56% |
| Merksplas | 13 | $4,776 | $309.15 | 41% |
| Dion | 12 | $4,720 | $274.00 | 58% |
| Jemeppe-sur-Sambre | 10 | $4,334 | $483.43 | 45% |
| Raamsdonksveer | 15 | $3,962 | $497.14 | 40% |
| Aerdenhout | 19 | $3,907 | $651.91 | 49% |
| Oud Ade | 17 | $3,879 | $284.15 | 54% |
| Halfweg | 18 | $3,796 | $234.00 | 55% |