New Montrose Airbnb Market Analysis 2025: Short Term Rental Data & Vacation Rental Statistics in Saint George, St. Vincent & Grenadines
Is Airbnb profitable in New Montrose in 2025? Explore comprehensive Airbnb analytics for New Montrose, Saint George, St. Vincent & Grenadines to uncover income potential. This 2025 STR market report for New Montrose, based on AirROI data from June 2024 to May 2025, reveals key trends in the niche market of 19 active listings.
Whether you're considering an Airbnb investment in New Montrose, optimizing your existing vacation rental, or exploring rental arbitrage opportunities, understanding the New Montrose Airbnb data is crucial. Leveraging the low regulation environment is key to maximizing your short term rental income potential. Let's dive into the specifics.
Key New Montrose Airbnb Performance Metrics Overview
Monthly Airbnb Revenue Variations & Income Potential in New Montrose (2025)
Understanding the monthly revenue variations for Airbnb listings in New Montrose is key to maximizing your short term rental income potential. Seasonality significantly impacts earnings. Our analysis, based on data from the past 12 months, shows that the peak revenue month for STRs in New Montrose is typically March, while September often presents the lowest earnings, highlighting opportunities for strategic pricing adjustments during shoulder and low seasons. Explore the typical Airbnb income in New Montrose across different performance tiers:
- Best-in-class properties (Top 10%) achieve $2,696+ monthly, often utilizing dynamic pricing and superior guest experiences.
- Strong performing properties (Top 25%) earn $1,671 or more, indicating effective management and desirable locations/amenities.
- Typical properties (Median) generate around $732 per month, representing the average market performance.
- Entry-level properties (Bottom 25%) see earnings around $388, often with potential for optimization.
Average Monthly Airbnb Earnings Trend in New Montrose
New Montrose Airbnb Occupancy Rate Trends (2025)
Maximize your bookings by understanding the New Montrose STR occupancy trends. Seasonal demand shifts significantly influence how often properties are booked. Typically, Julysees the highest demand (peak season occupancy), while September experiences the lowest (low season). Effective strategies, like adjusting minimum stays or offering promotions, can boost occupancy during slower periods. Here's how different property tiers perform in New Montrose:
- Best-in-class properties (Top 10%) achieve 79%+ occupancy, indicating high desirability and potentially optimized availability.
- Strong performing properties (Top 25%) maintain 59% or higher occupancy, suggesting good market fit and guest satisfaction.
- Typical properties (Median) have an occupancy rate around 29%.
- Entry-level properties (Bottom 25%) average 13% occupancy, potentially facing higher vacancy.
Average Monthly Occupancy Rate Trend in New Montrose
Average Daily Rate (ADR) Airbnb Trends in New Montrose (2025)
Effective short term rental pricing strategy in New Montrose involves understanding monthly ADR fluctuations. The Average Daily Rate (ADR) for Airbnb in New Montrose typically peaks in February and dips lowest during December. Leveraging Airbnb dynamic pricing tools or strategies based on this seasonality can significantly boost revenue. Here's a look at the typical nightly rates achieved:
- Best-in-class properties (Top 10%) command rates of $148+ per night, often due to premium features or locations.
- Strong performing properties (Top 25%) achieve nightly rates of $105 or more.
- Typical properties (Median) charge around $74 per night.
- Entry-level properties (Bottom 25%) earn around $56 per night.
Average Daily Rate (ADR) Trend by Month in New Montrose
Get Live New Montrose Market Intelligence 👇

Explore Real-time Analytics
Airbnb Seasonality Analysis & Trends in New Montrose (2025)
Peak Season (March, January, July)
- Revenue averages $1,381 per month
- Occupancy rates average 43.3%
- Daily rates average $88
Shoulder Season
- Revenue averages $1,145 per month
- Occupancy maintains around 38.7%
- Daily rates hold near $87
Low Season (June, September, October)
- Revenue drops to average $835 per month
- Occupancy decreases to average 32.5%
- Daily rates adjust to average $81
Seasonality Insights for New Montrose
- The Airbnb seasonality in New Montrose shows moderate seasonality with distinct peak and low periods. While the sections above show seasonal averages, it's also insightful to look at the extremes:
- During the high season, the absolute peak month showcases New Montrose's highest earning potential, with monthly revenues capable of climbing to $1,441, occupancy reaching a high of 47.7%, and ADRs peaking at $97.
- Conversely, the slowest single month of the year, typically falling within the low season, marks the market's lowest point. In this month, revenue might dip to $823, occupancy could drop to 31.1%, and ADRs may adjust down to $79.
- Understanding both the seasonal averages and these monthly peaks and troughs in revenue, occupancy, and ADR is crucial for maximizing your Airbnb profit potential in New Montrose.
Seasonal Strategies for Maximizing Profit
- Peak Season: Maximize revenue through premium pricing and potentially longer minimum stays. Ensure high availability.
- Low Season: Offer competitive pricing, special promotions (e.g., extended stay discounts), and flexible cancellation policies. Target off-season travelers like remote workers or budget-conscious guests.
- Shoulder Seasons: Implement dynamic pricing that balances peak and low rates. Target weekend travelers or specific events. Offer slightly more flexible terms than peak season.
- Regularly analyze your own performance against these New Montrose seasonality benchmarks and adjust your pricing and availability strategy accordingly.
Best Areas for Airbnb Investment in New Montrose (2025)
Exploring the top neighborhoods for short-term rentals in New Montrose? This section highlights key areas, outlining why they are attractive for hosts and guests, along with notable local attractions. Consider these locations based on your target guest profile and investment strategy.
| Neighborhood / Area | Why Host Here? (Target Guests & Appeal) | Key Attractions & Landmarks |
|---|---|---|
| New Montrose | A central and vibrant area of Saint George, known for its mix of local culture and easy access to tourist attractions. Ideal for travelers seeking convenience and connectivity to the rest of the island. | Botanical Gardens, Fort Charlotte, Kingstown Market, Saint Vincent National Park, Grenadine Island Tours |
| Kingstown | The capital city and a bustling port town with rich history and culture. Kingstown is well-suited for tourists who want to explore the local heritage and enjoy urban amenities. | St. George's Cathedral, Market Square, Heritage Museum, Villa Beach, Fort James |
| Reduit Beach | A popular beach destination known for its stunning views and vibrant atmosphere. Ideal for beach lovers and water sports enthusiasts looking for a fun and relaxed stay. | Reduit Beach, Pigeon Point Beach, Rodney Bay Marina, Castries Market, Fort Rodney |
| Bequia | One of the most famous Grenadine islands, known for its laid-back charm and beautiful beaches. A perfect getaway for tourists seeking tranquility and natural beauty. | Princess Margaret Beach, Lower Bay Beach, Bequia Old Fort, Whale Watching Tours, Dining at local seafood restaurants |
| Canouan | An exclusive destination known for luxury resorts and pristine beaches. Attracts high-end travelers looking for relaxation and beauty in an idyllic setting. | Canouan Beach, Pink Sands Beach, The Grenadines Estate Golf Club, Luxury resorts, Water sports activities |
| Mayreau | A small and quiet island great for those seeking a more secluded experience. Perfect for couples and travelers looking for romance and tranquility away from the crowds. | Salt Whistle Bay, Tobago Cays, Local fish shacks, Snorkeling spots, Hiking trails |
| Union Island | Known for its vibrant local culture and beautiful landscapes. Ideal for adventurous travelers looking to explore both marine and wildlife. | Happy Island, Union Island Beach, Climbing Mount Tibrogagen, Island hopping tours, Snorkeling and diving spots |
| Palm Island | An exclusive resort destination known for its luxurious accommodations and pristine beaches. Attracts those looking for a high-end getaway and relaxation. | Palm Island Beach, Snorkeling sites, Tropical gardens, Water sports options, Fine dining experiences |
Understanding Airbnb License Requirements & STR Laws in New Montrose (2025)
While New Montrose, Saint George, St. Vincent & Grenadines currently shows low STR regulations, specific Airbnb license requirements might still exist or change. Always verify the latest short term rental regulations and Airbnb license requirements directly with local government authorities for New Montrose to ensure full compliance before hosting.
(Source: AirROI data, 2025, based on 5% licensed listings)
Top Performing Airbnb Properties in New Montrose (2025)
Benchmark your potential! Explore examples of top-performing Airbnb properties in New Montrosebased on Trailing Twelve Month (TTM) revenue. Analyze their characteristics, revenue, occupancy rate, and ADR to understand what drives success in this market.
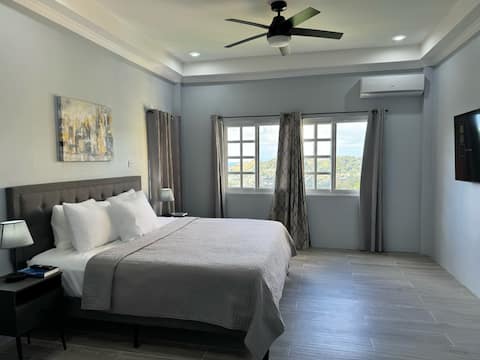
Ridge View
Entire Place • 3 bedrooms
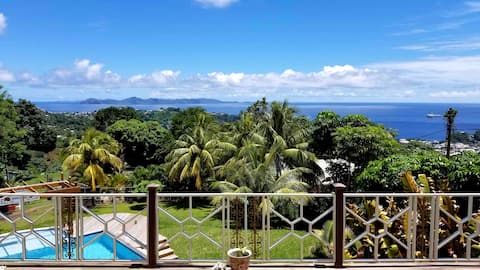
forst Villa- Best ocean view in St.Vincent!!!
Entire Place • 3 bedrooms
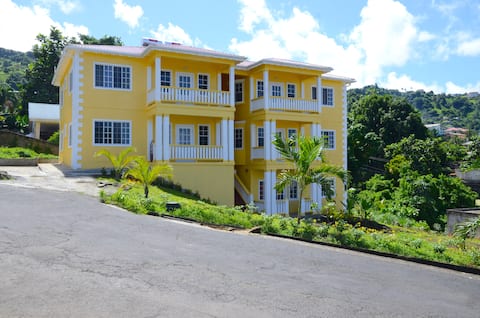
Liberty Suites
Entire Place • 2 bedrooms

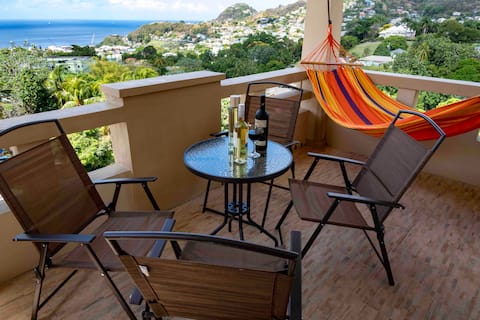
Royal Bliss Apartment Suites (Modern 1-Bedroom) #2
Private Room • 1 bedroom
Royal Bliss Apartment Suites (Modern 2-Bedroom)
Private Room • 2 bedrooms

Caribbean Home - Walking Distance from City Center
Entire Place • 2 bedrooms
Note: Performance varies based on location, size, amenities, seasonality, and management quality. Data reflects the past 12 months.
Top Performing Airbnb Hosts in New Montrose (2025)
Learn from the best! This table showcases top-performing Airbnb hosts in New Montrose based on the number of properties managed and estimated total revenue over the past year. Analyze their scale and performance metrics.
| Host Name | Properties | Grossing Revenue | Stay Reviews | Avg Rating |
|---|---|---|---|---|
| Dalano | 1 | $35,053 | 15 | 5.00/5.0 |
| Apollo | 1 | $27,221 | 131 | 4.79/5.0 |
| Jovianne | 3 | $26,113 | 18 | 4.87/5.0 |
| Noelene | 2 | $22,328 | 40 | 4.87/5.0 |
| Andrew | 1 | $9,090 | 53 | 4.72/5.0 |
| Leroy | 1 | $7,233 | 4 | 5.00/5.0 |
| Neisa | 1 | $4,876 | 29 | 4.83/5.0 |
| Alicia | 2 | $4,456 | 18 | 4.72/5.0 |
| Kurtney | 1 | $2,955 | 3 | 5.00/5.0 |
| Rachel | 1 | $2,524 | 13 | 4.85/5.0 |
Analyzing the strategies of top hosts, such as their property selection, pricing, and guest communication, can offer valuable lessons for optimizing your own Airbnb operations in New Montrose.
Dive Deeper: Advanced New Montrose STR Market Data (2025)
Ready to unlock more insights? AirROI provides access to advanced metrics and comprehensive Airbnb data for New Montrose. Explore detailed analytics beyond this report to refine your investment strategy, optimize pricing, and maximize your vacation rental profits.
Explore Advanced MetricsNew Montrose Short-Term Rental Market Composition (2025): Property & Room Types
Room Type Distribution
Property Type Distribution
Market Composition Insights for New Montrose
- The New Montrose Airbnb market composition is heavily skewed towards Entire Home/Apt listings, which make up 63.2% of the 19 active rentals. This indicates strong guest preference for privacy and space.
- However, a notable 36.8% share for Private Rooms suggests opportunities for budget-conscious travelers or hosts renting out spare rooms.
- Looking at the property type distribution in New Montrose, Apartment/Condo properties are the most common (63.2%), reflecting the local real estate landscape.
- Houses represent a significant 36.8% portion, catering likely to families or larger groups.
New Montrose Airbnb Room Capacity Analysis (2025): Bedroom Distribution
Distribution of Listings by Number of Bedrooms
Room Capacity Insights for New Montrose
- The dominant room capacity in New Montrose is 1 bedroom listings, making up 52.6% of the market. This suggests a strong demand for properties suitable for couples or solo travelers.
- Together, 1 bedroom and 2 bedrooms properties represent 78.9% of the active Airbnb listings in New Montrose, indicating a high concentration in these sizes.
- With over half the market (52.6%) consisting of studios or 1-bedroom units, New Montrose is particularly well-suited for individuals or couples.
New Montrose Vacation Rental Guest Capacity Trends (2025)
Distribution of Listings by Guest Capacity
Guest Capacity Insights for New Montrose
- The most common guest capacity trend in New Montrose vacation rentals is listings accommodating 2 guests (47.4%). This suggests the primary traveler segment is likely couples or solo travelers.
- Properties designed for 2 guests and 4 guests dominate the New Montrose STR market, accounting for 73.7% of listings.
- A significant 47.4% of listings cater specifically to 1-2 guests, highlighting strong demand from couples and solo travelers in New Montrose.
- 15.8% of properties accommodate 6+ guests, serving the market segment for larger families or group travel in New Montrose.
- On average, properties in New Montrose are equipped to host 2.9 guests.
New Montrose Airbnb Booking Patterns (2025): Available vs. Booked Days
Available Days Distribution
Booked Days Distribution
Booking Pattern Insights for New Montrose
- The most common availability pattern in New Montrose falls within the 271-366 days range, representing 68.4% of listings. This suggests many properties have significant open periods on their calendars.
- Approximately 84.2% of listings show high availability (181+ days open annually), indicating potential for increased bookings or specific owner usage patterns.
- For booked days, the 31-90 days range is most frequent in New Montrose (42.1%), reflecting common guest stay durations or potential owner blocking patterns.
- A notable 15.8% of properties secure long booking periods (181+ days booked per year), highlighting successful long-term rental strategies or significant owner usage.
New Montrose Airbnb Minimum Stay Requirements Analysis
Distribution of Listings by Minimum Night Requirement
1 Night
10 listings
52.6% of total
2 Nights
4 listings
21.1% of total
3 Nights
2 listings
10.5% of total
7-29 Nights
2 listings
10.5% of total
30+ Nights
1 listings
5.3% of total
Key Insights
- The most prevalent minimum stay requirement in New Montrose is 1 Night, adopted by 52.6% of listings. This highlights the market's preference for shorter, flexible bookings.
- A strong majority (73.7%) of the New Montrose Airbnb data shows acceptance of very short stays (1-2 nights), indicating a dynamic, high-turnover market.
Recommendations
- Align with the market by considering a 1 Night minimum stay, as 52.6% of New Montrose hosts use this setting.
- Explore offering discounts for stays of 30+ nights to attract the 5.3% of the market seeking extended stays.
- Adjust minimum nights based on seasonality – potentially shorter during low season and longer during peak demand periods in New Montrose.
New Montrose Airbnb Cancellation Policy Trends Analysis (2025)
Flexible
10 listings
58.8% of total
Moderate
2 listings
11.8% of total
Firm
2 listings
11.8% of total
Strict
3 listings
17.6% of total
Cancellation Policy Insights for New Montrose
- The prevailing Airbnb cancellation policy trend in New Montrose is Flexible, used by 58.8% of listings.
- The market strongly favors guest-friendly terms, with 70.6% of listings offering Flexible or Moderate policies. This suggests guests in New Montrose may expect booking flexibility.
Recommendations for Hosts
- Consider adopting a Flexible policy to align with the 58.8% market standard in New Montrose.
- Given the high prevalence of Flexible policies (58.8%), offering this can enhance booking appeal, especially during shoulder seasons.
- Regularly review your cancellation policy against competitors and market demand shifts in New Montrose.
New Montrose STR Booking Lead Time Analysis (2025)
Average Booking Lead Time by Month
Booking Lead Time Insights for New Montrose
- The overall average booking lead time for vacation rentals in New Montrose is 36 days.
- Guests book furthest in advance for stays during June (average 86 days), likely coinciding with peak travel demand or local events.
- The shortest booking windows occur for stays in September (average 15 days), indicating more last-minute travel plans during this time.
- Seasonally, Summer (64 days avg.) sees the longest lead times, while Fall (28 days avg.) has the shortest, reflecting typical travel planning cycles.
Recommendations for Hosts
- Use the overall average lead time (36 days) as a baseline for your pricing and availability strategy in New Montrose.
- For June stays, consider implementing length-of-stay discounts or slightly higher rates for bookings made less than 86 days out to capitalize on advance planning.
- Target marketing efforts for the Summer season well in advance (at least 64 days) to capture early planners.
- Monitor your own booking lead times against these New Montrose averages to identify opportunities for dynamic pricing adjustments.
Popular & Essential Airbnb Amenities in New Montrose (2025)
Amenity Prevalence
Amenity Insights for New Montrose
- Essential amenities in New Montrose that guests expect include: Wifi, Washer, TV. Lacking these (any) could significantly impact bookings.
- Popular amenities like Air conditioning, Kitchen, Hot water are common but not universal. Offering these can provide a competitive edge.
Recommendations for Hosts
- Ensure your listing includes all essential amenities for New Montrose: Wifi, Washer, TV.
- Consider adding popular differentiators like Air conditioning or Kitchen to increase appeal.
- Highlight unique or less common amenities you offer (e.g., hot tub, dedicated workspace, EV charger) in your listing description and photos.
- Regularly check competitor amenities in New Montrose to stay competitive.
New Montrose Airbnb Guest Demographics & Profile Analysis (2025)
Guest Profile Summary for New Montrose
- The typical guest profile for Airbnb in New Montrose consists of predominantly international visitors (100%), with top international origins including United Kingdom, typically belonging to the Post-2000s (Gen Z/Alpha) group (50%), primarily speaking English or German.
- Domestic travelers account for 0.0% of guests.
- Key international markets include United States (35.4%) and United Kingdom (22.9%).
- Top languages spoken are English (70.4%) followed by German (7.4%).
- A significant demographic segment is the Post-2000s (Gen Z/Alpha) group, representing 50% of guests.
Recommendations for Hosts
- Focus marketing internationally, particularly towards travelers from United Kingdom.
- Tailor amenities and listing descriptions to appeal to the dominant Post-2000s (Gen Z/Alpha) demographic (e.g., highlight fast WiFi, smart home features, local guides).
- Highlight unique local experiences or amenities relevant to the primary guest profile.
- Consider seasonal promotions aligned with peak travel times for key origin markets.
Nearby Short-Term Rental Market Comparison
How does the New Montrose Airbnb market stack up against its neighbors? Compare key performance metrics like average monthly revenue, ADR, and occupancy rates in surrounding areas to understand the broader regional STR landscape.
| Market | Active Properties | Monthly Revenue | Daily Rate | Avg. Occupancy |
|---|---|---|---|---|
| Westerhall Point | 10 | $4,565 | $527.12 | 40% |
| Soufrière | 98 | $3,512 | $266.02 | 50% |
| Cap Estate | 18 | $3,240 | $540.67 | 31% |
| Pigeon Island | 38 | $3,216 | $364.58 | 39% |
| Coolie Town | 103 | $3,164 | $385.53 | 41% |
| Gros Islet | 78 | $3,040 | $401.53 | 40% |
| Belvedere | 17 | $2,731 | $236.00 | 50% |
| Piaye | 22 | $1,880 | $181.48 | 38% |
| Morne Rouge | 15 | $1,821 | $186.13 | 42% |
| Rodney Bay | 268 | $1,805 | $307.10 | 37% |