Trevine Airbnb Market Analysis 2025: Short Term Rental Data & Vacation Rental Statistics in Wales, United Kingdom
Is Airbnb profitable in Trevine in 2025? Explore comprehensive Airbnb analytics for Trevine, Wales, United Kingdom to uncover income potential. This 2025 STR market report for Trevine, based on AirROI data from April 2024 to March 2025, reveals key trends in the niche market of 24 active listings.
Whether you're considering an Airbnb investment in Trevine, optimizing your existing vacation rental, or exploring rental arbitrage opportunities, understanding the Trevine Airbnb data is crucial. Leveraging the low regulation environment is key to maximizing your short term rental income potential. Let's dive into the specifics.
Key Trevine Airbnb Performance Metrics Overview
Monthly Airbnb Revenue Variations & Income Potential in Trevine (2025)
Understanding the monthly revenue variations for Airbnb listings in Trevine is key to maximizing your short term rental income potential. Seasonality significantly impacts earnings. Our analysis, based on data from the past 12 months, shows that the peak revenue month for STRs in Trevine is typically August, while March often presents the lowest earnings, highlighting opportunities for strategic pricing adjustments during shoulder and low seasons. Explore the typical Airbnb income in Trevine across different performance tiers:
- Best-in-class properties (Top 10%) achieve $6,886+ monthly, often utilizing dynamic pricing and superior guest experiences.
- Strong performing properties (Top 25%) earn $3,938 or more, indicating effective management and desirable locations/amenities.
- Typical properties (Median) generate around $2,500 per month, representing the average market performance.
- Entry-level properties (Bottom 25%) see earnings around $1,221, often with potential for optimization.
Average Monthly Airbnb Earnings Trend in Trevine
Trevine Airbnb Occupancy Rate Trends (2025)
Maximize your bookings by understanding the Trevine STR occupancy trends. Seasonal demand shifts significantly influence how often properties are booked. Typically, Augustsees the highest demand (peak season occupancy), while November experiences the lowest (low season). Effective strategies, like adjusting minimum stays or offering promotions, can boost occupancy during slower periods. Here's how different property tiers perform in Trevine:
- Best-in-class properties (Top 10%) achieve 86%+ occupancy, indicating high desirability and potentially optimized availability.
- Strong performing properties (Top 25%) maintain 73% or higher occupancy, suggesting good market fit and guest satisfaction.
- Typical properties (Median) have an occupancy rate around 50%.
- Entry-level properties (Bottom 25%) average 27% occupancy, potentially facing higher vacancy.
Average Monthly Occupancy Rate Trend in Trevine
Average Daily Rate (ADR) Airbnb Trends in Trevine (2025)
Effective short term rental pricing strategy in Trevine involves understanding monthly ADR fluctuations. The Average Daily Rate (ADR) for Airbnb in Trevine typically peaks in August and dips lowest during March. Leveraging Airbnb dynamic pricing tools or strategies based on this seasonality can significantly boost revenue. Here's a look at the typical nightly rates achieved:
- Best-in-class properties (Top 10%) command rates of $456+ per night, often due to premium features or locations.
- Strong performing properties (Top 25%) achieve nightly rates of $280 or more.
- Typical properties (Median) charge around $147 per night.
- Entry-level properties (Bottom 25%) earn around $109 per night.
Average Daily Rate (ADR) Trend by Month in Trevine
Get Live Trevine Market Intelligence 👇

Explore Real-time Analytics
Airbnb Seasonality Analysis & Trends in Trevine (2025)
Peak Season (August, July, May)
- Revenue averages $4,344 per month
- Occupancy rates average 56.7%
- Daily rates average $251
Shoulder Season
- Revenue averages $3,109 per month
- Occupancy maintains around 51.1%
- Daily rates hold near $215
Low Season (January, March, November)
- Revenue drops to average $1,944 per month
- Occupancy decreases to average 41.7%
- Daily rates adjust to average $161
Seasonality Insights for Trevine
- The Airbnb seasonality in Trevine shows highly seasonal trends requiring careful strategy. While the sections above show seasonal averages, it's also insightful to look at the extremes:
- During the high season, the absolute peak month showcases Trevine's highest earning potential, with monthly revenues capable of climbing to $5,115, occupancy reaching a high of 64.7%, and ADRs peaking at $260.
- Conversely, the slowest single month of the year, typically falling within the low season, marks the market's lowest point. In this month, revenue might dip to $1,883, occupancy could drop to 38.8%, and ADRs may adjust down to $159.
- Understanding both the seasonal averages and these monthly peaks and troughs in revenue, occupancy, and ADR is crucial for maximizing your Airbnb profit potential in Trevine.
Seasonal Strategies for Maximizing Profit
- Peak Season: Maximize revenue through premium pricing and potentially longer minimum stays. Ensure high availability.
- Low Season: Offer competitive pricing, special promotions (e.g., extended stay discounts), and flexible cancellation policies. Target off-season travelers like remote workers or budget-conscious guests.
- Shoulder Seasons: Implement dynamic pricing that balances peak and low rates. Target weekend travelers or specific events. Offer slightly more flexible terms than peak season.
- Regularly analyze your own performance against these Trevine seasonality benchmarks and adjust your pricing and availability strategy accordingly.
Best Areas for Airbnb Investment in Trevine (2025)
Exploring the top neighborhoods for short-term rentals in Trevine? This section highlights key areas, outlining why they are attractive for hosts and guests, along with notable local attractions. Consider these locations based on your target guest profile and investment strategy.
| Neighborhood / Area | Why Host Here? (Target Guests & Appeal) | Key Attractions & Landmarks |
|---|---|---|
| Trevine Beach | Beautiful coastal area known for its stunning cliffs and beaches. Ideal for tourists seeking outdoor adventures and relaxation by the sea, with access to walking trails and stunning views. | Trevine Bay Beach, Penbont Chapel, Porthgain Harbour, Mwnt Beach, Aberreiddy Beach |
| Trevine Village | Picturesque village offering a charming ambiance and local culture. Great for families and couples looking for a peaceful getaway, with friendly locals and quaint shops. | Trevine Village Hall, Local pubs, Galleries, Farmers markets, Community events |
| Cleddau Estuary | Scenic estuary location perfect for nature enthusiasts and bird watchers. A unique spot for visitors looking to explore wildlife and enjoy boating activities. | Cleddau Bridge, Wildlife nature reserves, Walking trails, Fishing spots, Kayaking opportunities |
| Skomer Island | Famous for its wildlife and scenic beauty, treasured by eco-tourists and nature lovers. It's an ideal location for those who enjoy natural landscapes and unique tours. | Skomer Island Nature Reserve, Puffin colonies, Wildflower scenery, Marine life exploring, Boat tours |
| Haverfordwest | Nearby town with historical significance and modern amenities. Excellent for guests wanting a mix of history, local culture, and convenience to various attractions. | Haverfordwest Castle, Pembrokeshire County Museum, Local shopping, Restaurants, Historic walking tours |
| St Davids | The smallest city in the UK, known for its impressive cathedral and stunning coastal scenery. A favored locale for travelers interested in history and scenic hiking. | St Davids Cathedral, Pembrokeshire Coast National Park, Whitesands Bay, Art galleries, Cafés |
| Porthgain | Quaint fishing village with artistic vibes, perfect for tourists interested in local cuisine and picturesque harbor views. Popular among artists and photographers. | Porthgain Harbour, Local seafood restaurants, Art studios, Walking trails, Historic ruins |
| Solva | Charming harbor village ideal for families and couples. Offers a blend of relaxation and activities like kayaking and coastal walking paths. | Solva Harbour, Kayaking and boating, Coastal paths, Local artisan shops, Scenic views |
Understanding Airbnb License Requirements & STR Laws in Trevine (2025)
While Trevine, Wales, United Kingdom currently shows low STR regulations, specific Airbnb license requirements might still exist or change. Always verify the latest short term rental regulations and Airbnb license requirements directly with local government authorities for Trevine to ensure full compliance before hosting.
(Source: AirROI data, 2025, finding no licensed listings among those analyzed)
Top Performing Airbnb Properties in Trevine (2025)
Benchmark your potential! Explore examples of top-performing Airbnb properties in Trevinebased on Trailing Twelve Month (TTM) revenue. Analyze their characteristics, revenue, occupancy rate, and ADR to understand what drives success in this market.
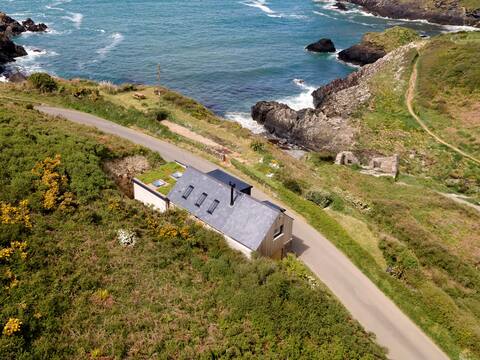
Cliff-top Cottage on Coast Path w/Panoramic Views
Entire Place • 2 bedrooms
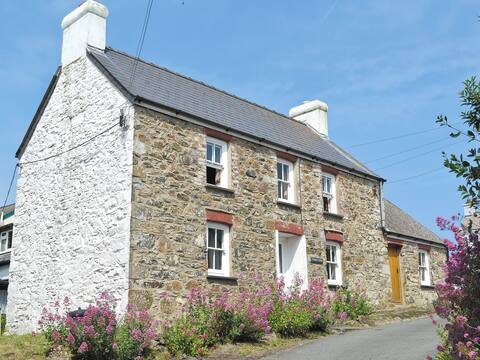
Trem-Y-Don Cottage
Entire Place • 3 bedrooms

Stunning coastal family friendly large stone barn
Entire Place • 7 bedrooms
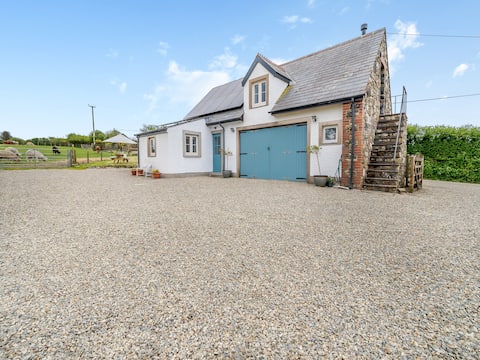
Caerau Bach
Entire Place • 2 bedrooms
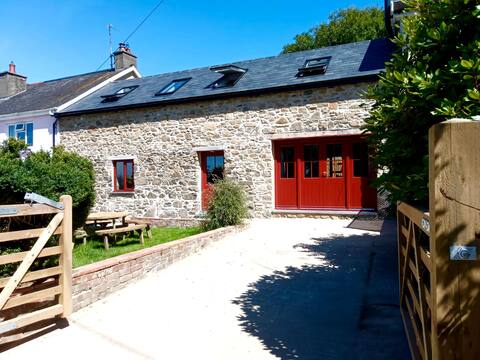
Cuddfan Fach - Stunning Barn near the Coast Path
Entire Place • 4 bedrooms
Ty Gwyn - Private Cottage by the sea
Entire Place • 1 bedroom
Note: Performance varies based on location, size, amenities, seasonality, and management quality. Data reflects the past 12 months.
Top Performing Airbnb Hosts in Trevine (2025)
Learn from the best! This table showcases top-performing Airbnb hosts in Trevine based on the number of properties managed and estimated total revenue over the past year. Analyze their scale and performance metrics.
| Host Name | Properties | Grossing Revenue | Stay Reviews | Avg Rating |
|---|---|---|---|---|
| Cottages | 6 | $195,288 | 60 | 3.94/5.0 |
| Tom | 1 | $104,558 | 43 | 4.98/5.0 |
| Daisy | 1 | $59,785 | 56 | 4.86/5.0 |
| Penny | 2 | $53,682 | 449 | 4.97/5.0 |
| Lindsay | 1 | $43,912 | 30 | 5.00/5.0 |
| Ryan | 1 | $31,114 | 9 | 5.00/5.0 |
| Sheryl | 1 | $27,520 | 96 | 4.96/5.0 |
| Kathryn | 1 | $26,726 | 133 | 4.89/5.0 |
| Host #328781103 | 1 | $24,301 | 114 | 4.28/5.0 |
| Rupert | 1 | $23,263 | 140 | 4.78/5.0 |
Analyzing the strategies of top hosts, such as their property selection, pricing, and guest communication, can offer valuable lessons for optimizing your own Airbnb operations in Trevine.
Dive Deeper: Advanced Trevine STR Market Data (2025)
Ready to unlock more insights? AirROI provides access to advanced metrics and comprehensive Airbnb data for Trevine. Explore detailed analytics beyond this report to refine your investment strategy, optimize pricing, and maximize your vacation rental profits.
Explore Advanced MetricsTrevine Short-Term Rental Market Composition (2025): Property & Room Types
Room Type Distribution
Property Type Distribution
Market Composition Insights for Trevine
- The Trevine Airbnb market composition is heavily skewed towards Entire Home/Apt listings, which make up 95.8% of the 24 active rentals. This indicates strong guest preference for privacy and space.
- Looking at the property type distribution in Trevine, House properties are the most common (87.5%), reflecting the local real estate landscape.
- Houses represent a significant 87.5% portion, catering likely to families or larger groups.
- Smaller segments like others (combined 4.2%) offer potential for unique stay experiences.
Trevine Airbnb Room Capacity Analysis (2025): Bedroom Distribution
Distribution of Listings by Number of Bedrooms
Room Capacity Insights for Trevine
- The dominant room capacity in Trevine is 2 bedrooms listings, making up 45.8% of the market. This suggests a strong demand for properties suitable for couples or solo travelers.
- Together, 2 bedrooms and 4 bedrooms properties represent 62.5% of the active Airbnb listings in Trevine, indicating a high concentration in these sizes.
- A significant 33.4% of listings offer 3+ bedrooms, catering to larger groups and families seeking more space in Trevine.
Trevine Vacation Rental Guest Capacity Trends (2025)
Distribution of Listings by Guest Capacity
Guest Capacity Insights for Trevine
- The most common guest capacity trend in Trevine vacation rentals is listings accommodating 4 guests (37.5%). This suggests the primary traveler segment is likely small families or groups.
- Properties designed for 4 guests and 8+ guests dominate the Trevine STR market, accounting for 54.2% of listings.
- 29.2% of properties accommodate 6+ guests, serving the market segment for larger families or group travel in Trevine.
- On average, properties in Trevine are equipped to host 4.5 guests.
Trevine Airbnb Booking Patterns (2025): Available vs. Booked Days
Available Days Distribution
Booked Days Distribution
Booking Pattern Insights for Trevine
- The most common availability pattern in Trevine falls within the 181-270 days range, representing 41.7% of listings. This suggests many properties have significant open periods on their calendars.
- Approximately 62.5% of listings show high availability (181+ days open annually), indicating potential for increased bookings or specific owner usage patterns.
- For booked days, the 91-180 days range is most frequent in Trevine (45.8%), reflecting common guest stay durations or potential owner blocking patterns.
- A notable 37.5% of properties secure long booking periods (181+ days booked per year), highlighting successful long-term rental strategies or significant owner usage.
Trevine Airbnb Minimum Stay Requirements Analysis
Distribution of Listings by Minimum Night Requirement
1 Night
4 listings
18.2% of total
2 Nights
5 listings
22.7% of total
3 Nights
2 listings
9.1% of total
4-6 Nights
4 listings
18.2% of total
7-29 Nights
2 listings
9.1% of total
30+ Nights
5 listings
22.7% of total
Key Insights
- The most prevalent minimum stay requirement in Trevine is 2 Nights, adopted by 22.7% of listings. This highlights the market's preference for shorter, flexible bookings.
- A significant segment (22.7%) caters to monthly stays (30+ nights) in Trevine, pointing to opportunities in the extended-stay market.
Recommendations
- Align with the market by considering a 2 Nights minimum stay, as 22.7% of Trevine hosts use this setting.
- If feasible, allowing 1-night stays, especially midweek or during low season, could capture last-minute bookings, as only 18.2% currently do.
- Explore offering discounts for stays of 30+ nights to attract the 22.7% of the market seeking extended stays.
- Adjust minimum nights based on seasonality – potentially shorter during low season and longer during peak demand periods in Trevine.
Trevine Airbnb Cancellation Policy Trends Analysis (2025)
Super Strict 60 Days
5 listings
23.8% of total
Flexible
1 listings
4.8% of total
Moderate
3 listings
14.3% of total
Firm
6 listings
28.6% of total
Strict
6 listings
28.6% of total
Cancellation Policy Insights for Trevine
- The prevailing Airbnb cancellation policy trend in Trevine is Firm, used by 28.6% of listings.
- A majority (57.2%) of hosts in Trevine utilize Firm or Strict policies, indicating a market where hosts prioritize booking security.
Recommendations for Hosts
- Consider adopting a Firm policy to align with the 28.6% market standard in Trevine.
- Regularly review your cancellation policy against competitors and market demand shifts in Trevine.
Trevine STR Booking Lead Time Analysis (2025)
Average Booking Lead Time by Month
Booking Lead Time Insights for Trevine
- The overall average booking lead time for vacation rentals in Trevine is 65 days.
- Guests book furthest in advance for stays during July (average 137 days), likely coinciding with peak travel demand or local events.
- The shortest booking windows occur for stays in October (average 37 days), indicating more last-minute travel plans during this time.
- Seasonally, Summer (122 days avg.) sees the longest lead times, while Fall (51 days avg.) has the shortest, reflecting typical travel planning cycles.
Recommendations for Hosts
- Use the overall average lead time (65 days) as a baseline for your pricing and availability strategy in Trevine.
- For July stays, consider implementing length-of-stay discounts or slightly higher rates for bookings made less than 137 days out to capitalize on advance planning.
- Target marketing efforts for the Summer season well in advance (at least 122 days) to capture early planners.
- Monitor your own booking lead times against these Trevine averages to identify opportunities for dynamic pricing adjustments.
Popular & Essential Airbnb Amenities in Trevine (2025)
Amenity Prevalence
Amenity Insights for Trevine
- Essential amenities in Trevine that guests expect include: Heating, Smoke alarm, Kitchen, TV, Wifi. Lacking these (any) could significantly impact bookings.
- Popular amenities like Washer, Bed linens, Hangers are common but not universal. Offering these can provide a competitive edge.
Recommendations for Hosts
- Ensure your listing includes all essential amenities for Trevine: Heating, Smoke alarm, Kitchen, TV, Wifi.
- Prioritize adding missing essentials: Kitchen, TV, Wifi.
- Consider adding popular differentiators like Washer or Bed linens to increase appeal.
- Highlight unique or less common amenities you offer (e.g., hot tub, dedicated workspace, EV charger) in your listing description and photos.
- Regularly check competitor amenities in Trevine to stay competitive.
Trevine Airbnb Guest Demographics & Profile Analysis (2025)
Guest Profile Summary for Trevine
- The typical guest profile for Airbnb in Trevine consists of primarily domestic travelers (90%), often arriving from nearby England, typically belonging to the Post-2000s (Gen Z/Alpha) group (50%), primarily speaking English or French.
- Domestic travelers account for 90.1% of guests.
- Key international markets include United Kingdom (90.1%) and United States (3.3%).
- Top languages spoken are English (63.9%) followed by French (11.3%).
- A significant demographic segment is the Post-2000s (Gen Z/Alpha) group, representing 50% of guests.
Recommendations for Hosts
- Target domestic marketing efforts towards travelers from England and London.
- Tailor amenities and listing descriptions to appeal to the dominant Post-2000s (Gen Z/Alpha) demographic (e.g., highlight fast WiFi, smart home features, local guides).
- Highlight unique local experiences or amenities relevant to the primary guest profile.
- Consider seasonal promotions aligned with peak travel times for key origin markets.
Nearby Short-Term Rental Market Comparison
How does the Trevine Airbnb market stack up against its neighbors? Compare key performance metrics like average monthly revenue, ADR, and occupancy rates in surrounding areas to understand the broader regional STR landscape.
| Market | Active Properties | Monthly Revenue | Daily Rate | Avg. Occupancy |
|---|---|---|---|---|
| Llanrhidian | 15 | $4,842 | $386.18 | 53% |
| Trenance | 19 | $4,795 | $428.63 | 43% |
| Angle | 13 | $4,602 | $384.81 | 42% |
| Ludchurch | 15 | $4,354 | $291.87 | 43% |
| Cwmann | 17 | $4,162 | $228.82 | 54% |
| Borth-y-Gêst | 18 | $4,139 | $240.51 | 55% |
| Redberth | 29 | $4,103 | $223.37 | 59% |
| Higher Crackington | 17 | $3,731 | $340.74 | 37% |
| Perranuthnoe | 24 | $3,421 | $352.15 | 37% |
| St. John | 44 | $3,354 | $233.49 | 50% |