Trefor Airbnb Market Analysis 2025: Short Term Rental Data & Vacation Rental Statistics in Wales, United Kingdom
Is Airbnb profitable in Trefor in 2025? Explore comprehensive Airbnb analytics for Trefor, Wales, United Kingdom to uncover income potential. This 2025 STR market report for Trefor, based on AirROI data from April 2024 to March 2025, reveals key trends in the niche market of 21 active listings.
Whether you're considering an Airbnb investment in Trefor, optimizing your existing vacation rental, or exploring rental arbitrage opportunities, understanding the Trefor Airbnb data is crucial. Leveraging the low regulation environment is key to maximizing your short term rental income potential. Let's dive into the specifics.
Key Trefor Airbnb Performance Metrics Overview
Monthly Airbnb Revenue Variations & Income Potential in Trefor (2025)
Understanding the monthly revenue variations for Airbnb listings in Trefor is key to maximizing your short term rental income potential. Seasonality significantly impacts earnings. Our analysis, based on data from the past 12 months, shows that the peak revenue month for STRs in Trefor is typically August, while March often presents the lowest earnings, highlighting opportunities for strategic pricing adjustments during shoulder and low seasons. Explore the typical Airbnb income in Trefor across different performance tiers:
- Best-in-class properties (Top 10%) achieve $6,322+ monthly, often utilizing dynamic pricing and superior guest experiences.
- Strong performing properties (Top 25%) earn $3,907 or more, indicating effective management and desirable locations/amenities.
- Typical properties (Median) generate around $2,331 per month, representing the average market performance.
- Entry-level properties (Bottom 25%) see earnings around $1,382, often with potential for optimization.
Average Monthly Airbnb Earnings Trend in Trefor
Trefor Airbnb Occupancy Rate Trends (2025)
Maximize your bookings by understanding the Trefor STR occupancy trends. Seasonal demand shifts significantly influence how often properties are booked. Typically, Augustsees the highest demand (peak season occupancy), while March experiences the lowest (low season). Effective strategies, like adjusting minimum stays or offering promotions, can boost occupancy during slower periods. Here's how different property tiers perform in Trefor:
- Best-in-class properties (Top 10%) achieve 68%+ occupancy, indicating high desirability and potentially optimized availability.
- Strong performing properties (Top 25%) maintain 56% or higher occupancy, suggesting good market fit and guest satisfaction.
- Typical properties (Median) have an occupancy rate around 39%.
- Entry-level properties (Bottom 25%) average 19% occupancy, potentially facing higher vacancy.
Average Monthly Occupancy Rate Trend in Trefor
Average Daily Rate (ADR) Airbnb Trends in Trefor (2025)
Effective short term rental pricing strategy in Trefor involves understanding monthly ADR fluctuations. The Average Daily Rate (ADR) for Airbnb in Trefor typically peaks in July and dips lowest during March. Leveraging Airbnb dynamic pricing tools or strategies based on this seasonality can significantly boost revenue. Here's a look at the typical nightly rates achieved:
- Best-in-class properties (Top 10%) command rates of $319+ per night, often due to premium features or locations.
- Strong performing properties (Top 25%) achieve nightly rates of $277 or more.
- Typical properties (Median) charge around $160 per night.
- Entry-level properties (Bottom 25%) earn around $114 per night.
Average Daily Rate (ADR) Trend by Month in Trefor
Get Live Trefor Market Intelligence 👇

Explore Real-time Analytics
Airbnb Seasonality Analysis & Trends in Trefor (2025)
Peak Season (August, June, July)
- Revenue averages $4,125 per month
- Occupancy rates average 53.1%
- Daily rates average $221
Shoulder Season
- Revenue averages $2,890 per month
- Occupancy maintains around 39.5%
- Daily rates hold near $203
Low Season (February, March, November)
- Revenue drops to average $1,902 per month
- Occupancy decreases to average 30.8%
- Daily rates adjust to average $201
Seasonality Insights for Trefor
- The Airbnb seasonality in Trefor shows highly seasonal trends requiring careful strategy. While the sections above show seasonal averages, it's also insightful to look at the extremes:
- During the high season, the absolute peak month showcases Trefor's highest earning potential, with monthly revenues capable of climbing to $4,873, occupancy reaching a high of 64.9%, and ADRs peaking at $224.
- Conversely, the slowest single month of the year, typically falling within the low season, marks the market's lowest point. In this month, revenue might dip to $1,510, occupancy could drop to 26.2%, and ADRs may adjust down to $195.
- Understanding both the seasonal averages and these monthly peaks and troughs in revenue, occupancy, and ADR is crucial for maximizing your Airbnb profit potential in Trefor.
Seasonal Strategies for Maximizing Profit
- Peak Season: Maximize revenue through premium pricing and potentially longer minimum stays. Ensure high availability.
- Low Season: Offer competitive pricing, special promotions (e.g., extended stay discounts), and flexible cancellation policies. Target off-season travelers like remote workers or budget-conscious guests.
- Shoulder Seasons: Implement dynamic pricing that balances peak and low rates. Target weekend travelers or specific events. Offer slightly more flexible terms than peak season.
- Regularly analyze your own performance against these Trefor seasonality benchmarks and adjust your pricing and availability strategy accordingly.
Best Areas for Airbnb Investment in Trefor (2025)
Exploring the top neighborhoods for short-term rentals in Trefor? This section highlights key areas, outlining why they are attractive for hosts and guests, along with notable local attractions. Consider these locations based on your target guest profile and investment strategy.
| Neighborhood / Area | Why Host Here? (Target Guests & Appeal) | Key Attractions & Landmarks |
|---|---|---|
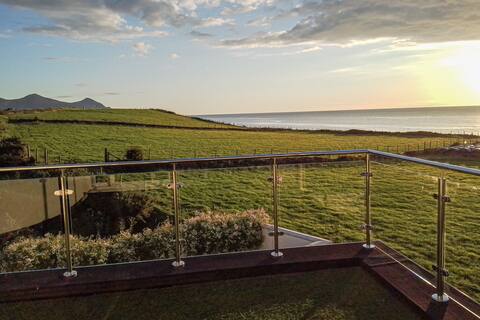
| Trefor Beach | Beautiful sandy beach offering stunning views and a tranquil atmosphere, great for families and beach lovers. Ideal for guests wanting to relax and enjoy the coastal scenery. | Trefor Beach, Cliff Walks, Bryn Ffynnon Coastal Path, Trefor Pier, Wave Watching |
| Cwmorthin Waterfall | A hidden gem in the mountains near Trefor, famous for its beautiful waterfall and scenic walking trails, adding a touch of adventure for nature enthusiasts. | Cwmorthin Waterfall, Mountain Hiking Trails, Picnic Spots, Wildlife Watching |
| Trwyn Dinllaen | A scenic headland offering breathtaking views of Cardigan Bay and the Llyn Peninsula, popular for outdoor activities and picturesque walks. | Trwyn Dinllaen Viewpoint, Outdoor Hikes, Scenic Views, Wildlife Photography |
| Nefyn | Charming village nearby known for its golf course and stunning beaches, appealing to visitors looking for relaxation and leisure activities. | Nefyn Golf Club, Nefyn Beach, Cafes and Restaurants, Local Markets |
| Llyn Peninsula | A well-known destination for its natural beauty and outdoor activities, the Llyn Peninsula attracts tourists seeking adventure and scenic landscapes. | Llyn Coastal Path, Abersoch Beach, Pwllheli Marina, Water Sports |
| Porth Dinllaen | A picturesque coastal village with historical significance, known for its beach and scenic harbour, great for romantic getaways. | Porth Dinllaen Beach, Historical Sites, Local Pubs, Scenic Views |
| Caernarfon | Historic town with a famous castle and vibrant culture, attracting tourists interested in history and heritage. | Caernarfon Castle, The Royal Town Walls, Caernarfon Harbour, Shopping and Dining |
| Snowdonia National Park | A short drive from Trefor, this national park is a major attraction for visitors seeking nature, hiking, and breathtaking landscapes. | Mount Snowdon, Hiking Trails, Scenic Views, Visitor Centres |
Understanding Airbnb License Requirements & STR Laws in Trefor (2025)
While Trefor, Wales, United Kingdom currently shows low STR regulations, specific Airbnb license requirements might still exist or change. Always verify the latest short term rental regulations and Airbnb license requirements directly with local government authorities for Trefor to ensure full compliance before hosting.
(Source: AirROI data, 2025, finding no licensed listings among those analyzed)
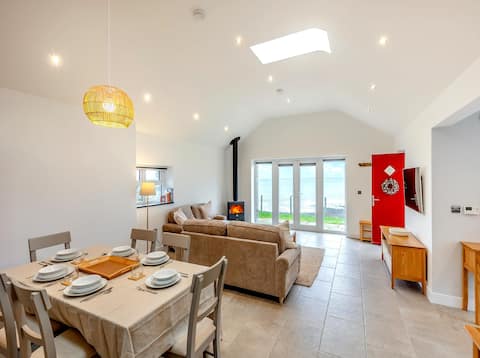
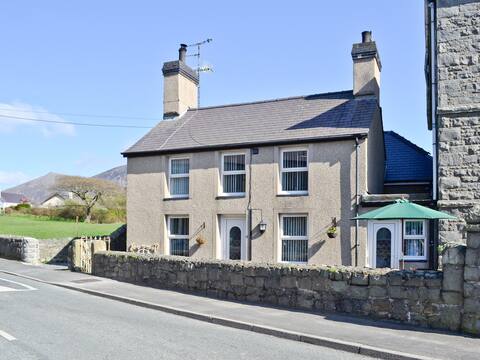
Top Performing Airbnb Properties in Trefor (2025)
Benchmark your potential! Explore examples of top-performing Airbnb properties in Treforbased on Trailing Twelve Month (TTM) revenue. Analyze their characteristics, revenue, occupancy rate, and ADR to understand what drives success in this market.
Y Beudy Gwydir
Entire Place • 2 bedrooms
Outstanding Natural Beauty at the heart of Angorfa
Entire Place • 4 bedrooms
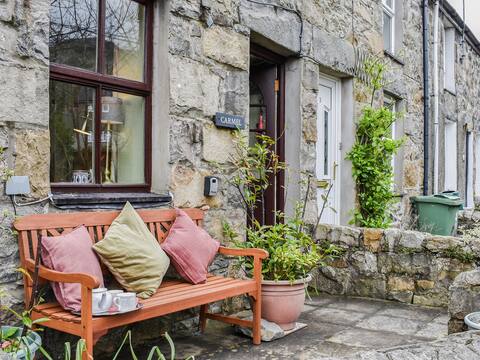
Carmel
Entire Place • 2 bedrooms

The Old Watermill
Entire Place • 5 bedrooms
Ty Capel Gosen
Entire Place • 2 bedrooms

Self-contained 2 bedroom annexe, patio & play area
Entire Place • 2 bedrooms
Note: Performance varies based on location, size, amenities, seasonality, and management quality. Data reflects the past 12 months.
Top Performing Airbnb Hosts in Trefor (2025)
Learn from the best! This table showcases top-performing Airbnb hosts in Trefor based on the number of properties managed and estimated total revenue over the past year. Analyze their scale and performance metrics.
| Host Name | Properties | Grossing Revenue | Stay Reviews | Avg Rating |
|---|---|---|---|---|
| Cottages | 9 | $245,123 | 54 | 3.36/5.0 |
| David | 1 | $58,624 | 32 | 4.81/5.0 |
| Emma | 2 | $43,666 | 127 | 4.89/5.0 |
| Annie | 1 | $40,274 | 36 | 4.86/5.0 |
| Elizabeth | 1 | $32,854 | 40 | 4.98/5.0 |
| Zoe | 1 | $24,665 | 49 | 4.96/5.0 |
| Clinton | 1 | $23,967 | 82 | 4.99/5.0 |
| Gwen | 1 | $20,711 | 227 | 4.97/5.0 |
| Megan | 1 | $20,166 | 43 | 4.65/5.0 |
| Mark | 1 | $15,907 | 83 | 4.83/5.0 |
Analyzing the strategies of top hosts, such as their property selection, pricing, and guest communication, can offer valuable lessons for optimizing your own Airbnb operations in Trefor.
Dive Deeper: Advanced Trefor STR Market Data (2025)
Ready to unlock more insights? AirROI provides access to advanced metrics and comprehensive Airbnb data for Trefor. Explore detailed analytics beyond this report to refine your investment strategy, optimize pricing, and maximize your vacation rental profits.
Explore Advanced MetricsTrefor Short-Term Rental Market Composition (2025): Property & Room Types
Room Type Distribution
Property Type Distribution
Market Composition Insights for Trefor
- The Trefor Airbnb market composition is heavily skewed towards Entire Home/Apt listings, which make up 95.2% of the 21 active rentals. This indicates strong guest preference for privacy and space.
- Looking at the property type distribution in Trefor, House properties are the most common (81%), reflecting the local real estate landscape.
- Houses represent a significant 81% portion, catering likely to families or larger groups.
- Smaller segments like hotel/boutique, outdoor/unique (combined 9.6%) offer potential for unique stay experiences.
Trefor Airbnb Room Capacity Analysis (2025): Bedroom Distribution
Distribution of Listings by Number of Bedrooms
Room Capacity Insights for Trefor
- The dominant room capacity in Trefor is 2 bedrooms listings, making up 66.7% of the market. This suggests a strong demand for properties suitable for couples or solo travelers.
- Together, 2 bedrooms and 3 bedrooms properties represent 81.0% of the active Airbnb listings in Trefor, indicating a high concentration in these sizes.
- A significant 28.6% of listings offer 3+ bedrooms, catering to larger groups and families seeking more space in Trefor.
Trefor Vacation Rental Guest Capacity Trends (2025)
Distribution of Listings by Guest Capacity
Guest Capacity Insights for Trefor
- The most common guest capacity trend in Trefor vacation rentals is listings accommodating 4 guests (61.9%). This suggests the primary traveler segment is likely small families or groups.
- Properties designed for 4 guests and 8+ guests dominate the Trefor STR market, accounting for 76.2% of listings.
- 28.6% of properties accommodate 6+ guests, serving the market segment for larger families or group travel in Trefor.
- On average, properties in Trefor are equipped to host 4.9 guests.
Trefor Airbnb Booking Patterns (2025): Available vs. Booked Days
Available Days Distribution
Booked Days Distribution
Booking Pattern Insights for Trefor
- The most common availability pattern in Trefor falls within the 181-270 days range, representing 47.6% of listings. This suggests many properties have significant open periods on their calendars.
- Approximately 80.9% of listings show high availability (181+ days open annually), indicating potential for increased bookings or specific owner usage patterns.
- For booked days, the 91-180 days range is most frequent in Trefor (42.9%), reflecting common guest stay durations or potential owner blocking patterns.
- A notable 23.8% of properties secure long booking periods (181+ days booked per year), highlighting successful long-term rental strategies or significant owner usage.
Trefor Airbnb Minimum Stay Requirements Analysis
Distribution of Listings by Minimum Night Requirement
1 Night
8 listings
42.1% of total
2 Nights
3 listings
15.8% of total
3 Nights
3 listings
15.8% of total
4-6 Nights
1 listings
5.3% of total
30+ Nights
4 listings
21.1% of total
Key Insights
- The most prevalent minimum stay requirement in Trefor is 1 Night, adopted by 42.1% of listings. This highlights the market's preference for shorter, flexible bookings.
- A significant segment (21.1%) caters to monthly stays (30+ nights) in Trefor, pointing to opportunities in the extended-stay market.
Recommendations
- Align with the market by considering a 1 Night minimum stay, as 42.1% of Trefor hosts use this setting.
- Explore offering discounts for stays of 30+ nights to attract the 21.1% of the market seeking extended stays.
- Adjust minimum nights based on seasonality – potentially shorter during low season and longer during peak demand periods in Trefor.
Trefor Airbnb Cancellation Policy Trends Analysis (2025)
Super Strict 60 Days
8 listings
42.1% of total
Flexible
2 listings
10.5% of total
Moderate
1 listings
5.3% of total
Firm
1 listings
5.3% of total
Strict
7 listings
36.8% of total
Cancellation Policy Insights for Trefor
- The prevailing Airbnb cancellation policy trend in Trefor is Super Strict 60 Days, used by 42.1% of listings.
- There's a relatively balanced mix between guest-friendly (15.8%) and stricter (42.1%) policies, offering choices for different guest needs.
Recommendations for Hosts
- Consider adopting a Super Strict 60 Days policy to align with the 42.1% market standard in Trefor.
- With 36.8% using Strict terms, this is a viable option in Trefor, particularly for high-value properties or during peak demand periods.
- Regularly review your cancellation policy against competitors and market demand shifts in Trefor.
Trefor STR Booking Lead Time Analysis (2025)
Average Booking Lead Time by Month
Booking Lead Time Insights for Trefor
- The overall average booking lead time for vacation rentals in Trefor is 53 days.
- Guests book furthest in advance for stays during May (average 91 days), likely coinciding with peak travel demand or local events.
- The shortest booking windows occur for stays in February (average 23 days), indicating more last-minute travel plans during this time.
- Seasonally, Summer (72 days avg.) sees the longest lead times, while Winter (42 days avg.) has the shortest, reflecting typical travel planning cycles.
Recommendations for Hosts
- Use the overall average lead time (53 days) as a baseline for your pricing and availability strategy in Trefor.
- For May stays, consider implementing length-of-stay discounts or slightly higher rates for bookings made less than 91 days out to capitalize on advance planning.
- Target marketing efforts for the Summer season well in advance (at least 72 days) to capture early planners.
- Monitor your own booking lead times against these Trefor averages to identify opportunities for dynamic pricing adjustments.
Popular & Essential Airbnb Amenities in Trefor (2025)
Amenity Prevalence
Amenity Insights for Trefor
- Essential amenities in Trefor that guests expect include: Smoke alarm, Heating, Bed linens, Kitchen. Lacking these (any) could significantly impact bookings.
- Popular amenities like Hangers, Fire extinguisher, TV are common but not universal. Offering these can provide a competitive edge.
- Warning: Wifi is not universally provided but is considered essential globally. Ensure reliable Wifi is offered.
Recommendations for Hosts
- Ensure your listing includes all essential amenities for Trefor: Smoke alarm, Heating, Bed linens, Kitchen.
- Prioritize adding missing essentials: Bed linens, Kitchen.
- Consider adding popular differentiators like Hangers or Fire extinguisher to increase appeal.
- Highlight unique or less common amenities you offer (e.g., hot tub, dedicated workspace, EV charger) in your listing description and photos.
- Regularly check competitor amenities in Trefor to stay competitive.
Trefor Airbnb Guest Demographics & Profile Analysis (2025)
Guest Profile Summary for Trefor
- The typical guest profile for Airbnb in Trefor consists of primarily domestic travelers (92%), often arriving from nearby England, typically belonging to the Post-2000s (Gen Z/Alpha) group (50%), primarily speaking English or German.
- Domestic travelers account for 91.9% of guests.
- Key international markets include United Kingdom (91.9%) and Germany (2.9%).
- Top languages spoken are English (65.9%) followed by German (8.5%).
- A significant demographic segment is the Post-2000s (Gen Z/Alpha) group, representing 50% of guests.
Recommendations for Hosts
- Target domestic marketing efforts towards travelers from England and Manchester.
- Tailor amenities and listing descriptions to appeal to the dominant Post-2000s (Gen Z/Alpha) demographic (e.g., highlight fast WiFi, smart home features, local guides).
- Highlight unique local experiences or amenities relevant to the primary guest profile.
- Consider seasonal promotions aligned with peak travel times for key origin markets.
Nearby Short-Term Rental Market Comparison
How does the Trefor Airbnb market stack up against its neighbors? Compare key performance metrics like average monthly revenue, ADR, and occupancy rates in surrounding areas to understand the broader regional STR landscape.
| Market | Active Properties | Monthly Revenue | Daily Rate | Avg. Occupancy |
|---|---|---|---|---|
| Abbeycwmhir | 10 | $4,502 | $259.18 | 49% |
| Eglwys-bach | 16 | $4,413 | $315.23 | 52% |
| Waverton | 16 | $4,358 | $444.20 | 33% |
| Chirbury | 14 | $4,233 | $702.20 | 41% |
| Seascale | 11 | $4,165 | $354.23 | 40% |
| Cwmann | 17 | $4,162 | $228.82 | 54% |
| Borth-y-Gêst | 18 | $4,139 | $240.51 | 55% |
| Valley | 18 | $4,042 | $254.80 | 44% |
| Braichmelyn | 41 | $3,894 | $246.43 | 54% |
| Rhoscolyn | 17 | $3,799 | $370.12 | 43% |