Talgarth Airbnb Market Analysis 2025: Short Term Rental Data & Vacation Rental Statistics in Wales, United Kingdom
Is Airbnb profitable in Talgarth in 2025? Explore comprehensive Airbnb analytics for Talgarth, Wales, United Kingdom to uncover income potential. This 2025 STR market report for Talgarth, based on AirROI data from April 2024 to March 2025, reveals key trends in the niche market of 26 active listings.
Whether you're considering an Airbnb investment in Talgarth, optimizing your existing vacation rental, or exploring rental arbitrage opportunities, understanding the Talgarth Airbnb data is crucial. Leveraging the low regulation environment is key to maximizing your short term rental income potential. Let's dive into the specifics.
Key Talgarth Airbnb Performance Metrics Overview
Monthly Airbnb Revenue Variations & Income Potential in Talgarth (2025)
Understanding the monthly revenue variations for Airbnb listings in Talgarth is key to maximizing your short term rental income potential. Seasonality significantly impacts earnings. Our analysis, based on data from the past 12 months, shows that the peak revenue month for STRs in Talgarth is typically August, while November often presents the lowest earnings, highlighting opportunities for strategic pricing adjustments during shoulder and low seasons. Explore the typical Airbnb income in Talgarth across different performance tiers:
- Best-in-class properties (Top 10%) achieve $6,043+ monthly, often utilizing dynamic pricing and superior guest experiences.
- Strong performing properties (Top 25%) earn $3,704 or more, indicating effective management and desirable locations/amenities.
- Typical properties (Median) generate around $2,335 per month, representing the average market performance.
- Entry-level properties (Bottom 25%) see earnings around $1,483, often with potential for optimization.
Average Monthly Airbnb Earnings Trend in Talgarth
Talgarth Airbnb Occupancy Rate Trends (2025)
Maximize your bookings by understanding the Talgarth STR occupancy trends. Seasonal demand shifts significantly influence how often properties are booked. Typically, Augustsees the highest demand (peak season occupancy), while January experiences the lowest (low season). Effective strategies, like adjusting minimum stays or offering promotions, can boost occupancy during slower periods. Here's how different property tiers perform in Talgarth:
- Best-in-class properties (Top 10%) achieve 79%+ occupancy, indicating high desirability and potentially optimized availability.
- Strong performing properties (Top 25%) maintain 67% or higher occupancy, suggesting good market fit and guest satisfaction.
- Typical properties (Median) have an occupancy rate around 52%.
- Entry-level properties (Bottom 25%) average 32% occupancy, potentially facing higher vacancy.
Average Monthly Occupancy Rate Trend in Talgarth
Average Daily Rate (ADR) Airbnb Trends in Talgarth (2025)
Effective short term rental pricing strategy in Talgarth involves understanding monthly ADR fluctuations. The Average Daily Rate (ADR) for Airbnb in Talgarth typically peaks in December and dips lowest during September. Leveraging Airbnb dynamic pricing tools or strategies based on this seasonality can significantly boost revenue. Here's a look at the typical nightly rates achieved:
- Best-in-class properties (Top 10%) command rates of $378+ per night, often due to premium features or locations.
- Strong performing properties (Top 25%) achieve nightly rates of $206 or more.
- Typical properties (Median) charge around $146 per night.
- Entry-level properties (Bottom 25%) earn around $113 per night.
Average Daily Rate (ADR) Trend by Month in Talgarth
Get Live Talgarth Market Intelligence 👇

Explore Real-time Analytics
Airbnb Seasonality Analysis & Trends in Talgarth (2025)
Peak Season (August, March, December)
- Revenue averages $3,698 per month
- Occupancy rates average 54.7%
- Daily rates average $218
Shoulder Season
- Revenue averages $3,060 per month
- Occupancy maintains around 52.0%
- Daily rates hold near $190
Low Season (January, June, November)
- Revenue drops to average $2,376 per month
- Occupancy decreases to average 41.0%
- Daily rates adjust to average $200
Seasonality Insights for Talgarth
- The Airbnb seasonality in Talgarth shows moderate seasonality with distinct peak and low periods. While the sections above show seasonal averages, it's also insightful to look at the extremes:
- During the high season, the absolute peak month showcases Talgarth's highest earning potential, with monthly revenues capable of climbing to $4,040, occupancy reaching a high of 63.2%, and ADRs peaking at $242.
- Conversely, the slowest single month of the year, typically falling within the low season, marks the market's lowest point. In this month, revenue might dip to $2,193, occupancy could drop to 39.2%, and ADRs may adjust down to $180.
- Understanding both the seasonal averages and these monthly peaks and troughs in revenue, occupancy, and ADR is crucial for maximizing your Airbnb profit potential in Talgarth.
Seasonal Strategies for Maximizing Profit
- Peak Season: Maximize revenue through premium pricing and potentially longer minimum stays. Ensure high availability.
- Low Season: Offer competitive pricing, special promotions (e.g., extended stay discounts), and flexible cancellation policies. Target off-season travelers like remote workers or budget-conscious guests.
- Shoulder Seasons: Implement dynamic pricing that balances peak and low rates. Target weekend travelers or specific events. Offer slightly more flexible terms than peak season.
- Regularly analyze your own performance against these Talgarth seasonality benchmarks and adjust your pricing and availability strategy accordingly.
Best Areas for Airbnb Investment in Talgarth (2025)
Exploring the top neighborhoods for short-term rentals in Talgarth? This section highlights key areas, outlining why they are attractive for hosts and guests, along with notable local attractions. Consider these locations based on your target guest profile and investment strategy.
| Neighborhood / Area | Why Host Here? (Target Guests & Appeal) | Key Attractions & Landmarks |
|---|---|---|
| Talgarth Town Center | The heart of Talgarth, featuring charming streets, local shops, and cafes. A great base for guests wanting to experience the local culture and community. | Talgarth Mill, The Black Mountains, Brecon Beacons National Park, The Talgarth Festival of Poetry and Arts, Local pubs and eateries |
| Brecon Beacons National Park | A stunning area of natural beauty, perfect for outdoor enthusiasts. It's great for hiking, cycling, and exploring nature, attracting a variety of tourists. | Pen y Fan, Scenic hiking trails, Waterfalls of the Brecon Beacons, Llangorse Lake, Wildlife watching |
| Talgarth Mill | A historical site with an engaging experience around traditional milling. Great for families and educational visits. | Working mill demonstrations, Café and gift shop, Educational exhibits, Woodland walks |
| The Black Mountains | Part of the Brecon Beacons, these mountains offer breathtaking views and challenging hikes, attracting adventure seekers and nature lovers. | Hiking and mountain biking trails, Scenic viewpoints, Wild camping sites, Beautiful landscapes |
| Llangorse Lake | Largest lake in South Wales, perfect for water sports and fishing. A popular spot for families and adventure tourism. | Sailing and kayaking, Fishing, Nature walks, Llangorse Activity Centre, Scenic picnic areas |
| Penoyre Park | A beautiful park location that attracts visitors for its scenic beauty and available outdoor activities such as walking and picnicking. | Scenic views and trails, Wildlife spotting, Picnic areas, Photography opportunities |
| The Epynt Way | An area known for hiking and exploring the unique landscapes of the Epynt Mountains. Great for more experienced walkers and explorers. | Hiking trails, Natural landscapes, Historical sites, Birdwatching |
| Talgarth Railway Walk | An accessible walking path that follows the old railway line, perfect for leisurely strolls and enjoying the countryside. | Historical railway remnants, Countryside views, Access to local farms, Wildflower spotting |
Understanding Airbnb License Requirements & STR Laws in Talgarth (2025)
While Talgarth, Wales, United Kingdom currently shows low STR regulations, specific Airbnb license requirements might still exist or change. Always verify the latest short term rental regulations and Airbnb license requirements directly with local government authorities for Talgarth to ensure full compliance before hosting.
(Source: AirROI data, 2025, finding no licensed listings among those analyzed)
Top Performing Airbnb Properties in Talgarth (2025)
Benchmark your potential! Explore examples of top-performing Airbnb properties in Talgarthbased on Trailing Twelve Month (TTM) revenue. Analyze their characteristics, revenue, occupancy rate, and ADR to understand what drives success in this market.
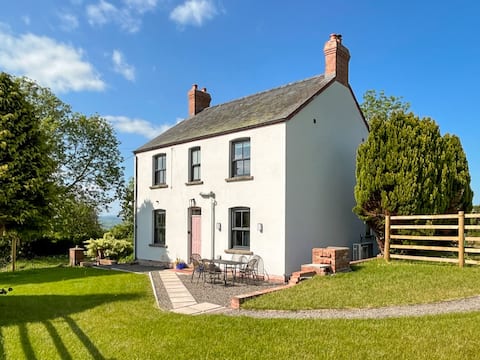
Gwrlodde
Entire Place • 4 bedrooms

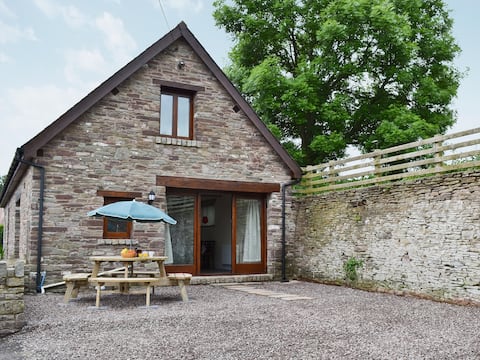
4 bedroom farmhouse Brecon Beacons
Entire Place • 1 bedroom
Llaethdy-Milkhouse
Entire Place • 4 bedrooms

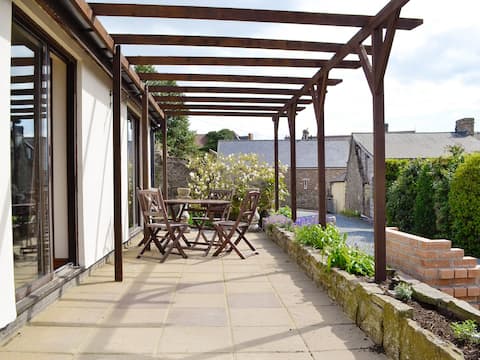
The Cottage at Sychnant Farm
Entire Place • 1 bedroom
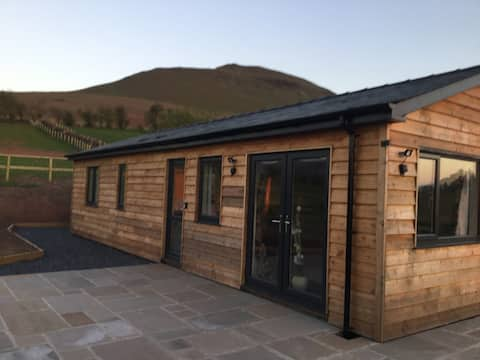
The Lodge - Stunning views and tranquil setting
Entire Place • 2 bedrooms
Three Views Bungalow
Entire Place • 4 bedrooms
Note: Performance varies based on location, size, amenities, seasonality, and management quality. Data reflects the past 12 months.
Top Performing Airbnb Hosts in Talgarth (2025)
Learn from the best! This table showcases top-performing Airbnb hosts in Talgarth based on the number of properties managed and estimated total revenue over the past year. Analyze their scale and performance metrics.
| Host Name | Properties | Grossing Revenue | Stay Reviews | Avg Rating |
|---|---|---|---|---|
| Cottages | 4 | $263,099 | 74 | 4.96/5.0 |
| Phil | 1 | $73,831 | 36 | 5.00/5.0 |
| Faye | 1 | $43,079 | 38 | 5.00/5.0 |
| Eleanor | 1 | $43,041 | 232 | 4.95/5.0 |
| Pridie | 1 | $38,027 | 104 | 5.00/5.0 |
| Host #8026276 | 1 | $33,268 | 9 | 4.89/5.0 |
| Rosie | 1 | $31,650 | 115 | 4.97/5.0 |
| Samantha | 1 | $31,072 | 173 | 4.97/5.0 |
| Julie | 1 | $28,697 | 74 | 4.76/5.0 |
| Kate | 1 | $24,271 | 290 | 4.92/5.0 |
Analyzing the strategies of top hosts, such as their property selection, pricing, and guest communication, can offer valuable lessons for optimizing your own Airbnb operations in Talgarth.
Dive Deeper: Advanced Talgarth STR Market Data (2025)
Ready to unlock more insights? AirROI provides access to advanced metrics and comprehensive Airbnb data for Talgarth. Explore detailed analytics beyond this report to refine your investment strategy, optimize pricing, and maximize your vacation rental profits.
Explore Advanced MetricsTalgarth Short-Term Rental Market Composition (2025): Property & Room Types
Room Type Distribution
Property Type Distribution
Market Composition Insights for Talgarth
- The Talgarth Airbnb market composition is heavily skewed towards Entire Home/Apt listings, which make up 92.3% of the 26 active rentals. This indicates strong guest preference for privacy and space.
- Looking at the property type distribution in Talgarth, House properties are the most common (69.2%), reflecting the local real estate landscape.
- Houses represent a significant 69.2% portion, catering likely to families or larger groups.
- The presence of 7.7% Hotel/Boutique listings indicates integration with traditional hospitality.
- Smaller segments like apartment/condo (combined 3.8%) offer potential for unique stay experiences.
Talgarth Airbnb Room Capacity Analysis (2025): Bedroom Distribution
Distribution of Listings by Number of Bedrooms
Room Capacity Insights for Talgarth
- The dominant room capacity in Talgarth is 1 bedroom listings, making up 42.3% of the market. This suggests a strong demand for properties suitable for couples or solo travelers.
- Together, 1 bedroom and 2 bedrooms properties represent 69.2% of the active Airbnb listings in Talgarth, indicating a high concentration in these sizes.
- A significant 26.8% of listings offer 3+ bedrooms, catering to larger groups and families seeking more space in Talgarth.
Talgarth Vacation Rental Guest Capacity Trends (2025)
Distribution of Listings by Guest Capacity
Guest Capacity Insights for Talgarth
- The most common guest capacity trend in Talgarth vacation rentals is listings accommodating 4 guests (26.9%). This suggests the primary traveler segment is likely small families or groups.
- Properties designed for 4 guests and 2 guests dominate the Talgarth STR market, accounting for 53.8% of listings.
- 30.7% of properties accommodate 6+ guests, serving the market segment for larger families or group travel in Talgarth.
- On average, properties in Talgarth are equipped to host 4.3 guests.
Talgarth Airbnb Booking Patterns (2025): Available vs. Booked Days
Available Days Distribution
Booked Days Distribution
Booking Pattern Insights for Talgarth
- The most common availability pattern in Talgarth falls within the 91-180 days range, representing 38.5% of listings. This suggests many properties have significant open periods on their calendars.
- Approximately 53.9% of listings show high availability (181+ days open annually), indicating potential for increased bookings or specific owner usage patterns.
- For booked days, the 181-270 days range is most frequent in Talgarth (46.2%), reflecting common guest stay durations or potential owner blocking patterns.
- A notable 53.9% of properties secure long booking periods (181+ days booked per year), highlighting successful long-term rental strategies or significant owner usage.
Talgarth Airbnb Minimum Stay Requirements Analysis
Distribution of Listings by Minimum Night Requirement
1 Night
4 listings
17.4% of total
2 Nights
11 listings
47.8% of total
3 Nights
3 listings
13% of total
4-6 Nights
1 listings
4.3% of total
30+ Nights
4 listings
17.4% of total
Key Insights
- The most prevalent minimum stay requirement in Talgarth is 2 Nights, adopted by 47.8% of listings. This highlights the market's preference for shorter, flexible bookings.
- A strong majority (65.2%) of the Talgarth Airbnb data shows acceptance of very short stays (1-2 nights), indicating a dynamic, high-turnover market.
- A significant segment (17.4%) caters to monthly stays (30+ nights) in Talgarth, pointing to opportunities in the extended-stay market.
Recommendations
- Align with the market by considering a 2 Nights minimum stay, as 47.8% of Talgarth hosts use this setting.
- If feasible, allowing 1-night stays, especially midweek or during low season, could capture last-minute bookings, as only 17.4% currently do.
- A 2-night minimum appears standard (47.8%). Consider this for weekends or peak periods.
- Explore offering discounts for stays of 30+ nights to attract the 17.4% of the market seeking extended stays.
- Adjust minimum nights based on seasonality – potentially shorter during low season and longer during peak demand periods in Talgarth.
Talgarth Airbnb Cancellation Policy Trends Analysis (2025)
Super Strict 60 Days
4 listings
16% of total
Flexible
7 listings
28% of total
Moderate
6 listings
24% of total
Firm
3 listings
12% of total
Strict
5 listings
20% of total
Cancellation Policy Insights for Talgarth
- The prevailing Airbnb cancellation policy trend in Talgarth is Flexible, used by 28% of listings.
- There's a relatively balanced mix between guest-friendly (52.0%) and stricter (32.0%) policies, offering choices for different guest needs.
Recommendations for Hosts
- Consider adopting a Flexible policy to align with the 28% market standard in Talgarth.
- Regularly review your cancellation policy against competitors and market demand shifts in Talgarth.
Talgarth STR Booking Lead Time Analysis (2025)
Average Booking Lead Time by Month
Booking Lead Time Insights for Talgarth
- The overall average booking lead time for vacation rentals in Talgarth is 56 days.
- Guests book furthest in advance for stays during May (average 122 days), likely coinciding with peak travel demand or local events.
- The shortest booking windows occur for stays in February (average 32 days), indicating more last-minute travel plans during this time.
- Seasonally, Summer (75 days avg.) sees the longest lead times, while Winter (42 days avg.) has the shortest, reflecting typical travel planning cycles.
Recommendations for Hosts
- Use the overall average lead time (56 days) as a baseline for your pricing and availability strategy in Talgarth.
- For May stays, consider implementing length-of-stay discounts or slightly higher rates for bookings made less than 122 days out to capitalize on advance planning.
- Target marketing efforts for the Summer season well in advance (at least 75 days) to capture early planners.
- Monitor your own booking lead times against these Talgarth averages to identify opportunities for dynamic pricing adjustments.
Popular & Essential Airbnb Amenities in Talgarth (2025)
Amenity Prevalence
Amenity Insights for Talgarth
- Essential amenities in Talgarth that guests expect include: TV, Smoke alarm, Wifi, Heating. Lacking these (any) could significantly impact bookings.
- Popular amenities like Hangers, Private entrance, Kitchen are common but not universal. Offering these can provide a competitive edge.
Recommendations for Hosts
- Ensure your listing includes all essential amenities for Talgarth: TV, Smoke alarm, Wifi, Heating.
- Prioritize adding missing essentials: Smoke alarm, Wifi, Heating.
- Consider adding popular differentiators like Hangers or Private entrance to increase appeal.
- Highlight unique or less common amenities you offer (e.g., hot tub, dedicated workspace, EV charger) in your listing description and photos.
- Regularly check competitor amenities in Talgarth to stay competitive.
Talgarth Airbnb Guest Demographics & Profile Analysis (2025)
Guest Profile Summary for Talgarth
- The typical guest profile for Airbnb in Talgarth consists of primarily domestic travelers (89%), often arriving from nearby England, typically belonging to the Post-2000s (Gen Z/Alpha) group (50%), primarily speaking English or French.
- Domestic travelers account for 89.2% of guests.
- Key international markets include United Kingdom (89.2%) and United States (2.4%).
- Top languages spoken are English (70.7%) followed by French (9.8%).
- A significant demographic segment is the Post-2000s (Gen Z/Alpha) group, representing 50% of guests.
Recommendations for Hosts
- Target domestic marketing efforts towards travelers from England and London.
- Tailor amenities and listing descriptions to appeal to the dominant Post-2000s (Gen Z/Alpha) demographic (e.g., highlight fast WiFi, smart home features, local guides).
- Highlight unique local experiences or amenities relevant to the primary guest profile.
- Consider seasonal promotions aligned with peak travel times for key origin markets.
Nearby Short-Term Rental Market Comparison
How does the Talgarth Airbnb market stack up against its neighbors? Compare key performance metrics like average monthly revenue, ADR, and occupancy rates in surrounding areas to understand the broader regional STR landscape.
| Market | Active Properties | Monthly Revenue | Daily Rate | Avg. Occupancy |
|---|---|---|---|---|
| Englishcombe | 13 | $8,558 | $573.69 | 49% |
| Chew Magna | 14 | $6,649 | $399.59 | 46% |
| Long Sutton | 17 | $5,726 | $383.88 | 46% |
| Stoke St. Michael | 10 | $5,277 | $424.04 | 42% |
| Winsham | 10 | $5,154 | $484.22 | 52% |
| Oldland Common | 13 | $5,093 | $355.47 | 43% |
| Llanrhidian | 15 | $4,842 | $386.18 | 53% |
| Crai | 20 | $4,799 | $371.85 | 46% |
| Limpley Stoke | 10 | $4,598 | $523.47 | 52% |
| Abbeycwmhir | 10 | $4,502 | $259.18 | 49% |