St Harmon Airbnb Market Analysis 2025: Short Term Rental Data & Vacation Rental Statistics in Wales, United Kingdom
Is Airbnb profitable in St Harmon in 2025? Explore comprehensive Airbnb analytics for St Harmon, Wales, United Kingdom to uncover income potential. This 2025 STR market report for St Harmon, based on AirROI data from April 2024 to March 2025, reveals key trends in the niche market of 36 active listings.
Whether you're considering an Airbnb investment in St Harmon, optimizing your existing vacation rental, or exploring rental arbitrage opportunities, understanding the St Harmon Airbnb data is crucial. Leveraging the low regulation environment is key to maximizing your short term rental income potential. Let's dive into the specifics.
Key St Harmon Airbnb Performance Metrics Overview
Monthly Airbnb Revenue Variations & Income Potential in St Harmon (2025)
Understanding the monthly revenue variations for Airbnb listings in St Harmon is key to maximizing your short term rental income potential. Seasonality significantly impacts earnings. Our analysis, based on data from the past 12 months, shows that the peak revenue month for STRs in St Harmon is typically August, while January often presents the lowest earnings, highlighting opportunities for strategic pricing adjustments during shoulder and low seasons. Explore the typical Airbnb income in St Harmon across different performance tiers:
- Best-in-class properties (Top 10%) achieve $4,778+ monthly, often utilizing dynamic pricing and superior guest experiences.
- Strong performing properties (Top 25%) earn $3,507 or more, indicating effective management and desirable locations/amenities.
- Typical properties (Median) generate around $2,191 per month, representing the average market performance.
- Entry-level properties (Bottom 25%) see earnings around $1,157, often with potential for optimization.
Average Monthly Airbnb Earnings Trend in St Harmon
St Harmon Airbnb Occupancy Rate Trends (2025)
Maximize your bookings by understanding the St Harmon STR occupancy trends. Seasonal demand shifts significantly influence how often properties are booked. Typically, Augustsees the highest demand (peak season occupancy), while January experiences the lowest (low season). Effective strategies, like adjusting minimum stays or offering promotions, can boost occupancy during slower periods. Here's how different property tiers perform in St Harmon:
- Best-in-class properties (Top 10%) achieve 72%+ occupancy, indicating high desirability and potentially optimized availability.
- Strong performing properties (Top 25%) maintain 60% or higher occupancy, suggesting good market fit and guest satisfaction.
- Typical properties (Median) have an occupancy rate around 42%.
- Entry-level properties (Bottom 25%) average 22% occupancy, potentially facing higher vacancy.
Average Monthly Occupancy Rate Trend in St Harmon
Average Daily Rate (ADR) Airbnb Trends in St Harmon (2025)
Effective short term rental pricing strategy in St Harmon involves understanding monthly ADR fluctuations. The Average Daily Rate (ADR) for Airbnb in St Harmon typically peaks in August and dips lowest during November. Leveraging Airbnb dynamic pricing tools or strategies based on this seasonality can significantly boost revenue. Here's a look at the typical nightly rates achieved:
- Best-in-class properties (Top 10%) command rates of $337+ per night, often due to premium features or locations.
- Strong performing properties (Top 25%) achieve nightly rates of $235 or more.
- Typical properties (Median) charge around $168 per night.
- Entry-level properties (Bottom 25%) earn around $137 per night.
Average Daily Rate (ADR) Trend by Month in St Harmon
Get Live St Harmon Market Intelligence 👇

Explore Real-time Analytics
Airbnb Seasonality Analysis & Trends in St Harmon (2025)
Peak Season (August, May, July)
- Revenue averages $3,952 per month
- Occupancy rates average 59.8%
- Daily rates average $232
Shoulder Season
- Revenue averages $2,442 per month
- Occupancy maintains around 40.4%
- Daily rates hold near $213
Low Season (January, February, March)
- Revenue drops to average $1,354 per month
- Occupancy decreases to average 25.0%
- Daily rates adjust to average $204
Seasonality Insights for St Harmon
- The Airbnb seasonality in St Harmon shows highly seasonal trends requiring careful strategy. While the sections above show seasonal averages, it's also insightful to look at the extremes:
- During the high season, the absolute peak month showcases St Harmon's highest earning potential, with monthly revenues capable of climbing to $4,846, occupancy reaching a high of 71.5%, and ADRs peaking at $242.
- Conversely, the slowest single month of the year, typically falling within the low season, marks the market's lowest point. In this month, revenue might dip to $1,258, occupancy could drop to 23.1%, and ADRs may adjust down to $183.
- Understanding both the seasonal averages and these monthly peaks and troughs in revenue, occupancy, and ADR is crucial for maximizing your Airbnb profit potential in St Harmon.
Seasonal Strategies for Maximizing Profit
- Peak Season: Maximize revenue through premium pricing and potentially longer minimum stays. Ensure high availability.
- Low Season: Offer competitive pricing, special promotions (e.g., extended stay discounts), and flexible cancellation policies. Target off-season travelers like remote workers or budget-conscious guests.
- Shoulder Seasons: Implement dynamic pricing that balances peak and low rates. Target weekend travelers or specific events. Offer slightly more flexible terms than peak season.
- Regularly analyze your own performance against these St Harmon seasonality benchmarks and adjust your pricing and availability strategy accordingly.
Best Areas for Airbnb Investment in St Harmon (2025)
Exploring the top neighborhoods for short-term rentals in St Harmon? This section highlights key areas, outlining why they are attractive for hosts and guests, along with notable local attractions. Consider these locations based on your target guest profile and investment strategy.
| Neighborhood / Area | Why Host Here? (Target Guests & Appeal) | Key Attractions & Landmarks |
|---|---|---|
| St Harmon Center | Central location in St Harmon, providing easy access to local shops and amenities. Ideal for visitors looking for convenience and proximity to services. | Local cafes, Shops and market, Public transport links |
| Elan Valley | Renowned for stunning natural beauty and outdoor activities. Ideal for nature lovers and guests looking for serene landscapes and hiking opportunities. | Elan Valley Reservoirs, Walking trails, Dams and visitor center, Wildlife spotting |
| Llandovery | Charming historical market town just a short drive from St Harmon. Popular with tourists exploring the Brecon Beacons and local history. | Llandovery Castle, Market square, Local shops and eateries |
| Builth Wells | Popular town for events and shows, particularly the Royal Welsh Show. Good for short-term rentals for event-goers. | The Royal Welsh Showground, Wells Cathedral, River Wye activities |
| Radnor Forest | A beautiful area for outdoor enthusiasts. Great for hiking and exploring, perfect for guests wanting rugged nature experiences. | Hiking trails, Scenic vistas, Wildlife areas |
| Cambrian Mountains | Famous for its rugged landscapes and tranquility, appealing to those seeking a getaway steeped in nature and adventure. | Mountain walking, Nature reserves, Stargazing opportunities |
| Brecon Beacons National Park | A major attraction known for breathtaking landscapes and outdoor activities, fetching nature-loving tourists. | Pen y Fan, Hiking trails, Waterfalls, Visitor centers |
| Cardigan Bay Coast | Seaside location known for its sandy beaches and marine wildlife. Suitable for families and beachgoers seeking a relaxing holiday. | Beaches, Dolphin watching, Coastal walks, Water sports |
Understanding Airbnb License Requirements & STR Laws in St Harmon (2025)
While St Harmon, Wales, United Kingdom currently shows low STR regulations, specific Airbnb license requirements might still exist or change. Always verify the latest short term rental regulations and Airbnb license requirements directly with local government authorities for St Harmon to ensure full compliance before hosting.
(Source: AirROI data, 2025, finding no licensed listings among those analyzed)
Top Performing Airbnb Properties in St Harmon (2025)
Benchmark your potential! Explore examples of top-performing Airbnb properties in St Harmonbased on Trailing Twelve Month (TTM) revenue. Analyze their characteristics, revenue, occupancy rate, and ADR to understand what drives success in this market.
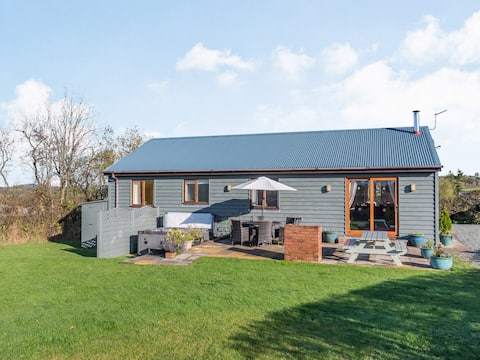
Cuckoo Hill Lodge
Entire Place • 3 bedrooms
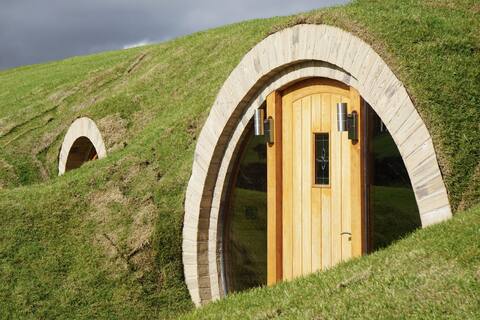
Hares View, Underground House
Entire Place • 3 bedrooms
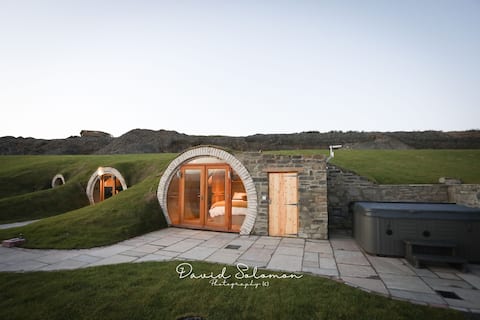
Badgers View
Entire Place • 2 bedrooms
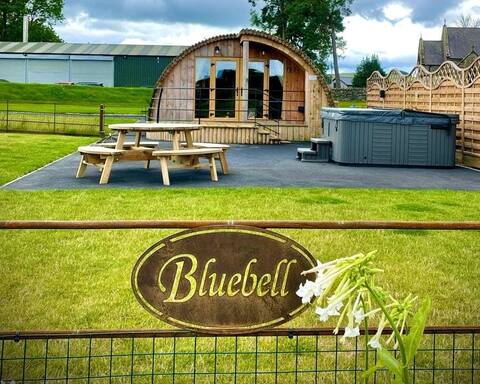
Bluebell 2 bedroom glamping pod with hot tub
Entire Place • 2 bedrooms
Mayflower 1 bedroom shepherds' hut with hot tub.
Entire Place • 1 bedroom

Foxes View
Entire Place • 3 bedrooms
Note: Performance varies based on location, size, amenities, seasonality, and management quality. Data reflects the past 12 months.
Top Performing Airbnb Hosts in St Harmon (2025)
Learn from the best! This table showcases top-performing Airbnb hosts in St Harmon based on the number of properties managed and estimated total revenue over the past year. Analyze their scale and performance metrics.
| Host Name | Properties | Grossing Revenue | Stay Reviews | Avg Rating |
|---|---|---|---|---|
| Becky | 12 | $323,200 | 293 | 4.95/5.0 |
| Gemma | 10 | $283,312 | 274 | 4.83/5.0 |
| HolidaysWales | 13 | $77,432 | 150 | 4.86/5.0 |
| Cottages | 1 | $60,910 | 16 | 5.00/5.0 |
Analyzing the strategies of top hosts, such as their property selection, pricing, and guest communication, can offer valuable lessons for optimizing your own Airbnb operations in St Harmon.
Dive Deeper: Advanced St Harmon STR Market Data (2025)
Ready to unlock more insights? AirROI provides access to advanced metrics and comprehensive Airbnb data for St Harmon. Explore detailed analytics beyond this report to refine your investment strategy, optimize pricing, and maximize your vacation rental profits.
Explore Advanced MetricsSt Harmon Short-Term Rental Market Composition (2025): Property & Room Types
Room Type Distribution
Property Type Distribution
Market Composition Insights for St Harmon
- The St Harmon Airbnb market composition is heavily skewed towards Entire Home/Apt listings, which make up 100% of the 36 active rentals. This indicates strong guest preference for privacy and space.
- Looking at the property type distribution in St Harmon, House properties are the most common (38.9%), reflecting the local real estate landscape.
- Houses represent a significant 38.9% portion, catering likely to families or larger groups.
St Harmon Airbnb Room Capacity Analysis (2025): Bedroom Distribution
Distribution of Listings by Number of Bedrooms
Room Capacity Insights for St Harmon
- The dominant room capacity in St Harmon is 1 bedroom listings, making up 44.4% of the market. This suggests a strong demand for properties suitable for couples or solo travelers.
- Together, 1 bedroom and 3 bedrooms properties represent 63.8% of the active Airbnb listings in St Harmon, indicating a high concentration in these sizes.
St Harmon Vacation Rental Guest Capacity Trends (2025)
Distribution of Listings by Guest Capacity
Guest Capacity Insights for St Harmon
- The most common guest capacity trend in St Harmon vacation rentals is listings accommodating 2 guests (52.8%). This suggests the primary traveler segment is likely couples or solo travelers.
- Properties designed for 2 guests and 4 guests dominate the St Harmon STR market, accounting for 72.2% of listings.
- A significant 52.8% of listings cater specifically to 1-2 guests, highlighting strong demand from couples and solo travelers in St Harmon.
- 16.7% of properties accommodate 6+ guests, serving the market segment for larger families or group travel in St Harmon.
- On average, properties in St Harmon are equipped to host 3.3 guests.
St Harmon Airbnb Booking Patterns (2025): Available vs. Booked Days
Available Days Distribution
Booked Days Distribution
Booking Pattern Insights for St Harmon
- The most common availability pattern in St Harmon falls within the 271-366 days range, representing 47.2% of listings. This suggests many properties have significant open periods on their calendars.
- Approximately 83.3% of listings show high availability (181+ days open annually), indicating potential for increased bookings or specific owner usage patterns.
- For booked days, the 91-180 days range is most frequent in St Harmon (27.8%), reflecting common guest stay durations or potential owner blocking patterns.
- A notable 25.0% of properties secure long booking periods (181+ days booked per year), highlighting successful long-term rental strategies or significant owner usage.
St Harmon Airbnb Minimum Stay Requirements Analysis
Distribution of Listings by Minimum Night Requirement
1 Night
9 listings
25% of total
2 Nights
27 listings
75% of total
Key Insights
- The most prevalent minimum stay requirement in St Harmon is 2 Nights, adopted by 75% of listings. This highlights the market's preference for shorter, flexible bookings.
- A strong majority (100.0%) of the St Harmon Airbnb data shows acceptance of very short stays (1-2 nights), indicating a dynamic, high-turnover market.
Recommendations
- Align with the market by considering a 2 Nights minimum stay, as 75% of St Harmon hosts use this setting.
- If feasible, allowing 1-night stays, especially midweek or during low season, could capture last-minute bookings, as only 25% currently do.
- Adjust minimum nights based on seasonality – potentially shorter during low season and longer during peak demand periods in St Harmon.
St Harmon Airbnb Cancellation Policy Trends Analysis (2025)
Super Strict 30 Days
13 listings
36.1% of total
Super Strict 60 Days
1 listings
2.8% of total
Flexible
9 listings
25% of total
Moderate
1 listings
2.8% of total
Strict
12 listings
33.3% of total
Cancellation Policy Insights for St Harmon
- The prevailing Airbnb cancellation policy trend in St Harmon is Super Strict 30 Days, used by 36.1% of listings.
- There's a relatively balanced mix between guest-friendly (27.8%) and stricter (33.3%) policies, offering choices for different guest needs.
Recommendations for Hosts
- Consider adopting a Super Strict 30 Days policy to align with the 36.1% market standard in St Harmon.
- With 33.3% using Strict terms, this is a viable option in St Harmon, particularly for high-value properties or during peak demand periods.
- Regularly review your cancellation policy against competitors and market demand shifts in St Harmon.
St Harmon STR Booking Lead Time Analysis (2025)
Average Booking Lead Time by Month
Booking Lead Time Insights for St Harmon
- The overall average booking lead time for vacation rentals in St Harmon is 43 days.
- Guests book furthest in advance for stays during December (average 65 days), likely coinciding with peak travel demand or local events.
- The shortest booking windows occur for stays in April (average 34 days), indicating more last-minute travel plans during this time.
- Seasonally, Summer (54 days avg.) sees the longest lead times, while Spring (42 days avg.) has the shortest, reflecting typical travel planning cycles.
Recommendations for Hosts
- Use the overall average lead time (43 days) as a baseline for your pricing and availability strategy in St Harmon.
- For December stays, consider implementing length-of-stay discounts or slightly higher rates for bookings made less than 65 days out to capitalize on advance planning.
- Target marketing efforts for the Summer season well in advance (at least 54 days) to capture early planners.
- Monitor your own booking lead times against these St Harmon averages to identify opportunities for dynamic pricing adjustments.
Popular & Essential Airbnb Amenities in St Harmon (2025)
Amenity Prevalence
Amenity Insights for St Harmon
- Essential amenities in St Harmon that guests expect include: Kitchen, Hot tub, Wifi, Free parking on premises, TV. Lacking these (any) could significantly impact bookings.
- Popular amenities like Heating, Smoke alarm, Hot water are common but not universal. Offering these can provide a competitive edge.
Recommendations for Hosts
- Ensure your listing includes all essential amenities for St Harmon: Kitchen, Hot tub, Wifi, Free parking on premises, TV.
- Consider adding popular differentiators like Heating or Smoke alarm to increase appeal.
- Highlight unique or less common amenities you offer (e.g., hot tub, dedicated workspace, EV charger) in your listing description and photos.
- Regularly check competitor amenities in St Harmon to stay competitive.
St Harmon Airbnb Guest Demographics & Profile Analysis (2025)
Guest Profile Summary for St Harmon
- The typical guest profile for Airbnb in St Harmon consists of primarily domestic travelers (99%), often arriving from nearby England, typically belonging to the Post-2000s (Gen Z/Alpha) group (50%), primarily speaking English or French.
- Domestic travelers account for 98.6% of guests.
- Key international markets include United Kingdom (98.6%) and Netherlands (0.7%).
- Top languages spoken are English (87.1%) followed by French (4.3%).
- A significant demographic segment is the Post-2000s (Gen Z/Alpha) group, representing 50% of guests.
Recommendations for Hosts
- Target domestic marketing efforts towards travelers from England and Birmingham.
- Tailor amenities and listing descriptions to appeal to the dominant Post-2000s (Gen Z/Alpha) demographic (e.g., highlight fast WiFi, smart home features, local guides).
- Highlight unique local experiences or amenities relevant to the primary guest profile.
- Consider seasonal promotions aligned with peak travel times for key origin markets.
Nearby Short-Term Rental Market Comparison
How does the St Harmon Airbnb market stack up against its neighbors? Compare key performance metrics like average monthly revenue, ADR, and occupancy rates in surrounding areas to understand the broader regional STR landscape.
| Market | Active Properties | Monthly Revenue | Daily Rate | Avg. Occupancy |
|---|---|---|---|---|
| Englishcombe | 13 | $8,558 | $573.69 | 49% |
| Chew Magna | 14 | $6,649 | $399.59 | 46% |
| Long Sutton | 17 | $5,726 | $383.88 | 46% |
| Stoke St. Michael | 10 | $5,277 | $424.04 | 42% |
| Oldland Common | 13 | $5,093 | $355.47 | 43% |
| Llanrhidian | 15 | $4,842 | $386.18 | 53% |
| Crai | 20 | $4,799 | $371.85 | 46% |
| Limpley Stoke | 10 | $4,598 | $523.47 | 52% |
| Abbeycwmhir | 10 | $4,502 | $259.18 | 49% |
| Ashley | 16 | $4,496 | $321.11 | 52% |