St Asaph Airbnb Market Analysis 2025: Short Term Rental Data & Vacation Rental Statistics in Wales, United Kingdom
Is Airbnb profitable in St Asaph in 2025? Explore comprehensive Airbnb analytics for St Asaph, Wales, United Kingdom to uncover income potential. This 2025 STR market report for St Asaph, based on AirROI data from April 2024 to March 2025, reveals key trends in the niche market of 38 active listings.
Whether you're considering an Airbnb investment in St Asaph, optimizing your existing vacation rental, or exploring rental arbitrage opportunities, understanding the St Asaph Airbnb data is crucial. Leveraging the low regulation environment is key to maximizing your short term rental income potential. Let's dive into the specifics.
Key St Asaph Airbnb Performance Metrics Overview
Monthly Airbnb Revenue Variations & Income Potential in St Asaph (2025)
Understanding the monthly revenue variations for Airbnb listings in St Asaph is key to maximizing your short term rental income potential. Seasonality significantly impacts earnings. Our analysis, based on data from the past 12 months, shows that the peak revenue month for STRs in St Asaph is typically August, while November often presents the lowest earnings, highlighting opportunities for strategic pricing adjustments during shoulder and low seasons. Explore the typical Airbnb income in St Asaph across different performance tiers:
- Best-in-class properties (Top 10%) achieve $5,220+ monthly, often utilizing dynamic pricing and superior guest experiences.
- Strong performing properties (Top 25%) earn $3,846 or more, indicating effective management and desirable locations/amenities.
- Typical properties (Median) generate around $2,615 per month, representing the average market performance.
- Entry-level properties (Bottom 25%) see earnings around $1,523, often with potential for optimization.
Average Monthly Airbnb Earnings Trend in St Asaph
St Asaph Airbnb Occupancy Rate Trends (2025)
Maximize your bookings by understanding the St Asaph STR occupancy trends. Seasonal demand shifts significantly influence how often properties are booked. Typically, Augustsees the highest demand (peak season occupancy), while April experiences the lowest (low season). Effective strategies, like adjusting minimum stays or offering promotions, can boost occupancy during slower periods. Here's how different property tiers perform in St Asaph:
- Best-in-class properties (Top 10%) achieve 82%+ occupancy, indicating high desirability and potentially optimized availability.
- Strong performing properties (Top 25%) maintain 65% or higher occupancy, suggesting good market fit and guest satisfaction.
- Typical properties (Median) have an occupancy rate around 42%.
- Entry-level properties (Bottom 25%) average 26% occupancy, potentially facing higher vacancy.
Average Monthly Occupancy Rate Trend in St Asaph
Average Daily Rate (ADR) Airbnb Trends in St Asaph (2025)
Effective short term rental pricing strategy in St Asaph involves understanding monthly ADR fluctuations. The Average Daily Rate (ADR) for Airbnb in St Asaph typically peaks in August and dips lowest during January. Leveraging Airbnb dynamic pricing tools or strategies based on this seasonality can significantly boost revenue. Here's a look at the typical nightly rates achieved:
- Best-in-class properties (Top 10%) command rates of $401+ per night, often due to premium features or locations.
- Strong performing properties (Top 25%) achieve nightly rates of $277 or more.
- Typical properties (Median) charge around $174 per night.
- Entry-level properties (Bottom 25%) earn around $127 per night.
Average Daily Rate (ADR) Trend by Month in St Asaph
Get Live St Asaph Market Intelligence 👇

Explore Real-time Analytics
Airbnb Seasonality Analysis & Trends in St Asaph (2025)
Peak Season (August, July, June)
- Revenue averages $4,554 per month
- Occupancy rates average 54.8%
- Daily rates average $226
Shoulder Season
- Revenue averages $2,861 per month
- Occupancy maintains around 42.5%
- Daily rates hold near $216
Low Season (February, March, November)
- Revenue drops to average $2,347 per month
- Occupancy decreases to average 43.5%
- Daily rates adjust to average $213
Seasonality Insights for St Asaph
- The Airbnb seasonality in St Asaph shows highly seasonal trends requiring careful strategy. While the sections above show seasonal averages, it's also insightful to look at the extremes:
- During the high season, the absolute peak month showcases St Asaph's highest earning potential, with monthly revenues capable of climbing to $5,348, occupancy reaching a high of 63.7%, and ADRs peaking at $230.
- Conversely, the slowest single month of the year, typically falling within the low season, marks the market's lowest point. In this month, revenue might dip to $2,257, occupancy could drop to 39.6%, and ADRs may adjust down to $210.
- Understanding both the seasonal averages and these monthly peaks and troughs in revenue, occupancy, and ADR is crucial for maximizing your Airbnb profit potential in St Asaph.
Seasonal Strategies for Maximizing Profit
- Peak Season: Maximize revenue through premium pricing and potentially longer minimum stays. Ensure high availability.
- Low Season: Offer competitive pricing, special promotions (e.g., extended stay discounts), and flexible cancellation policies. Target off-season travelers like remote workers or budget-conscious guests.
- Shoulder Seasons: Implement dynamic pricing that balances peak and low rates. Target weekend travelers or specific events. Offer slightly more flexible terms than peak season.
- Regularly analyze your own performance against these St Asaph seasonality benchmarks and adjust your pricing and availability strategy accordingly.
Best Areas for Airbnb Investment in St Asaph (2025)
Exploring the top neighborhoods for short-term rentals in St Asaph? This section highlights key areas, outlining why they are attractive for hosts and guests, along with notable local attractions. Consider these locations based on your target guest profile and investment strategy.
| Neighborhood / Area | Why Host Here? (Target Guests & Appeal) | Key Attractions & Landmarks |
|---|---|---|
| Historic St Asaph | St Asaph is known for its rich history and beautiful cathedral, making it appealing to tourists interested in culture and heritage. It offers a quaint and charming environment. | St Asaph Cathedral, The Old Bishop's Palace, St Asaph's Park, Historical walking tours, Local artisan shops |
| River Elwy Area | The picturesque River Elwy runs through St Asaph, offering natural beauty and opportunities for outdoor activities such as fishing or walking along the riverbanks. | River Elwy, Fishing spots, Walking trails, Nature photography opportunities, Scenic picnic areas |
| Denbighshire Countryside | The surrounding countryside offers stunning landscapes and outdoor opportunities, attracting tourists who want to explore rural Wales and its natural beauty. | Hiking trails, Biking routes, Scenic views, Wildlife watching, Nearby hills and valleys |
| North Wales Coast | Close to the beautiful North Wales coastline, St Asaph is a gateway for visitors wanting to explore the beaches and seaside attractions of the area. | Prestatyn Beach, Rhyl Sea Life Centre, Talacre Beach, Coastal walks, Water sports activities |
| Local Events | St Asaph hosts various local events and festivals throughout the year, drawing visitors and providing unique experiences, which can be capitalized on for short-term rentals. | St Asaph Food Festival, Art and Craft Fairs, Music Festivals, Christmas Markets, Local theatre productions |
| Community Amenities | With various local shops, restaurants, and amenities, St Asaph appeals to visitors looking for convenience in their stay, making it an attractive location for Airbnb hosts. | Local cafes and pubs, Independent shops, Farmers markets, Grocery stores, Community centre |
| Proximity to Snowdonia National Park | Being a short drive from Snowdonia makes St Asaph an ideal base for visitors seeking to explore the national park's mountains and natural attractions. | Snowdon Mountain, Lake Padarn, Hiking routes, Adventure sports, Stunning landscapes |
| Cultural Heritage | The area has historical significance with various ancient ruins and heritage sites, attracting visitors interested in Wales’ rich past. | Gwydir Castle, Denbigh Castle, Historical landmarks, Local history museums, Cultural tours |
Understanding Airbnb License Requirements & STR Laws in St Asaph (2025)
While St Asaph, Wales, United Kingdom currently shows low STR regulations, specific Airbnb license requirements might still exist or change. Always verify the latest short term rental regulations and Airbnb license requirements directly with local government authorities for St Asaph to ensure full compliance before hosting.
(Source: AirROI data, 2025, finding no licensed listings among those analyzed)
Top Performing Airbnb Properties in St Asaph (2025)
Benchmark your potential! Explore examples of top-performing Airbnb properties in St Asaphbased on Trailing Twelve Month (TTM) revenue. Analyze their characteristics, revenue, occupancy rate, and ADR to understand what drives success in this market.

14 Berth Country House, Private Heated Indoor Pool
Entire Place • 6 bedrooms
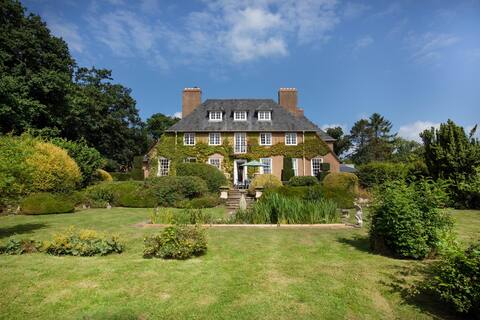
Superb 5 Bed Arts & Craft Country House with Views
Entire Place • 5 bedrooms
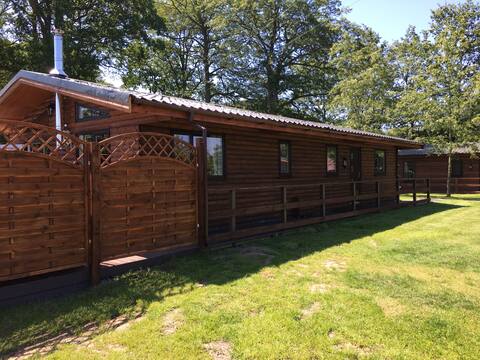
The Buck 5 Berth Log Cabin With Hot Tub
Entire Place • 3 bedrooms

Cosy mountain hideaway in AONB with stunning views
Entire Place • 1 bedroom

Beachcomber Multiple Pet Friendly Seafront Cottage
Entire Place • 2 bedrooms

Mountain, Sea & Sunset Views - Barn Conversion
Entire Place • 2 bedrooms
Note: Performance varies based on location, size, amenities, seasonality, and management quality. Data reflects the past 12 months.
Top Performing Airbnb Hosts in St Asaph (2025)
Learn from the best! This table showcases top-performing Airbnb hosts in St Asaph based on the number of properties managed and estimated total revenue over the past year. Analyze their scale and performance metrics.
| Host Name | Properties | Grossing Revenue | Stay Reviews | Avg Rating |
|---|---|---|---|---|
| Richard | 4 | $285,659 | 53 | 4.74/5.0 |
| Gavin | 5 | $137,407 | 588 | 4.92/5.0 |
| Cottages | 3 | $87,471 | 22 | 3.22/5.0 |
| Tamar | 1 | $73,760 | 3 | 5.00/5.0 |
| Eleanor | 2 | $70,039 | 167 | 5.00/5.0 |
| Richard | 1 | $49,257 | 31 | 5.00/5.0 |
| Kirsty | 1 | $47,293 | 121 | 4.87/5.0 |
| Amy | 1 | $46,054 | 146 | 4.93/5.0 |
| Dan | 1 | $44,530 | 34 | 4.35/5.0 |
| Amy | 1 | $42,454 | 47 | 4.79/5.0 |
Analyzing the strategies of top hosts, such as their property selection, pricing, and guest communication, can offer valuable lessons for optimizing your own Airbnb operations in St Asaph.
Dive Deeper: Advanced St Asaph STR Market Data (2025)
Ready to unlock more insights? AirROI provides access to advanced metrics and comprehensive Airbnb data for St Asaph. Explore detailed analytics beyond this report to refine your investment strategy, optimize pricing, and maximize your vacation rental profits.
Explore Advanced MetricsSt Asaph Short-Term Rental Market Composition (2025): Property & Room Types
Room Type Distribution
Property Type Distribution
Market Composition Insights for St Asaph
- The St Asaph Airbnb market composition is heavily skewed towards Entire Home/Apt listings, which make up 94.7% of the 38 active rentals. This indicates strong guest preference for privacy and space.
- Looking at the property type distribution in St Asaph, House properties are the most common (55.3%), reflecting the local real estate landscape.
- Houses represent a significant 55.3% portion, catering likely to families or larger groups.
- Smaller segments like hotel/boutique (combined 2.6%) offer potential for unique stay experiences.
St Asaph Airbnb Room Capacity Analysis (2025): Bedroom Distribution
Distribution of Listings by Number of Bedrooms
Room Capacity Insights for St Asaph
- The dominant room capacity in St Asaph is 2 bedrooms listings, making up 44.7% of the market. This suggests a strong demand for properties suitable for couples or solo travelers.
- Together, 2 bedrooms and 1 bedroom properties represent 68.4% of the active Airbnb listings in St Asaph, indicating a high concentration in these sizes.
- A significant 23.7% of listings offer 3+ bedrooms, catering to larger groups and families seeking more space in St Asaph.
St Asaph Vacation Rental Guest Capacity Trends (2025)
Distribution of Listings by Guest Capacity
Guest Capacity Insights for St Asaph
- The most common guest capacity trend in St Asaph vacation rentals is listings accommodating 4 guests (36.8%). This suggests the primary traveler segment is likely small families or groups.
- Properties designed for 4 guests and 6 guests dominate the St Asaph STR market, accounting for 57.9% of listings.
- 36.9% of properties accommodate 6+ guests, serving the market segment for larger families or group travel in St Asaph.
- On average, properties in St Asaph are equipped to host 4.6 guests.
St Asaph Airbnb Booking Patterns (2025): Available vs. Booked Days
Available Days Distribution
Booked Days Distribution
Booking Pattern Insights for St Asaph
- The most common availability pattern in St Asaph falls within the 181-270 days range, representing 34.2% of listings. This suggests many properties have significant open periods on their calendars.
- Approximately 63.1% of listings show high availability (181+ days open annually), indicating potential for increased bookings or specific owner usage patterns.
- For booked days, the 91-180 days range is most frequent in St Asaph (34.2%), reflecting common guest stay durations or potential owner blocking patterns.
- A notable 36.8% of properties secure long booking periods (181+ days booked per year), highlighting successful long-term rental strategies or significant owner usage.
St Asaph Airbnb Minimum Stay Requirements Analysis
Distribution of Listings by Minimum Night Requirement
1 Night
8 listings
23.5% of total
2 Nights
16 listings
47.1% of total
3 Nights
2 listings
5.9% of total
4-6 Nights
1 listings
2.9% of total
30+ Nights
7 listings
20.6% of total
Key Insights
- The most prevalent minimum stay requirement in St Asaph is 2 Nights, adopted by 47.1% of listings. This highlights the market's preference for shorter, flexible bookings.
- A strong majority (70.6%) of the St Asaph Airbnb data shows acceptance of very short stays (1-2 nights), indicating a dynamic, high-turnover market.
- A significant segment (20.6%) caters to monthly stays (30+ nights) in St Asaph, pointing to opportunities in the extended-stay market.
Recommendations
- Align with the market by considering a 2 Nights minimum stay, as 47.1% of St Asaph hosts use this setting.
- If feasible, allowing 1-night stays, especially midweek or during low season, could capture last-minute bookings, as only 23.5% currently do.
- Explore offering discounts for stays of 30+ nights to attract the 20.6% of the market seeking extended stays.
- Adjust minimum nights based on seasonality – potentially shorter during low season and longer during peak demand periods in St Asaph.
St Asaph Airbnb Cancellation Policy Trends Analysis (2025)
Non-refundable
1 listings
2.8% of total
Super Strict 60 Days
3 listings
8.3% of total
Refundable
2 listings
5.6% of total
Flexible
9 listings
25% of total
Moderate
4 listings
11.1% of total
Firm
8 listings
22.2% of total
Strict
9 listings
25% of total
Cancellation Policy Insights for St Asaph
- The prevailing Airbnb cancellation policy trend in St Asaph is Flexible, used by 25% of listings.
- There's a relatively balanced mix between guest-friendly (36.1%) and stricter (47.2%) policies, offering choices for different guest needs.
Recommendations for Hosts
- Consider adopting a Flexible policy to align with the 25% market standard in St Asaph.
- Regularly review your cancellation policy against competitors and market demand shifts in St Asaph.
St Asaph STR Booking Lead Time Analysis (2025)
Average Booking Lead Time by Month
Booking Lead Time Insights for St Asaph
- The overall average booking lead time for vacation rentals in St Asaph is 57 days.
- Guests book furthest in advance for stays during May (average 84 days), likely coinciding with peak travel demand or local events.
- The shortest booking windows occur for stays in November (average 38 days), indicating more last-minute travel plans during this time.
- Seasonally, Summer (68 days avg.) sees the longest lead times, while Fall (50 days avg.) has the shortest, reflecting typical travel planning cycles.
Recommendations for Hosts
- Use the overall average lead time (57 days) as a baseline for your pricing and availability strategy in St Asaph.
- For May stays, consider implementing length-of-stay discounts or slightly higher rates for bookings made less than 84 days out to capitalize on advance planning.
- Target marketing efforts for the Summer season well in advance (at least 68 days) to capture early planners.
- Monitor your own booking lead times against these St Asaph averages to identify opportunities for dynamic pricing adjustments.
Popular & Essential Airbnb Amenities in St Asaph (2025)
Amenity Prevalence
Amenity Insights for St Asaph
- Essential amenities in St Asaph that guests expect include: Heating, Smoke alarm, TV, Free parking on premises, Kitchen. Lacking these (any) could significantly impact bookings.
- Popular amenities like Wifi, Hangers, Fire extinguisher are common but not universal. Offering these can provide a competitive edge.
- Warning: Wifi is not universally provided but is considered essential globally. Ensure reliable Wifi is offered.
Recommendations for Hosts
- Ensure your listing includes all essential amenities for St Asaph: Heating, Smoke alarm, TV, Free parking on premises, Kitchen.
- Prioritize adding missing essentials: TV, Free parking on premises, Kitchen.
- Consider adding popular differentiators like Wifi or Hangers to increase appeal.
- Highlight unique or less common amenities you offer (e.g., hot tub, dedicated workspace, EV charger) in your listing description and photos.
- Regularly check competitor amenities in St Asaph to stay competitive.
St Asaph Airbnb Guest Demographics & Profile Analysis (2025)
Guest Profile Summary for St Asaph
- The typical guest profile for Airbnb in St Asaph consists of primarily domestic travelers (95%), often arriving from nearby England, typically belonging to the Post-2000s (Gen Z/Alpha) group (50%), primarily speaking English or Spanish.
- Domestic travelers account for 95.2% of guests.
- Key international markets include United Kingdom (95.2%) and United States (1.1%).
- Top languages spoken are English (83%) followed by Spanish (3.8%).
- A significant demographic segment is the Post-2000s (Gen Z/Alpha) group, representing 50% of guests.
Recommendations for Hosts
- Target domestic marketing efforts towards travelers from England and Manchester.
- Tailor amenities and listing descriptions to appeal to the dominant Post-2000s (Gen Z/Alpha) demographic (e.g., highlight fast WiFi, smart home features, local guides).
- Highlight unique local experiences or amenities relevant to the primary guest profile.
- Consider seasonal promotions aligned with peak travel times for key origin markets.
Nearby Short-Term Rental Market Comparison
How does the St Asaph Airbnb market stack up against its neighbors? Compare key performance metrics like average monthly revenue, ADR, and occupancy rates in surrounding areas to understand the broader regional STR landscape.
| Market | Active Properties | Monthly Revenue | Daily Rate | Avg. Occupancy |
|---|---|---|---|---|
| Cartmel Fell | 17 | $4,719 | $331.68 | 52% |
| Casterton | 11 | $4,578 | $300.82 | 51% |
| Cark | 11 | $4,540 | $885.21 | 31% |
| Abbeycwmhir | 10 | $4,502 | $259.18 | 49% |
| Craven Arms | 10 | $4,487 | $292.69 | 50% |
| Eglwys-bach | 16 | $4,413 | $315.23 | 52% |
| Waverton | 16 | $4,358 | $444.20 | 33% |
| Watermillock | 16 | $4,281 | $274.03 | 50% |
| Chirbury | 14 | $4,233 | $702.20 | 41% |
| Cradley | 14 | $4,192 | $443.36 | 42% |