Scurlage Airbnb Market Analysis 2025: Short Term Rental Data & Vacation Rental Statistics in Wales, United Kingdom
Is Airbnb profitable in Scurlage in 2025? Explore comprehensive Airbnb analytics for Scurlage, Wales, United Kingdom to uncover income potential. This 2025 STR market report for Scurlage, based on AirROI data from April 2024 to March 2025, reveals key trends in the niche market of 28 active listings.
Whether you're considering an Airbnb investment in Scurlage, optimizing your existing vacation rental, or exploring rental arbitrage opportunities, understanding the Scurlage Airbnb data is crucial. Leveraging the low regulation environment is key to maximizing your short term rental income potential. Let's dive into the specifics.
Key Scurlage Airbnb Performance Metrics Overview
Monthly Airbnb Revenue Variations & Income Potential in Scurlage (2025)
Understanding the monthly revenue variations for Airbnb listings in Scurlage is key to maximizing your short term rental income potential. Seasonality significantly impacts earnings. Our analysis, based on data from the past 12 months, shows that the peak revenue month for STRs in Scurlage is typically August, while March often presents the lowest earnings, highlighting opportunities for strategic pricing adjustments during shoulder and low seasons. Explore the typical Airbnb income in Scurlage across different performance tiers:
- Best-in-class properties (Top 10%) achieve $4,464+ monthly, often utilizing dynamic pricing and superior guest experiences.
- Strong performing properties (Top 25%) earn $3,240 or more, indicating effective management and desirable locations/amenities.
- Typical properties (Median) generate around $1,976 per month, representing the average market performance.
- Entry-level properties (Bottom 25%) see earnings around $1,291, often with potential for optimization.
Average Monthly Airbnb Earnings Trend in Scurlage
Scurlage Airbnb Occupancy Rate Trends (2025)
Maximize your bookings by understanding the Scurlage STR occupancy trends. Seasonal demand shifts significantly influence how often properties are booked. Typically, Augustsees the highest demand (peak season occupancy), while November experiences the lowest (low season). Effective strategies, like adjusting minimum stays or offering promotions, can boost occupancy during slower periods. Here's how different property tiers perform in Scurlage:
- Best-in-class properties (Top 10%) achieve 81%+ occupancy, indicating high desirability and potentially optimized availability.
- Strong performing properties (Top 25%) maintain 64% or higher occupancy, suggesting good market fit and guest satisfaction.
- Typical properties (Median) have an occupancy rate around 41%.
- Entry-level properties (Bottom 25%) average 25% occupancy, potentially facing higher vacancy.
Average Monthly Occupancy Rate Trend in Scurlage
Average Daily Rate (ADR) Airbnb Trends in Scurlage (2025)
Effective short term rental pricing strategy in Scurlage involves understanding monthly ADR fluctuations. The Average Daily Rate (ADR) for Airbnb in Scurlage typically peaks in August and dips lowest during March. Leveraging Airbnb dynamic pricing tools or strategies based on this seasonality can significantly boost revenue. Here's a look at the typical nightly rates achieved:
- Best-in-class properties (Top 10%) command rates of $311+ per night, often due to premium features or locations.
- Strong performing properties (Top 25%) achieve nightly rates of $197 or more.
- Typical properties (Median) charge around $139 per night.
- Entry-level properties (Bottom 25%) earn around $108 per night.
Average Daily Rate (ADR) Trend by Month in Scurlage
Get Live Scurlage Market Intelligence 👇

Explore Real-time Analytics
Airbnb Seasonality Analysis & Trends in Scurlage (2025)
Peak Season (August, July, June)
- Revenue averages $3,609 per month
- Occupancy rates average 62.8%
- Daily rates average $183
Shoulder Season
- Revenue averages $2,461 per month
- Occupancy maintains around 43.6%
- Daily rates hold near $174
Low Season (February, March, November)
- Revenue drops to average $1,113 per month
- Occupancy decreases to average 31.4%
- Daily rates adjust to average $162
Seasonality Insights for Scurlage
- The Airbnb seasonality in Scurlage shows highly seasonal trends requiring careful strategy. While the sections above show seasonal averages, it's also insightful to look at the extremes:
- During the high season, the absolute peak month showcases Scurlage's highest earning potential, with monthly revenues capable of climbing to $4,305, occupancy reaching a high of 77.6%, and ADRs peaking at $184.
- Conversely, the slowest single month of the year, typically falling within the low season, marks the market's lowest point. In this month, revenue might dip to $903, occupancy could drop to 24.1%, and ADRs may adjust down to $161.
- Understanding both the seasonal averages and these monthly peaks and troughs in revenue, occupancy, and ADR is crucial for maximizing your Airbnb profit potential in Scurlage.
Seasonal Strategies for Maximizing Profit
- Peak Season: Maximize revenue through premium pricing and potentially longer minimum stays. Ensure high availability.
- Low Season: Offer competitive pricing, special promotions (e.g., extended stay discounts), and flexible cancellation policies. Target off-season travelers like remote workers or budget-conscious guests.
- Shoulder Seasons: Implement dynamic pricing that balances peak and low rates. Target weekend travelers or specific events. Offer slightly more flexible terms than peak season.
- Regularly analyze your own performance against these Scurlage seasonality benchmarks and adjust your pricing and availability strategy accordingly.
Best Areas for Airbnb Investment in Scurlage (2025)
Exploring the top neighborhoods for short-term rentals in Scurlage? This section highlights key areas, outlining why they are attractive for hosts and guests, along with notable local attractions. Consider these locations based on your target guest profile and investment strategy.
| Neighborhood / Area | Why Host Here? (Target Guests & Appeal) | Key Attractions & Landmarks |
|---|---|---|
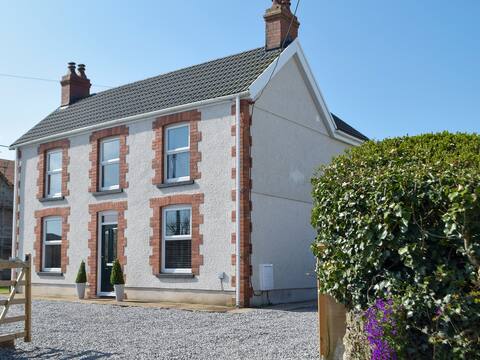
| Scurlage Beach | Scurlage Beach is a beautiful location known for its stunning coastline and tranquil atmosphere. It attracts beach lovers and families looking for a peaceful retreat close to nature. | Scurlage Beach, Rhossili Bay, Gower Peninsula, Worms Head, Local hiking trails, The Gower Heritage Centre |
| Rhossili | A picturesque village with some of the best views in the UK, Rhossili attracts tourists for its breathtaking landscapes and historic sites. It is ideal for nature lovers and hikers. | Rhossili Bay, Worms Head, Rhossili Downs, National Trust trails, The Old Rectory, Church of St. Mary |
| Port Eynon | A charming seaside village with sandy shores and a friendly community vibe. It is perfect for families and those seeking a beach holiday with various local amenities. | Port Eynon Beach, The Mumbles, Gower Coast Path, Local seafood restaurants, Swansea Bay, Water sports activities |
| Llangennith | Renowned for its surf beaches, Llangennith draws surfers and adventure enthusiasts. The area offers a vibrant community and ample outdoor activities. | Llangennith Beach, Surfing spots, Gower Peninsula walks, Local surf schools, The King's Head pub, Wildlife spotting |
| Knelston | A quiet village offering a rural retreat close to the coast, Knelston is favored by those seeking relaxation amid nature while remaining accessible to beach activities. | Local countryside, Gower AONB, Llanrhidian Hill, Nearby coastal paths, Bird watching, Cafés and local shops |
| Swansea | The nearest major city with a vibrant cultural scene, Swansea is popular among tourists for its attractions, nightlife, and shopping. It's a great base for exploring the Gower Peninsula. | Swansea Marina, The Waterfront Museum, Clyne Gardens, Liberty Stadium, Oystermouth Castle, Swansea Market |
| Mumbles | A charming seaside village just south of Swansea, Mumbles is famous for its ice cream and scenic views, attracting families and couples seeking a romantic getaway. | Mumbles Pier, Oystermouth Castle, Local beaches, Gastronomic restaurants, The Mumbles Hill, Tides |
| Nash Point | A striking coastal area known for its cliffs and lighthouse, Nash Point is a unique spot for nature lovers and photographers, with stunning views and walking trails. | Nash Point Lighthouse, Cliff walks, Bird watching, Nearby beaches, Nature reserves, Historical landmarks |
Understanding Airbnb License Requirements & STR Laws in Scurlage (2025)
While Scurlage, Wales, United Kingdom currently shows low STR regulations, specific Airbnb license requirements might still exist or change. Always verify the latest short term rental regulations and Airbnb license requirements directly with local government authorities for Scurlage to ensure full compliance before hosting.
(Source: AirROI data, 2025, finding no licensed listings among those analyzed)
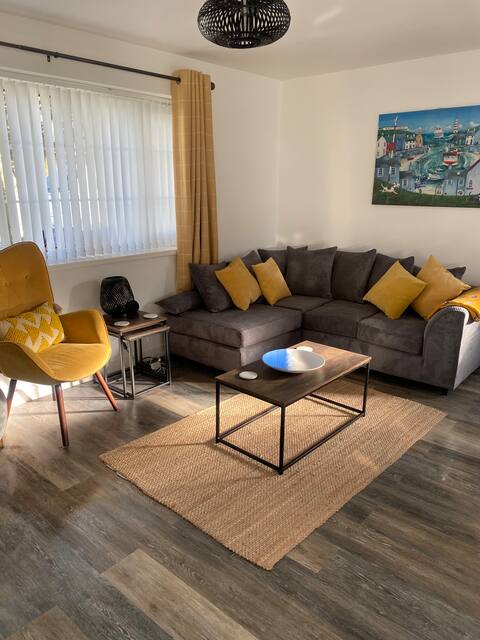
Top Performing Airbnb Properties in Scurlage (2025)
Benchmark your potential! Explore examples of top-performing Airbnb properties in Scurlagebased on Trailing Twelve Month (TTM) revenue. Analyze their characteristics, revenue, occupancy rate, and ADR to understand what drives success in this market.
Hawthorns in Gower
Entire Place • 4 bedrooms

Gorgeous beach home in Gower!
Entire Place • 3 bedrooms
44 Gower holiday village, Ty Gŵyr Cosy Chalet
Entire Place • 2 bedrooms
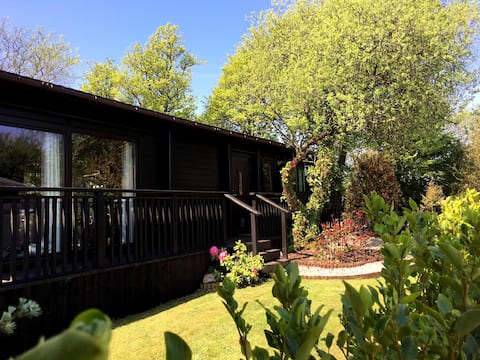
Pilton Moor Lodge
Entire Place • 2 bedrooms

Ocean Breeze, Gower Holiday Village. Allows Dogs
Entire Place • 2 bedrooms
Pigsty, cute holiday cottage in Gower.
Entire Place • 1 bedroom
Note: Performance varies based on location, size, amenities, seasonality, and management quality. Data reflects the past 12 months.
Top Performing Airbnb Hosts in Scurlage (2025)
Learn from the best! This table showcases top-performing Airbnb hosts in Scurlage based on the number of properties managed and estimated total revenue over the past year. Analyze their scale and performance metrics.
| Host Name | Properties | Grossing Revenue | Stay Reviews | Avg Rating |
|---|---|---|---|---|
| Candan Banu | 3 | $69,583 | 65 | 4.92/5.0 |
| Cottages | 1 | $62,215 | 19 | 4.53/5.0 |
| Jason | 1 | $50,269 | 23 | 4.83/5.0 |
| Emma | 2 | $48,583 | 59 | 2.35/5.0 |
| Julie | 1 | $40,023 | 28 | 4.96/5.0 |
| Sarah | 1 | $36,123 | 113 | 4.96/5.0 |
| Charlotte | 1 | $32,954 | 29 | 4.93/5.0 |
| Samantha | 1 | $26,273 | 40 | 4.98/5.0 |
| Alison | 1 | $24,434 | 22 | 4.50/5.0 |
| Richard | 1 | $21,382 | 33 | 4.82/5.0 |
Analyzing the strategies of top hosts, such as their property selection, pricing, and guest communication, can offer valuable lessons for optimizing your own Airbnb operations in Scurlage.
Dive Deeper: Advanced Scurlage STR Market Data (2025)
Ready to unlock more insights? AirROI provides access to advanced metrics and comprehensive Airbnb data for Scurlage. Explore detailed analytics beyond this report to refine your investment strategy, optimize pricing, and maximize your vacation rental profits.
Explore Advanced MetricsScurlage Short-Term Rental Market Composition (2025): Property & Room Types
Room Type Distribution
Property Type Distribution
Market Composition Insights for Scurlage
- The Scurlage Airbnb market composition is heavily skewed towards Entire Home/Apt listings, which make up 100% of the 28 active rentals. This indicates strong guest preference for privacy and space.
- Looking at the property type distribution in Scurlage, House properties are the most common (78.6%), reflecting the local real estate landscape.
- Houses represent a significant 78.6% portion, catering likely to families or larger groups.
- The presence of 7.1% Hotel/Boutique listings indicates integration with traditional hospitality.
- Smaller segments like others, apartment/condo (combined 7.2%) offer potential for unique stay experiences.
Scurlage Airbnb Room Capacity Analysis (2025): Bedroom Distribution
Distribution of Listings by Number of Bedrooms
Room Capacity Insights for Scurlage
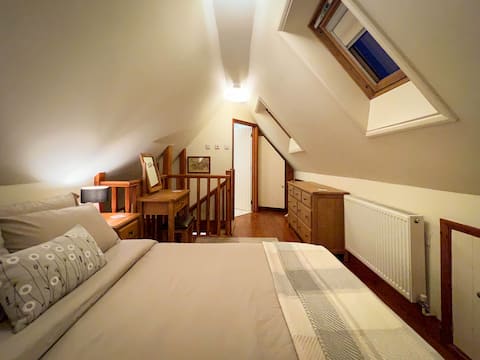
- The dominant room capacity in Scurlage is 2 bedrooms listings, making up 64.3% of the market. This suggests a strong demand for properties suitable for couples or solo travelers.
- Together, 2 bedrooms and 1 bedroom properties represent 85.7% of the active Airbnb listings in Scurlage, indicating a high concentration in these sizes.
Scurlage Vacation Rental Guest Capacity Trends (2025)
Distribution of Listings by Guest Capacity
Guest Capacity Insights for Scurlage
- The most common guest capacity trend in Scurlage vacation rentals is listings accommodating 4 guests (42.9%). This suggests the primary traveler segment is likely small families or groups.
- Properties designed for 4 guests and 5 guests dominate the Scurlage STR market, accounting for 60.8% of listings.
- 21.4% of properties accommodate 6+ guests, serving the market segment for larger families or group travel in Scurlage.
- On average, properties in Scurlage are equipped to host 4.5 guests.
Scurlage Airbnb Booking Patterns (2025): Available vs. Booked Days
Available Days Distribution
Booked Days Distribution
Booking Pattern Insights for Scurlage
- The most common availability pattern in Scurlage falls within the 181-270 days range, representing 35.7% of listings. This suggests many properties have significant open periods on their calendars.
- Approximately 71.4% of listings show high availability (181+ days open annually), indicating potential for increased bookings or specific owner usage patterns.
- For booked days, the 31-90 days range is most frequent in Scurlage (32.1%), reflecting common guest stay durations or potential owner blocking patterns.
- A notable 32.1% of properties secure long booking periods (181+ days booked per year), highlighting successful long-term rental strategies or significant owner usage.
Scurlage Airbnb Minimum Stay Requirements Analysis
Distribution of Listings by Minimum Night Requirement
1 Night
3 listings
11.1% of total
2 Nights
7 listings
25.9% of total
3 Nights
8 listings
29.6% of total
4-6 Nights
3 listings
11.1% of total
7-29 Nights
1 listings
3.7% of total
30+ Nights
5 listings
18.5% of total
Key Insights
- The most prevalent minimum stay requirement in Scurlage is 3 Nights, adopted by 29.6% of listings. This highlights the market's preference for longer commitments.
- A significant segment (18.5%) caters to monthly stays (30+ nights) in Scurlage, pointing to opportunities in the extended-stay market.
Recommendations
- Align with the market by considering a 3 Nights minimum stay, as 29.6% of Scurlage hosts use this setting.
- If feasible, allowing 1-night stays, especially midweek or during low season, could capture last-minute bookings, as only 11.1% currently do.
- Explore offering discounts for stays of 30+ nights to attract the 18.5% of the market seeking extended stays.
- Adjust minimum nights based on seasonality – potentially shorter during low season and longer during peak demand periods in Scurlage.
Scurlage Airbnb Cancellation Policy Trends Analysis (2025)
Super Strict 60 Days
1 listings
4% of total
Flexible
2 listings
8% of total
Moderate
4 listings
16% of total
Firm
12 listings
48% of total
Strict
6 listings
24% of total
Cancellation Policy Insights for Scurlage
- The prevailing Airbnb cancellation policy trend in Scurlage is Firm, used by 48% of listings.
- A majority (72.0%) of hosts in Scurlage utilize Firm or Strict policies, indicating a market where hosts prioritize booking security.
Recommendations for Hosts
- Consider adopting a Firm policy to align with the 48% market standard in Scurlage.
- Regularly review your cancellation policy against competitors and market demand shifts in Scurlage.
Scurlage STR Booking Lead Time Analysis (2025)
Average Booking Lead Time by Month
Booking Lead Time Insights for Scurlage
- The overall average booking lead time for vacation rentals in Scurlage is 53 days.
- Guests book furthest in advance for stays during January (average 109 days), likely coinciding with peak travel demand or local events.
- The shortest booking windows occur for stays in November (average 28 days), indicating more last-minute travel plans during this time.
- Seasonally, Summer (90 days avg.) sees the longest lead times, while Fall (47 days avg.) has the shortest, reflecting typical travel planning cycles.
Recommendations for Hosts
- Use the overall average lead time (53 days) as a baseline for your pricing and availability strategy in Scurlage.
- For January stays, consider implementing length-of-stay discounts or slightly higher rates for bookings made less than 109 days out to capitalize on advance planning.
- Target marketing efforts for the Summer season well in advance (at least 90 days) to capture early planners.
- Monitor your own booking lead times against these Scurlage averages to identify opportunities for dynamic pricing adjustments.
Popular & Essential Airbnb Amenities in Scurlage (2025)
Amenity Prevalence
Amenity Insights for Scurlage
- Essential amenities in Scurlage that guests expect include: Smoke alarm, TV, Free parking on premises, Kitchen. Lacking these (any) could significantly impact bookings.
- Popular amenities like Backyard, Hot water, Heating are common but not universal. Offering these can provide a competitive edge.
Recommendations for Hosts
- Ensure your listing includes all essential amenities for Scurlage: Smoke alarm, TV, Free parking on premises, Kitchen.
- Prioritize adding missing essentials: TV, Free parking on premises, Kitchen.
- Consider adding popular differentiators like Backyard or Hot water to increase appeal.
- Highlight unique or less common amenities you offer (e.g., hot tub, dedicated workspace, EV charger) in your listing description and photos.
- Regularly check competitor amenities in Scurlage to stay competitive.
Scurlage Airbnb Guest Demographics & Profile Analysis (2025)
Guest Profile Summary for Scurlage
- The typical guest profile for Airbnb in Scurlage consists of primarily domestic travelers (95%), often arriving from nearby England, typically belonging to the Post-2000s (Gen Z/Alpha) group (50%), primarily speaking English or French.
- Domestic travelers account for 94.8% of guests.
- Key international markets include United Kingdom (94.8%) and Switzerland (0.8%).
- Top languages spoken are English (69.3%) followed by French (8.9%).
- A significant demographic segment is the Post-2000s (Gen Z/Alpha) group, representing 50% of guests.
Recommendations for Hosts
- Target domestic marketing efforts towards travelers from England and London.
- Tailor amenities and listing descriptions to appeal to the dominant Post-2000s (Gen Z/Alpha) demographic (e.g., highlight fast WiFi, smart home features, local guides).
- Highlight unique local experiences or amenities relevant to the primary guest profile.
- Consider seasonal promotions aligned with peak travel times for key origin markets.
Nearby Short-Term Rental Market Comparison
How does the Scurlage Airbnb market stack up against its neighbors? Compare key performance metrics like average monthly revenue, ADR, and occupancy rates in surrounding areas to understand the broader regional STR landscape.
| Market | Active Properties | Monthly Revenue | Daily Rate | Avg. Occupancy |
|---|---|---|---|---|
| Llanrhidian | 15 | $4,842 | $386.18 | 53% |
| Crai | 20 | $4,799 | $371.85 | 46% |
| Trenance | 19 | $4,795 | $428.63 | 43% |
| Angle | 13 | $4,602 | $384.81 | 42% |
| Abbeycwmhir | 10 | $4,502 | $259.19 | 49% |
| Ludchurch | 15 | $4,354 | $291.87 | 43% |
| Chirbury | 14 | $4,233 | $702.20 | 41% |
| Cwmann | 17 | $4,162 | $228.82 | 54% |
| Borth-y-Gêst | 18 | $4,139 | $240.51 | 55% |
| Redberth | 29 | $4,103 | $223.37 | 59% |